Bullish Divergence on Daily tf.2084 Closed at 26 (03-07-2025)
Bullish Divergence on Daily tf.
27 - 27.10 is the resistance for now.
Crossing & Sustaining this level may
lead it towards 28.50 - 29 initially.
It should not break 19.50 now.
Tasianalysis

Bullish
Bullish Divergence on Daily tf.
Immediate resistance is around 83 - 83.50
Very important to cross & sustain 86 - 87
for further upside.
However, should not breakk 65.50 , otherwise
we may witness further selling pressure.

TASI Weekly Outlook – Bullish Play in Progress!📈 TASI Weekly Outlook – Bullish Play in Progress! 💥
After forming a solid base around the Monthly Type 2 Zone, TASI is showing bullish signs of accumulation. We're now watching a potential explosive move toward the Context Target at 12,895.754 🚀.
The current structure suggests a short-term pullback before continuation—ideal for bulls waiting for a clean entry. Eyes on the prize as we aim for higher highs. 🔥
🧠 By: Asif Brain Wave

Make it or Break it Situation.
Currently at Rectangular Channel Bottom.
Few Green Candles at Current level may bounce
the price but 254 - 257 is a Resistance area that
needs to be Crossed & Sustain.
Next Important Resistance level is around 288 - 290.
However, if the Current Level is broken, we may
see further selling pressure & it may touch 240 & then
may be the range of 210 - 222 in worst case.

Morning Star formation on Daily TF but..Morning Star formation on Daily TF.
Monthly Closing above 29 would be a Positive Sign.
However, 28 - 29 can be a Good Support Zone.
28.50 should not be broken, otherwise further
Selling Pressure can be witnessed.
On the flip side, 32 - 32.50 is an Important Resistance.
However, only Morning Star formation is not enough, because
it is currently at Strong Resistance around 32 - 32.5, so
let it sustain this level.
Sustaining this level may give 2-4 riyals gain.

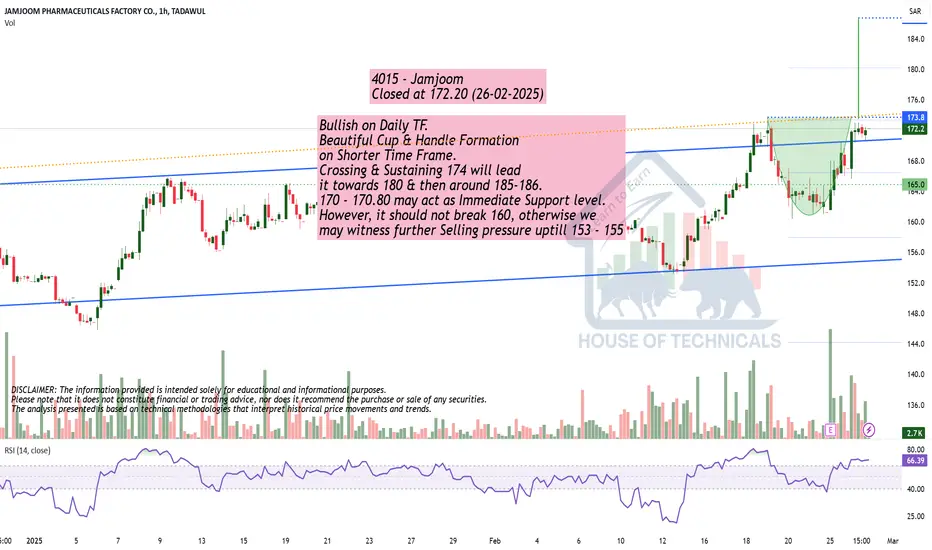
Bullish on Daily TF.Bullish on Daily TF.
Beautiful Cup & Handle Formation
on Shorter Time Frame.
Crossing & Sustaining 174 will lead
it towards 180 & then around 185-186.
170 - 170.80 may act as Immediate Support level.
However, it should not break 160, otherwise we
may witness further Selling pressure uptill 153 - 155
TASI IS GOING BEARISHAs you can notice on the chart, TASI as I told you in older posts, it grabbed the LQ at 12,302.190-12,333.861, gave us an entry point and now it is heading towards the level 11591.374 where it will grab the LQ.
For the people who have already bought, you can close and enjoy your profits, and for those who are willing to buy, the wise thing to do is hold your funds.
For further questions, don't hesitate to ask!
Follow for more!

UPDATE ON TASIA month ago, I posted that TASI will continue going lower to reach 11,439.529, and it came up the grab the LQ at 12182.412 now it will continue lower.
Again this movements fooled some people and bought higher now they're in losses and looking for how to recover.
Don't buy TASI now, wait for it to quit the consolidation level then you can buy.
Follow for more!

DON'T BUY TASIAs you can notice on the chart, TASI filled the Price Gap we had at 12,152.282-12,229.265. Now it is heading towards the Liquidity level at 11,439.529.
If you already bought on TASI sell your shares and wait for the next entry,and if you're welling to buy it's ot the right time to do so. You can check on the other stocks I posted and buy on them and follow me for more trades on Saudi Stock Market!

TASI ANALYSIS after taken liquidity of sell side we will see an expansion to taken liquidity of buyside and fill gap of down trend

Tasi Daily Analysis Here the Tasi daily analysis we have good area for buying opportunity the trend is bullish and the targets are clear to see , Enjoy

🚀 TASI surge 24% in 2023: Decoding the next move in 2024.Tadawul All Share Index (TADAWUL:TASI)
1) In the day chart we noticed that the Tadawul All Share Index has formed a head and shoulder pattern from April 2023 - September 2023 and a obvious neckline breakout marks the end of the H&S pattern.
2) At the end of H&S pattern we noticed a big red candle closed at 50% into the body of the previous green candle. This is a trend reversal sign known as Dark Cloud candles.
3) Since the August 2023 a sharp down trend consist with mostly the red candles. It signifies strong bearish momentum. TASI had fallen from 11933 to 10262, nearly 14% correction in a span of just 12 weeks.
4) We noticed the bullish flag pattern started forming since mid Nov 2023, where two parallel trendlines preceded by a flag pole which clearly indicates strong bull's presence in the index.
5) Dec 2023 onwards TASI started moving straight upward after flag pattern breakout and again forming a bullish flag pattern. Such back to back flag breakouts give prominent signal of long bullish run to be continue.
Happy Trading!
Cheers to this bull run!

Tasi - Bullish Signs Show some good signs:
1- 200 moving average breakout
2- level 11159.5 break
If price continue up move
target will be:
TP1: 11933 level

ABDULMOHSEN ALHOKAIR 1820 - Bullish Signs Show some good signs:
1- First 200 MA retest
2- 2.07 support turn to resistance with good bullish candle
If price continue up
target will be:
TP1: 2.19 level
TP2: Daily 200 MA

HALWANI BROS. CO. 6001 - Bullish Signs Show some good signs:
1- Bullish H&S
2- Retest VAWAP
If price continue up move
target will be:
TP1: 52 level
TP2: Daily 200 MA
TP3: Weekly 200 MA (pink line)

long for long time, TASI. The main stock market index in Saudi Arabia (TASI) increased 604 points or 5.76% since the beginning of 2023, according to trading on a contract for difference (CFD) that tracks this benchmark index from Saudi Arabia.

TASI has a promising opportunity Dear supporters
I got a lot of request to analyze the Saudi Index TASI, here we are.
most of the stocks now at the accumulations phase and I see a very good investments and trading opportunity.
good luck every one


extra stock in saudi marketno entry at that point we can enter at confirmation when pentrating the area shown in the video


Tadawul All Shares Index Weekly AnalysisAfter change of character and break of structure and rejection of the Golden Zone Fibonacci 50% and 60% and fill FVG '' Fare Value Gap '" in this zone we will see a contuniation of up trend to fill FVG of down trend and take liquidity of the buy side

1010 RIYADH BANKh4 timeframe price is bullish.
falls becouse takenout trendline liqudity.
only order block at extreme point.
i will enter if in ltf any choch or flip or liqudity sweap entry.

TASI WEEKLY ANALYSIS after the creation of engulfing candle we will see a continuation of uptrend towards supply zone
