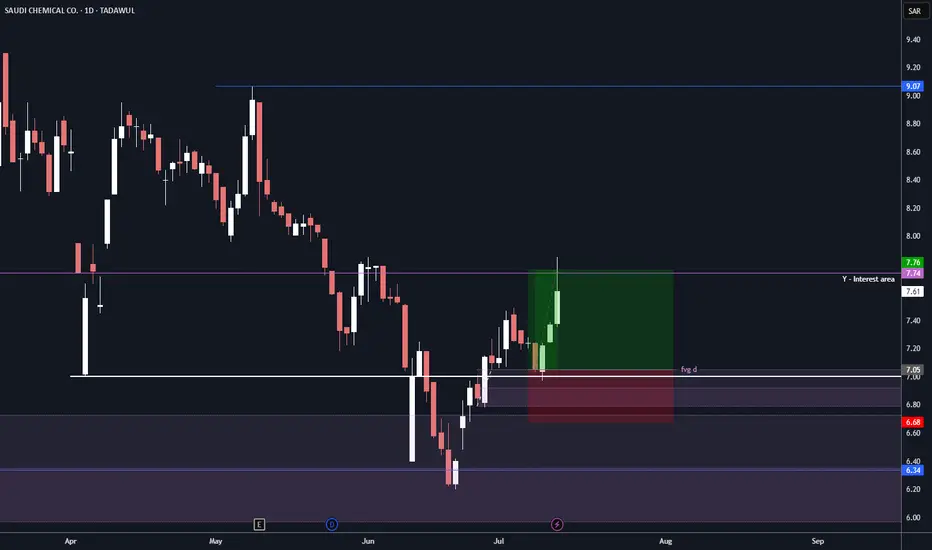
Bullish Signs on 2230 TASI Trade was on 2230 reason to enter:
Bounce from Monthly level blue line which also MONTH FVG.
Fake breakout white line in Monthly.
Entry in Daily FVG.
Target 2RR
Tasisignals
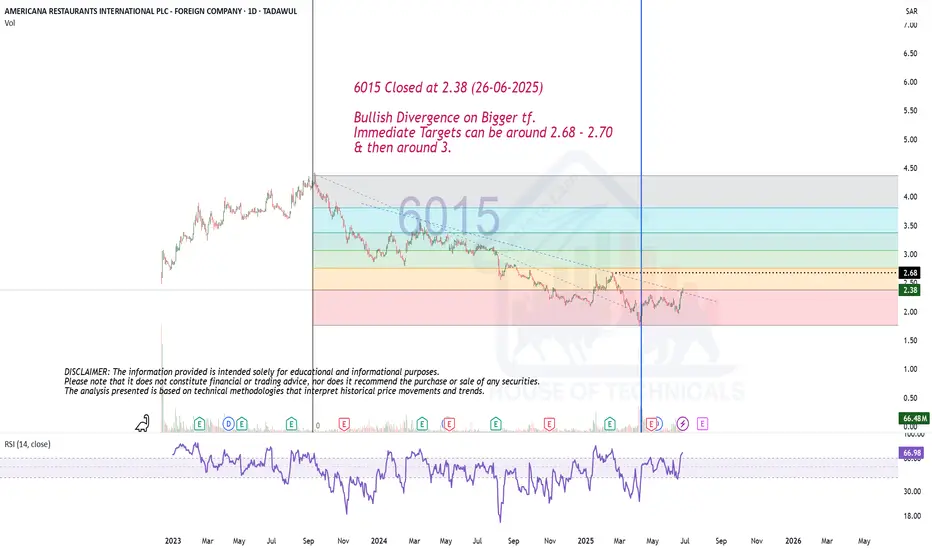
Bullish Divergence on Bigger tf.6015 Closed at 2.38 (26-06-2025)
Bullish Divergence on Bigger tf.
Immediate Targets can be around 2.68 - 2.70
& then around 3.
TASI Weekly Outlook – Bullish Play in Progress!📈 TASI Weekly Outlook – Bullish Play in Progress! 💥
After forming a solid base around the Monthly Type 2 Zone, TASI is showing bullish signs of accumulation. We're now watching a potential explosive move toward the Context Target at 12,895.754 🚀.
The current structure suggests a short-term pullback before continuation—ideal for bulls waiting for a clean entry. Eyes on the prize as we aim for higher highs. 🔥
🧠 By: Asif Brain Wave

2222 – Saudi Arabian Oil Co | Long Idea – Monthly Chart Analysis📈 2222 – Saudi Arabian Oil Co | Long Idea – Monthly Chart Analysis
Price has reached a Monthly Demand Zone, where strong historical buying interest was seen. After a consistent downtrend, we are now approaching a potential accumulation zone.
🟦 Trade Idea:
Entry Zone: 23.90 – 25.50 (within Monthly Demand)
Stop Loss: Below 22.30 (Monthly swing low)
Target 1: 30.35 (Monthly Fair Value Gap – FVG)
Risk:Reward: Excellent potential with ~17.6% upside
📊 Narrative: This setup aligns with Smart Money Concepts (SMC) and ICT methodology:
Liquidity sweep at the low
Reversal from Demand
Targeting FVG imbalance above
❤️ A potential bullish move is anticipated, tapping into premium pricing around 30.35, which may act as a magnet for price.
🔔 Watch for bullish confirmation candle or a shift in structure (CHoCH) on lower timeframes for refined entry.

TASI IS PREPARING AN ENTRYAfter that TASI has taken the liquidity at 11,553, it just gave us an indication that it will start going bullish, no clean entry for now, but we'll keep waiting.
Meanwhile, my clients and I have taken other trades on 3 other stocks that are still in a safe zone, waiting for them to go higher so I can share them to the public.
As soon as I catch the entry and share it to my clients, I will share it to the public.
If you really care about taking clean entries, you must wait for the confirmation of the up movement then you can have a safe entry.
Follow for more!

UPDATE ON TASIA month ago, I posted that TASI will continue going lower to reach 11,439.529, and it came up the grab the LQ at 12182.412 now it will continue lower.
Again this movements fooled some people and bought higher now they're in losses and looking for how to recover.
Don't buy TASI now, wait for it to quit the consolidation level then you can buy.
Follow for more!

TASI TADAWUL 4H ANALYSIS After taken buyside liquidity and retest FVG SIBI and displacement candle we will see a drop of the price to taken sell side

Saudi Manpower BullishGood afternoon, investors! Today, we’re diving into the technical analysis of Saudi manpower , a stock that has shown promising signs of bullish momentum. We have identified key level on the carts with Strick stop loss. based on the key technical indicators and chart patterns that support our positive outlook.
DYOR # Do your own research

Tasi Daily Analysis Here the Tasi daily analysis we have good area for buying opportunity the trend is bullish and the targets are clear to see , Enjoy


🚀 TASI surge 24% in 2023: Decoding the next move in 2024.Tadawul All Share Index (TADAWUL:TASI)
1) In the day chart we noticed that the Tadawul All Share Index has formed a head and shoulder pattern from April 2023 - September 2023 and a obvious neckline breakout marks the end of the H&S pattern.
2) At the end of H&S pattern we noticed a big red candle closed at 50% into the body of the previous green candle. This is a trend reversal sign known as Dark Cloud candles.
3) Since the August 2023 a sharp down trend consist with mostly the red candles. It signifies strong bearish momentum. TASI had fallen from 11933 to 10262, nearly 14% correction in a span of just 12 weeks.
4) We noticed the bullish flag pattern started forming since mid Nov 2023, where two parallel trendlines preceded by a flag pole which clearly indicates strong bull's presence in the index.
5) Dec 2023 onwards TASI started moving straight upward after flag pattern breakout and again forming a bullish flag pattern. Such back to back flag breakouts give prominent signal of long bullish run to be continue.
Happy Trading!
Cheers to this bull run!

Tasi - Bullish Signs Show some good signs:
1- 200 moving average breakout
2- level 11159.5 break
If price continue up move
target will be:
TP1: 11933 level

ABDULMOHSEN ALHOKAIR 1820 - Bullish Signs Show some good signs:
1- First 200 MA retest
2- 2.07 support turn to resistance with good bullish candle
If price continue up
target will be:
TP1: 2.19 level
TP2: Daily 200 MA

HALWANI BROS. CO. 6001 - Bullish Signs Show some good signs:
1- Bullish H&S
2- Retest VAWAP
If price continue up move
target will be:
TP1: 52 level
TP2: Daily 200 MA
TP3: Weekly 200 MA (pink line)

TASI has a promising opportunity Dear supporters
I got a lot of request to analyze the Saudi Index TASI, here we are.
most of the stocks now at the accumulations phase and I see a very good investments and trading opportunity.
good luck every one

extra stock in saudi marketno entry at that point we can enter at confirmation when pentrating the area shown in the video


8010 sell limit till the target area shown8010 is saudia market is going toward the target area around the support and the 61 Fibonacci.
So entering buy position isn't good idea.

Exciting News for 2083!🚀💧📈 Exciting News for 2083! The Power and Water are Gearing Up for Bullish Trends 📈💧🚀 Based on Smart Money Concepts! Get Ready for an Attractive Opportunity! 💰🔥👀 #InvestmentGains

🔴 TASI 🔴NO LIQUDITY SWEAP NO ENTRY.
STRUCTURE IS CHANGING ANYTIME.
EVERY CANDLE HAS LIQUIDITY.
PRICE ALWAYS NEED LIQUIDITY.
Nobody Knows Where is Price Going.
Hey traders, here is the analysi.
If you guys like my analysis please hit like?? and follow.
Thanks.
SMART MONEY CONCEPT.
identify Liquidity Or Become Liquidity
DISCLAIMER- This is not financial advice.

TASI BUYthere is wonderful investment opportunity on tasi stock ; there is a strong breach of the downtrend a restest of the area and a bounce from it with a correction on the same area fiboacci 50 YOU CAN SEE MY ANALYSIS MY PAGE

TASI WEEKLY ANALYSIS after the creation of engulfing candle we will see a continuation of uptrend towards supply zone

Tadawul All Shares IndexTADAWUL:TASI
Tadawul All Shares Index
The general index of the Saudi market has come down and we have already identified the areas of demand and we said on Twitter that it will go up when it trades in and so on
