Risk Management in Options TradingTrading options can be exciting and rewarding—but it's also full of risks. Without proper risk management, even the best strategies can lead to heavy losses. In this comprehensive guide, we'll dive deep into how to manage risk in options trading, covering everything from the basics to advanced techniques.
1. Understanding Risk in Options Trading
Before we dive into managing risk, it’s crucial to understand where risk comes from in options trading. Options are complex instruments that behave differently than stocks. The key sources of risk include:
A. Price Movement (Delta Risk)
When the price of the underlying stock moves up or down, the value of the option changes. This is known as Delta risk. A call option gains value when the stock goes up, and a put gains value when it goes down.
B. Time Decay (Theta Risk)
Options lose value over time. Even if the stock price doesn’t move, the option could still lose value as the expiration date approaches. This is known as Theta decay or time decay.
C. Volatility (Vega Risk)
Volatility reflects how much a stock moves. High volatility increases an option's premium. But if implied volatility falls, the value of your option might drop—even if your price prediction is correct.
D. Interest Rates and Dividends (Rho and Dividend Risk)
Although less impactful, interest rates and dividend changes can also influence option prices. These are more important for longer-dated options.
2. Why Is Risk Management Critical in Options?
Options give traders leverage—a small investment can control a large position. While this magnifies profits, it also increases losses. Many beginners fall into the trap of chasing big gains, only to blow up their accounts when trades go wrong.
Good risk management doesn’t eliminate risk—it helps you survive bad trades and stay in the game long enough for your edge to work.
3. Core Principles of Options Risk Management
Here are the foundational principles every options trader should follow:
A. Never Risk More Than You Can Afford to Lose
It sounds obvious, but many traders ignore this. Only use disposable capital, not money meant for rent, bills, or emergencies.
B. Position Sizing
This is one of the most powerful tools in risk management. Don’t bet your entire capital on a single trade. A common rule is to risk 1-2% of your capital on any trade. That way, even a string of losing trades won’t wipe you out.
C. Diversify Your Trades
Avoid putting all your trades on the same stock or sector. Diversification can reduce risk from unexpected news events or market shocks.
D. Know Your Maximum Loss
Before entering any trade, calculate your maximum potential loss. With long calls and puts, your loss is limited to the premium paid. But with short options or complex strategies like spreads, losses can be higher or even unlimited.
4. Practical Risk Management Techniques
A. Use Stop-Loss Orders (Where Applicable)
While options don’t always behave like stocks, you can still set a mental or physical stop-loss based on:
Percentage loss (e.g., exit if the option loses 50%)
Underlying price level (e.g., exit if stock breaks below a key level)
Time decay (e.g., exit 5 days before expiration to avoid Theta crush)
❗ Note: Stop-losses can be tricky with options because of wide bid-ask spreads. It’s important to use limit orders or mental stops to avoid slippage.
B. Avoid Naked Options (Especially Selling)
Selling naked calls or puts can expose you to unlimited risk. Unless you have a large account and full understanding, stick to defined-risk strategies like:
Spreads (credit/debit)
Iron condors
Butterflies
Covered calls
Protective puts
C. Hedge Your Positions
Hedging is like buying insurance. You can reduce risk by combining options in a way that limits losses.
Example:
If you sell a naked put, you can turn it into a bull put spread by buying a lower strike put. This limits your downside if the stock crashes.
D. Use Probability and Greeks
Understanding the "Greeks" can help you analyze risk exposure:
Greek What it Measures Risk Managed
Delta Price sensitivity Directional risk
Theta Time decay Time-related loss
Vega Volatility impact Volatility exposure
Gamma Delta’s change rate Acceleration of price impact
Rho Interest rate impact (minor risk)
Knowing your Greeks allows you to adjust trades when risks become too high.
5. Options Strategies for Risk Management
Some strategies are naturally more “risky,” while others are designed to limit downside. Let’s look at popular risk-managed strategies:
A. Covered Call
You own 100 shares of a stock and sell a call option. This gives you income (premium) and limits upside risk.
Risk: Stock falls
Reward: Premium + upside to strike price
B. Protective Put
You buy a put while holding the stock. It protects you from downside losses, like insurance.
Risk: Cost of put (premium)
Reward: Unlimited upside; limited downside
C. Vertical Spreads (Credit and Debit)
These involve buying and selling options at different strikes.
Bull Call Spread: Buy call + sell higher call
Bear Put Spread: Buy put + sell lower put
Both strategies have limited risk and reward, making them ideal for risk-conscious traders.
D. Iron Condor
You sell a call spread and a put spread on the same stock. Profitable when the stock stays in a defined range.
Risk: Limited to width of spread minus premium
Reward: Net credit received
This is a great strategy for sideways markets and offers good risk/reward if managed well.
6. Managing Risk Over Time
A. Adjusting Trades
If a trade moves against you, you don’t always have to take the loss. You can:
Roll the option to a later expiration
Adjust strikes to collect more credit or redefine risk
Convert to a spread or different strategy
However, be careful not to over-manage trades, which can lead to complex and risky positions.
B. Avoid Trading Around Events
Earnings announcements, Fed meetings, and budget declarations can cause huge volatility spikes. Option premiums are often inflated before such events. If you trade them, keep position size small and use defined-risk trades only.
Tata
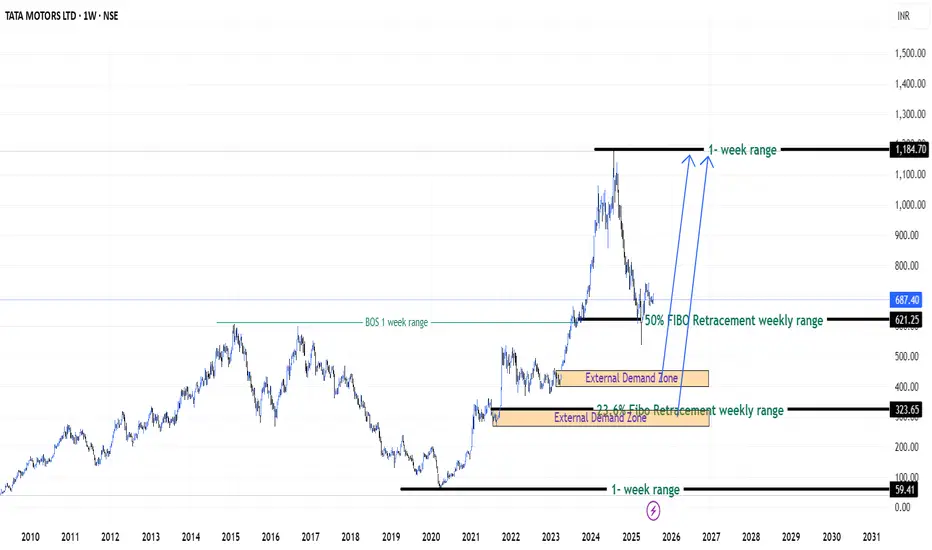
Patience on Tata Motors Stock (India) - {27/07/2025}Educational Analysis says that Tata Motors (Indian Stock) may give trend Trading opportunities from this range, according to my technical analysis.
Broker - NA
So, my analysis is based on a top-down approach from weekly to trend range to internal trend range.
So my analysis comprises of two structures: 1) Break of structure on weekly range and 2) Trading Range to fill the remaining fair value gap
Let's see what this Stock brings to the table for us in the future.
DISCLAIMER:-
This is not an entry signal. THIS IS FOR EDUCATIONAL PURPOSES ONLY.
I HAVE NO CONCERNS WITH YOUR PROFITS OR LOSS,
Happy Trading,
Stocks & Commodities TradeAnalysis.
My Analysis is:-
Short term trend may be go to the external demand zone.
Long term trend breaks the new high after going from discount zone.
Tata Chemical, #tata chem# tata chemical📉 Trend Reversal from ₹790–₹800 Support Zone
'W' pattern formed on daily chart — trend reversal signal.
Bottom range & neckline breakout confirm bullish momentum.
Price consolidating above W base, showing strength.
📈 Bias: Bullish above neckline; potential for further upside.
🗓️ Upcoming Event: Q1 results due soon — may act as a trigger for next move.
⚠️ Risk: Breakdown below ₹890 could negate the setup CMP = 962.65 total 70 points nearly 7% SL.

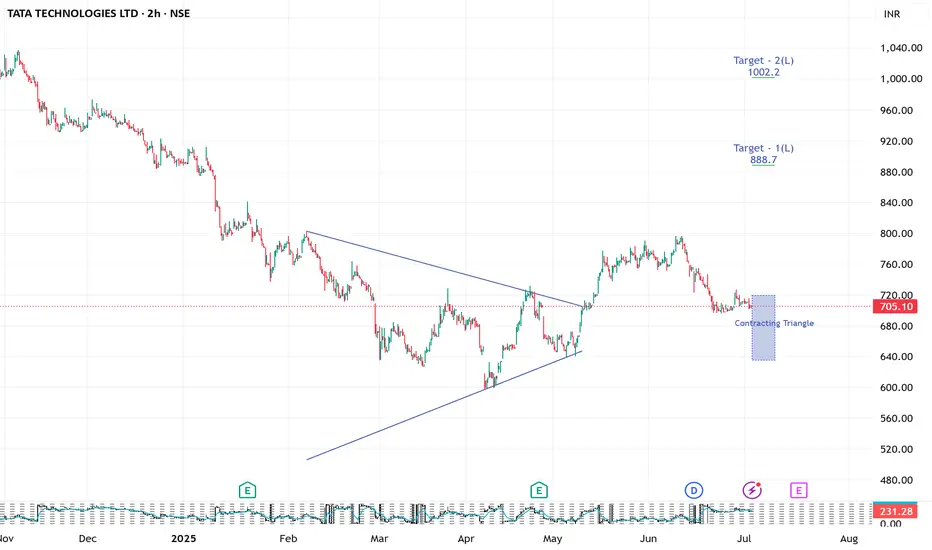
TATA TECHNOLGIES looking strong 2 hrs ( short to medium term
LOOKING stable and strong bullish contracting triangle
pattern suggest us abv 722 closing
price action may show some strength
These classic patterns sometime shows sparkle in price action
pattern may be wrong
do your analysis
this is for educational purpose
TTML Ready as Next Multibagger 332/ 410 long Term onlyTTML showing real good setup as per monthly counts as we can see in our counts
every dip is buying opportunity for long term investors
possible entry 48.44
open to test levels - 332 -410-537
next grand cycle suggests its good time as buy setup formation running now
if sustain current levels on monthly basis that can ensure that counts are correct
Elliot wave theory consist multiple forecasts depends upon price action various time degree levels
our counts may be wrong
please do your own analysis before you enter into any sort of trading
CHARTS PUBLISH to learn /understand EW method
only education based only
share your counts- lets learn together !!! cheers

Buy the Dip: Tata Motors Set to Zoom from ₹713 to ₹799!Consider buying Tata Motors stock below ₹713 with a long-term target of ₹799, offering a potential profit of approximately 12%.

TATATECHKeep eye on TATATECH. If the price moves above 732, consider buying with a small SL.
Confirmation of the head and shoulders pattern occurs when the price breaks decisively below the neckline
Disclaimer:
This is not financial advice. Please do your own research or consult with a financial advisor before making any investment decisions. Investments in stocks can be risky and may result in loss of capital.

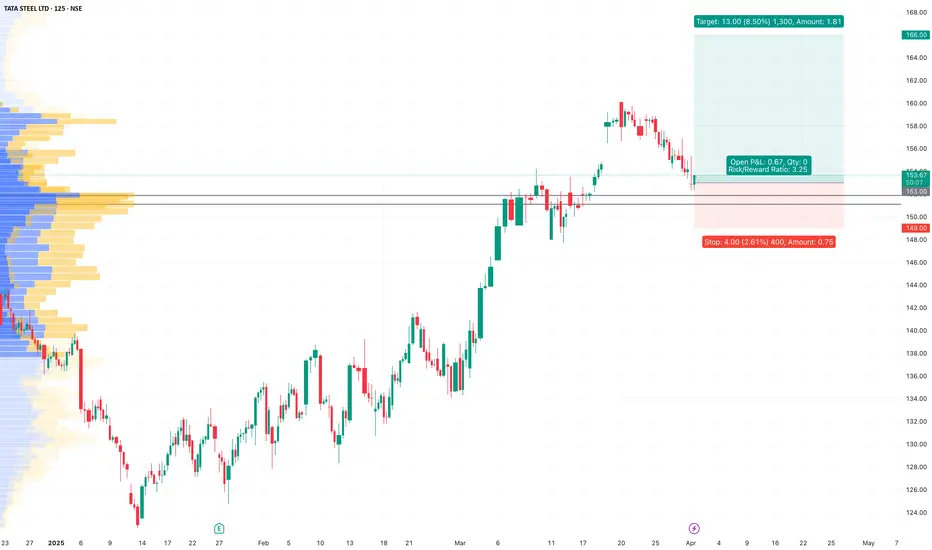
TATASTEEL - Tata Steel LTD (2 hours chart, NSE) - Long PositionTATASTEEL - Tata Steel LTD (2 hours chart, NSE) - Long Position; short-term research idea.
Risk assessment: High {volume & support structure integrity risk}
Risk/Reward ratio ~ 3.25
Current Market Price (CMP) ~ 154
Entry limit ~ 153
1. Target limit ~ 158 (+3.27%; +5 points)
2. Target limit ~ 161 (+5.23%; +8 points)
3. Target limit ~ 166 (+8.50%; +13 points)
Stop order limit ~ 149 (-2.61%; -4 point)
Disclaimer: Investments in securities markets are subject to market risks. All information presented in this group is strictly for reference and personal study purposes only and is not a recommendation and/or a solicitation to act upon under any interpretation of the letter.
LEGEND:
{curly brackets} = observation notes
= important updates
(parentheses) = information details
~ tilde/approximation = variable value
-hyphen = fixed value
TRENT - Trent LTD (2 hours chart, NSE) - Long PositionTRENT - Trent LTD (2 hours chart, NSE) - Long Position; short-term research idea.
Risk assessment: Medium {volatility risk}
Risk/Reward ratio ~ 2
Current Market Price (CMP) ~ 5140
Entry limit ~ 5080 to 4940 (Avg. - 5010) on April 25, 2025
1. Target limit ~ 5145 (+2.69%; +135 points)
2. Target limit ~ 5280 (+5.39%; +270 points)
Stop order limit ~ 4875 (-2.69%; -135 points)
Disclaimer: Investments in securities markets are subject to market risks. All information presented in this group is strictly for reference and personal study purposes only and is not a recommendation and/or a solicitation to act upon under any interpretation of the letter.
LEGEND:
{curly brackets} = observation notes
= important updates
(parentheses) = information details
~ tilde/approximation = variable value
-hyphen = fixed value

Tata Motors Technical🇮🇳🛵#TATA Motors is trading at ₹649.85 on the NSE, at the time of tweet, reflecting a slight increase of 5% from the previous Weak close.
Over the past three years, the stock has delivered a strong return of 43.57%, outperforming the Nifty 100’s 37.57%.
In my views bottom has been made and right time add in the portfolio
Chart For your reference

Tata Motors Its near supportTata Motors Near Support 626 | Technical Analysis
Tata Motors is currently trading near its key support level of ₹626. If this level holds, we may see a potential rebound, while a breakdown could lead to further downside. Traders should watch for confirmation signals and volume trends before making decisions. Keep an eye on RSI, moving averages, and trendline support for better insights.
🔹 Support : ₹626
🔹 Resistance : Next levels to watch
🔹 Trend : Monitor for breakout or reversal signals
#TataMotors #StockAnalysis #SupportLevel #TradingView #StockMarket

Beautifully making HH HL on Monthly TF.Beautifully making HH HL on Monthly TF.
However, Bearish on Daily TF.
a Perfect Example of Bearish ABCD Reversal Pattern,
Touched Point D & Reversed.
Now, either it should close above 1520 on Monthly basis
for a positive move probably upto 1600+
else,
the selling pressure may bring it to the Next Support
around 1300 - 1365.
In worst case, it may touch 1140 - 1145.

MRPL in 2nd BUYMRPL under vale is near140-80
margin of safety 50
now its in 2nd buy area so u can avrg the stock

longThe outlook for this automotive giant looks extremely promising, especially with the future of the electric vehicle (EV) market in the next 5 years. As EV adoption continues to accelerate globally, this company is well-positioned to capitalize on the growing demand for sustainable transportation solutions.
I am currently long at 750 and have a plan to add more to my position if the market pulls back from its current levels. Should we see a dip, I believe it presents a valuable opportunity to accumulate more shares at favorable prices.
With the increasing shift toward electric vehicles, the company’s strong market presence and technological advancements should drive substantial growth. Holding for new highs over the next several months and years seems a solid strategy, as the long-term potential remains strong in an evolving, green-focused automotive landscape.


Case Study based on Elliott Waves on exampled chart Tata MotorsHello Friends,
Today we are plotting Elliott wave counts on Case study chart of "Tata Motors Ltd".
In this study we used Elliott Wave Theory & Structures, it involves multiple possibilities, and the analysis presented focuses on one potential scenario. The provided information is for educational purposes only, not trading advice. There's a risk of being completely wrong, and users are warned not to trade or invest solely based on this study. The content is not an advisory and does not guarantee profits, We are not responsible for any kind of profits and losses; individuals should consult a financial advisor before making any trading or investment decisions.
I am not Sebi registered analyst.
My studies are for educational purpose only.
Please Consult your financial advisor before trading or investing.
I am not responsible for any kinds of your profits and your losses.
Most investors treat trading as a hobby because they have a full-time job doing something else.
However, If you treat trading like a business, it will pay you like a business.
If you treat like a hobby, hobbies don't pay, they cost you...!
Hope this post is helpful to community
Thanks
RK💕
Disclaimer and Risk Warning.
The analysis and discussion provided on in.tradingview.com is intended for educational purposes only and should not be relied upon for trading decisions. RK_Charts is not an investment adviser and the information provided here should not be taken as professional investment advice. Before buying or selling any investments, securities, or precious metals, it is recommended that you conduct your own due diligence. RK_Charts does not share in your profits and will not take responsibility for any losses you may incur. So Please Consult your financial advisor before trading or investing.

TATA COMMUNICATIONS Swing Trade Hello,
Trend-Based Analysis. Buy the Dips, Sell The Rallies, Also Following the Trend. Let's see where the Price Action takes us, Riding the wave. Potential trade setups based on trend momentum.
Technical analysis based on trend identification and momentum, Looking for high-probability setups within the prevailing trend.
Analyzing the current market trend and potential future price movement. Focusing on risk management and reward-to-risk ratios.
Details is Mentioned in Chart, Read carefully.. .

Voltas Ltd Technical Analysis1.Chart Pattern:
The stock has been consolidating in a descending channel, with a recent breakout above the upper trendline of the channel.
This breakout could indicate a bullish reversal if sustained.
2.Key Levels:
Support Zone: ₹1,670 - ₹1,700 (highlighted area).
Immediate Resistance: ₹1,732 (horizontal dashed black line).
Target 1: ₹1,762 (short-term resistance).
Target 2: ₹1,838 (medium-term resistance).
Target 3: ₹1,926 (long-term resistance).
3.Indicators:
RSI (14): Currently at 48.58, indicating neutral momentum. A move above 50 could strengthen bullish sentiment.
EMA Levels:
20 EMA: ₹1,697 (stock near this level).
50 EMA: ₹1,720.
100 EMA: ₹1,670 (acting as strong support).
200 EMA: ₹1,517 (long-term trend support).
4.Volume Analysis:
A significant spike in volume was observed during the breakout, supporting the bullish case.
5.Price Action:
The breakout candle indicates buying interest. If the stock holds above ₹1,732, it could move toward ₹1,762 and higher levels.
6.Risk-Reward:
Entry Zone: ₹1,700 - ₹1,732 (post-pullback to breakout zone).
Stop Loss: Below ₹1,670 (key support).
Target Range: ₹1,762 – ₹1,926.
Trading Plan
Bullish Scenario: A breakout above ₹1,732 and sustained momentum could lead to ₹1,762 and ₹1,838.
Bearish Risk: If the stock falls back into the channel and breaks below ₹1,670, the downtrend may resume.
Conclusion
Voltas Ltd. is at a critical juncture, showing potential for a bullish breakout. However, confirmation above ₹1,732 is crucial for the upward move. Traders should watch volume and price action for further clarity.

Tata Motors (Daily Timeframe) AnalysisChart Pattern & Trend:
Primary Trend: The stock previously followed a rising channel pattern, peaking near ₹1,176.50. After breaking the channel's lower boundary, it entered a significant downtrend.
Current Trend: Bearish, as the stock has consistently been making lower highs and lower lows.
Fibonacci Levels:
The Fibonacci retracement tool highlights key levels:
61.8% Level (₹880.35): This level acted as a minor support before breaking down.
50% Level (₹788.85): The stock is hovering around this level, attempting to stabilize.
38.2% Level (₹697.40): If the downtrend continues, this could be the next key support.
23.6% Level (₹584.20): A deeper correction might test this level in a prolonged bearish scenario.
Volume Analysis:
Declining volumes suggest weakening momentum on the downside.
A volume spike at key support levels could indicate buying interest.
RSI (Relative Strength Index):
RSI is in the oversold zone or nearing it, indicating potential for a short-term pullback or consolidation.
Key Levels to Watch:
Resistance: ₹880 (61.8% Fibonacci) and ₹900 are immediate resistance zones.
Support: ₹788 (current level) and ₹697 (38.2% Fibonacci) are critical supports.
Potential Scenarios:
Bullish Reversal: A breakout above ₹880 with increasing volumes could signal the beginning of a recovery.
Continued Bearishness: A breakdown below ₹788 could lead the stock toward ₹697 and ₹584.
Trading Strategy:
For Long Positions: Look for reversal patterns around ₹788 or ₹697, supported by RSI divergence and volume confirmation.
For Short Positions: Consider selling near resistance levels like ₹880 with a stop-loss above ₹900.

Go Woke Go Broke TATA Motors. TATA Motors.
Are we going to be selling a huge push to the downside of TATA Motors, who The company produces cars, trucks, vans, and buses.
Subsidiaries include British Jaguar Land Rover and South Korean Tata Daewoo.
Due to Jaguars recent advertisement that has caused out rage on the Social media platforms. Do we see high stake investors leaving?
Fib is showing to us it can go all the way back down to $314 per share. This would be a massive 60% sell off.
Now of course TATA motors don't just do Jaguars but other motors as well.

TATA Power Buyfundamentally Tata Power under value is 397 alrdy active 100-200 point trgt bcz its large cap


mazdock in buyDue to fundamental its near to growth stock
even though its a traditional business India gives important in ship sector
so this sector will be a GROWTH for next 5years
follow the chart
