Tata

Tata Power - December target Rs. 80++Here is a snapshot of what Tata Power is doing in December 2020.
My target for this is Rs. 80++ (hopefully before Nifty correction starts)


#Tata Motors - Turn Around? @TataMotors #tradingviewTata Motors is likely to have left the downward trend that has persisted for the past 5 years and thus achieved an overriding trend change.
Even if the market environment is difficult, the stock market is buying the future. India is a huge market.
Please also use the attached view from 2018 to get an even better overview.
Patience is a virtue.
Greetings from Hannover
Stefan Bode

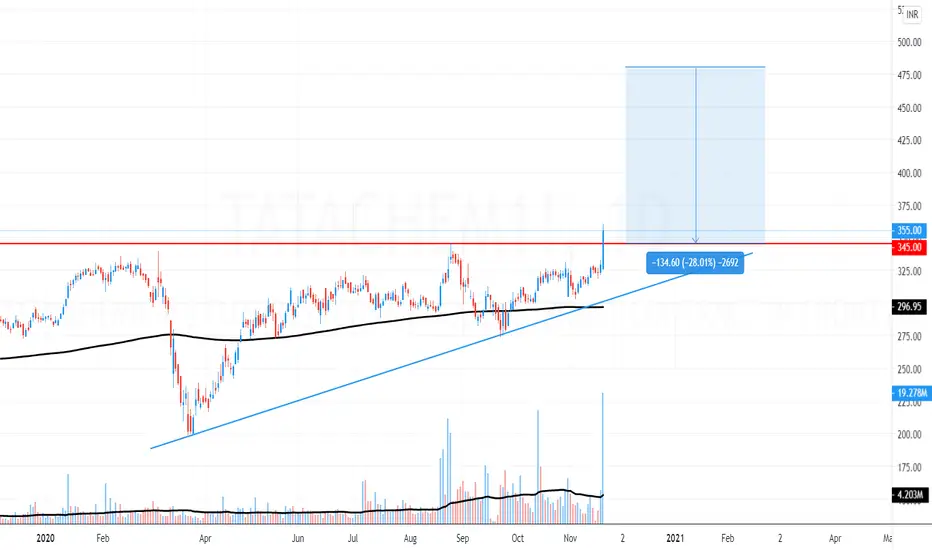
HERE COMES TATA CHEMICAL WITH A BREAKOUT WITH VOLUME BUY BUY BUYHERE COMES TATA CHEMICAL WITH A BREAKOUT WITH VOLUME BUY BUY BUY
HERE COMES TATA CHEMICAL WITH A BREAKOUT WITH VOLUME BUY BUY BUYVV
HERE COMES TATA CHEMICAL WITH A BREAKOUT WITH VOLUME BUY BUY BUYV
HERE COMES TATA CHEMICAL WITH A BREAKOUT WITH VOLUME BUY BUY BUYHERE COMES TATA CHEMICAL WITH A BREAKOUT WITH VOLUME BUY BUY BUY
HERE COMES TATA CHEMICAL WITH A BREAKOUT WITH VOLUME BUY BUY BUY
HERE COMES TATA CHEMICAL WITH A BREAKOUT WITH VOLUME BUY BUY BUYHERE COMES TATA CHEMICAL WITH A BREAKOUT WITH VOLUME BUY BUY BUYHERE COMES TATA CHEMICAL WITH A BREAKOUT WITH VOLUME BUY BUY BUY
HERE COMES TATA CHEMICAL WITH A BREAKOUT WITH VOLUME BUY BUY BUYHERE COMES TATA CHEMICAL WITH A BREAKOUT WITH VOLUME BUY BUY BUYHERE COMES TATA CHEMICAL WITH A BREAKOUT WITH VOLUME BUY BUY BUYHERE COMES TATA CHEMICAL WITH A BREAKOUT WITH VOLUME BUY BUY BUYHERE COMES TATA CHEMICAL WITH A BREAKOUT WITH VOLUME BUY BUY BUYHERE COMES TATA CHEMICAL WITH A BREAKOUT WITH VOLUME BUY BUY BUYHERE COMES TATA CHEMICAL WITH A BREAKOUT WITH VOLUME BUY BUY BUYHERE COMES TATA CHEMICAL WITH A BREAKOUT WITH VOLUME BUY BUY BUYHERE COMES TATA CHEMICAL WITH A BREAKOUT WITH VOLUME BUY BUY BUYHERE COMES TATA CHEMICAL WITH A BREAKOUT WITH VOLUME BUY BUY BUYHERE COMES TATA CHEMICAL WITH A BREAKOUT WITH VOLUME BUY BUY BUYHERE COMES TATA CHEMICAL WITH A BREAKOUT WITH VOLUME BUY BUY BUYHERE COMES TATA CHEMICAL WITH A BREAKOUT WITH VOLUME BUY BUY BUYHERE COMES TATA CHEMICAL WITH A BREAKOUT WITH VOLUME BUY BUY BUYHERE COMES TATA CHEMICAL WITH A BREAKOUT WITH VOLUME BUY BUY BUY
Tata Steel PreparationTatasteel is ready to go after more than 2 years long downtrend. Key level 428.85 according dow theory. In last week average volume are very high. The upcoming week tatasteel and cnxmetal index can break key level. Keep watching.


Bulls back#NSE #Tips : I may say 450 to 475 is the good level for buying for the targets of 495/510 levels in the short term.
Holding for Long term, the target towards 600+++
*Disclaimer : I just shared my view. Please analyze and proceed with your comfortable views.

daily analysis of TATA consultancy s Hi friends
the daily chart shows with a high probability an uptrend in the coming days
please subscribe to receive more analysis

Tata consumer looks bearish nowTata consumer is near to its monthly supprt level, from there if it falls then 455 also can come soon
Sell it below 466 for a tgt of 455 today

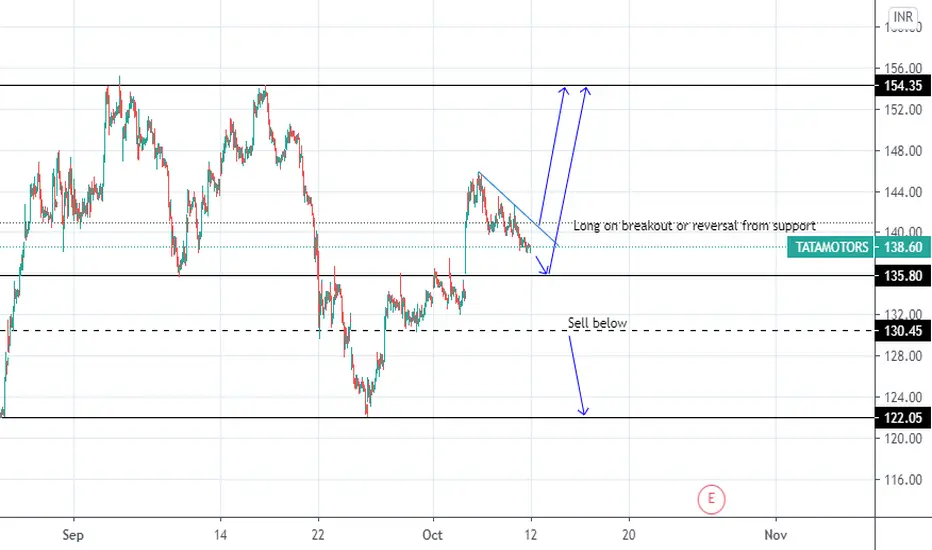
TATAMOTORS weekly set upTATAMOTORS might retest the support or correction before continuing uptrend till next resistance...If low support breaks, wait for price to fall below ---- line ,for confirmation to touch the downward support...

Only for education purposes and Bullish heroes- Check the weekly trendline before going bullish on this
- some might say that this could be a breakout but there's a head and shoulders patter in 3 hrs frame
- wait for a move and then enter or exit from this
- most of the patterns are showing a bearish trend only
- this is just my opinion

Tata elxis Hello!! Tata elxis is looking like a very good stock technically as it is in an uptrend after the crash of march and now it has nearly doubled till march levels it can see some above high moves. #learner #my_view

TATA MOTORSHELLO!! Tata Motors is again a very good stock and in an uptrend but maybe there will be a bit of retracement till 109 but after that, it will again boost up as it is forming pole and flag pattern. #my_view #learner

tata steelHello!! Tata steel is a good stock it is an uptrend and also gives a good move daily so a good stock for intraday lets see..... my view is it will test some upper resistances.....#my_view #learner

tata chemicalhello!! In tata chemicals 315 level can be seen and next moves depend on the breakout of the trendlines lets see what will happen next...... #my_view #learner


TATA MOTORS | Bull pennant formingHey guys, it's been a while since i posted. I have been working on a project lately and thus have been occupied. Will try to post regularly from now on.
There seems to be a bullish pennant forming on the chart.
Buy here for a good RR ratio.
Price most likely won't drop below the trend line as its been maintaining above it for a very long time now, indicating it as a strong support.
Target is 117. (17%)
Thank you!

Just to see where TCS goes with H1B issuesGuessing it to revisit 1900, 1800 region because of H1B issue and also technically weak.


TATA MOTORS | NEXT STEPS
TATA MOTORS Perfectly breached the 92 Resistance.
Next target would be 106 imo
Will update once 96 is breached or otherwise

TATA POWER | Long it or REGRET!
TATA POWER Formed a bullish butterfly pattern on the Weekly as you can see in the chart!
[*} Easy trade till the 0.382 retracement. Beyond that its your risk. Sell in the red box!
The MACD is also turning bullish with a crossover. Easy 25% Targets!
If you like my charts please leave a like below, so that i get encouraged to post more. Thank you :)
