Tata Steel on 15 min time frame Tata steel is facing a continuous resistance as can be seen on the image . So good for intraday if its breals the level with a good volume and its important for it to take support at 200 EMA.
(ADVICE)- Market is sideways nowadays so act accordingly , if market is also going up and showing signs of going up then it may be more accurate trade.
Tata

#BANKNIFTY JOIN FOR INTRADAY #We will make only profit.
#BANKNIFTY#NIFTY
#I will Tell you full trade in my Video.
#Don't buy any Trade without stop loss..

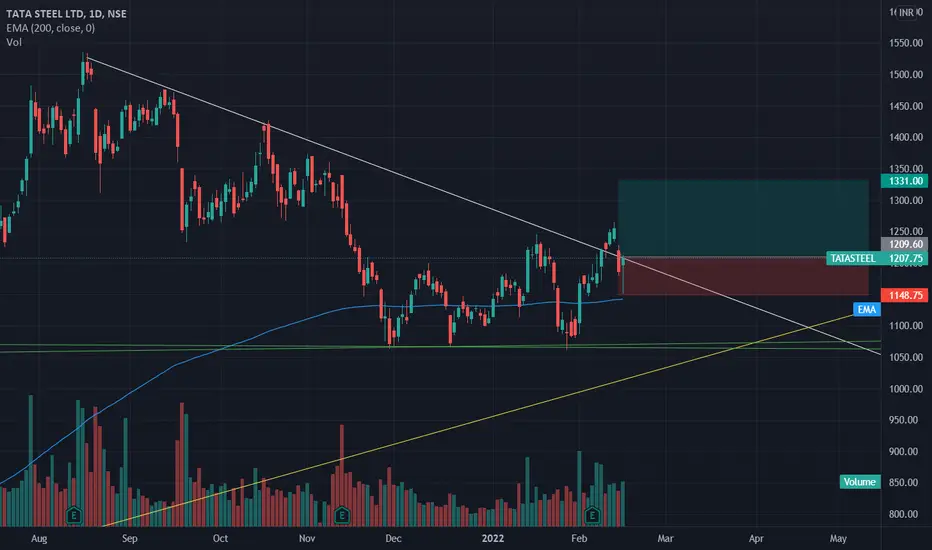
TATA Steel BreakoutThe stock has broken out and retested, therefore may undergo a reversal rally. Trade is supported by brokerage calls and Supports Nearby.
Risk Reward Ratio - 2:1
SL is placed below support zone & the lower trendline. The target is placed near resistance.
Tata motors / trading planTATA MOTORS low time frame is trading on down trend
Higher time frame have triangle pattern
If it breaks down have next support on 4 hr(&day) trend line...

Breakout may happened in TATA Steel StockIf cross the green line and stay 2-3 days then buy. Or buy if cross the gray line

TATAPOWER Up Trend..#TATAPOWER Hello trader, I hope are good and safe. Today I opened the chart of #TATAPOWER for 15 Min and analyzed it then I see that this chart has made a UP TREND, So I hope #TATAPOWER will go up,
Now Nice opportunity for short.
If you have any query then leave a COMMENT, LIKE and FOLLOW.
Keep Supporting And Thank You..

Tata Motors Is Looking Good For SwingWhat we believe in :-
°Trade With Logic
°Take Time Before Investment
Saving Your Capital 🙂
I'm not responsible for your profit or loss.
Mainly Stock & Crypto Investor 🕵️
| Interim Trader 📊
DISCLAIMER :- This Channel Is For ( EDUCATIONAL PURPOSE )

TATA METALICS1/ METALS sector coming uner leading Quadrant
2. targets as shown
3. Watch for volumes for next week
4. Momentum Building up
like if you agree

Tata Steel Is Looking Good For SwingWhat we believe in :-
°Trade With Logic
°Take Time Before Investment
Saving Your Capital 🙂
I'm not responsible for your profit or loss.
Mainly Stock & Crypto Investor 🕵️
| Interim Trader 📊
DISCLAIMER :- This Channel Is For ( EDUCATIONAL PURPOSES )

Tata Motors Is Looking Good For SwingWhat we believe in :-
°Trade With Logic
°Take Time Before Investment
Saving Your Capital 🙂
I'm not responsible for your profit or loss.
Mainly Stock & Crypto Investor 🕵️
| Interim Trader 📊
DISCLAIMER :- This Channel Is For ( EDUCATIONAL PURPOSES )

TATA ELXSI -inverted head and shoulder patternpositional traders can add TATA ELXSI to their radar, as it is at the verge of SLANTED Head and Shoulder Pattern Break down.This is for Educational Purpose only and we are not SEBI Registered.

TATA Consultancy (TCS) May Fall, It can be Shorted 24/02/2021 Tata Consultancy Services Limited (TCS) is engaged in providing information technology (IT) services, digital and business solutions. The Company's segments include banking, finance and insurance services (BFSI); manufacturing; retail and consumer packaged goods (CPG); telecom, media and entertainment, and others, such as energy, resources and utilities, hi-tech, life science and healthcare, s-Governance, travel, transportation and hospitality, and other products. Its services portfolio consists of IT and assurance services, business intelligence and performance management, business process services, cloud services, connected marketing solutions, consulting, engineering and industrial services, enterprise solutions, IT infrastructure services, mobility products and services and platform solutions. Its software offerings include Digital Software and Solutions, TCS BaNCS and TCS MasterCraft, among others. It serves industries, including insurance, healthcare, retail, telecom and others.
Technical:
as we can see the price was in a bullish channel and it has now broken the lower boundary of the same channel
there exist bearish Divergence with MACD and MACD Histogram which is the sign of trend reversal and we can be sure after some candle confirmation that this Ticker is going to fall if the Channel break is confirmed by some candle pattern.
as of now we can have an eye on it for shorting it after some confirmation

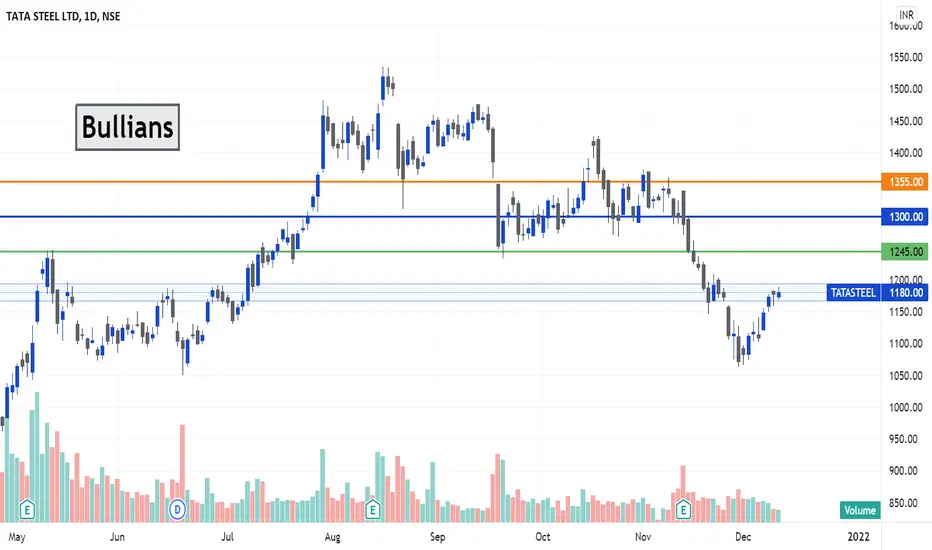
Tata Steel Looking Good Above The Box
What we believe in :-
°Trade With Logic
°Take Time Before Investment
Saving Your Capital 🙂
I'm not responsible for your profit or loss.
Mainly Stock & Crypto Investor 🕵️
| Interim Trader 📊
DISCLAIMER :- This Channel Is For ( EDUCATIONAL PURPOSES )
Tata Power : Positional LongTata Power is making HH/HL and is in uptrend. A close above 233 next week will ensure a run upto 250 with final target 268
Entry : 235
SL : 230 (5 points)
Target 1 : 250 (1:3)
Target 2 : 268 (1:6)

BULLISH ON TATA STEEL LTD.NSE:TATASTEEL
currently taking good support and shows bullish reversal . and also there is common pattern which this stock shows earlier also as after taking support on Simple Moving Average 44 , show bullish trend in a WEEKLY time frame.
IT CAN BE A GOOD TRADE.
Do your own analysis before investing.

Tata motorstata motors has left a gap in daily charts. it has broken the channel and its expecctd that it will fill the gap, support at 444. tgt 435

Tata ELXSIPerfectly moving in a channel since new year break out happend 20 sep21 and sustained above channel for a month then market went down so Tata elxsi, however again took support of upper trend line of channel from February on 8 nov and this week retested the same, as per DMI last buying level given in may2020. Still quite away from ema20, however have been following ema9, current analysis indicates may go sideways for couple of days before it starts rally upwards and make new high. Anytime if reaches around 5866 would be a great buy.else need to wait until forms green candle with ema9 support, can go long on that level.

Tata Motors BreakoutTata motors looks good for short term keep eye on it for next week
Big momentum can be seen in next week


Tata Power - Trendline breakout (Flag Pattern)After following a flag pattern, today the trendline has been broke out for the stock. And we can expect a decent bullish run in the coming days.
1st Target - previous ATH (268)
2nd Target - Depending on the momentum (yet to figure out)

TATA Communication ReversalThe stock has reached lower trendline and may undergo a reversal rally. Trade is supported by brokerage calls and Supports Nearby.
Risk Reward Ratio - 2:1
SL is placed below support zone & the lower trendline. The target is placed near swing high.

1 Day breakout trend line near price after earnings.According to the earnings the net profit has risen 4 % in (QoQ) and 9 % growth on (YoY)
My idea is to buy near 790.50 to 785.05
with a stop loss of 779.90
For 1st Target of 817
2nd Target of 860 (with a trailing stop loss)
I think that there will be a bounce back from the 1 Day breakout trend line as the earning are flat to positive
