Tata Chemical, #tata chem# tata chemical📉 Trend Reversal from ₹790–₹800 Support Zone
'W' pattern formed on daily chart — trend reversal signal.
Bottom range & neckline breakout confirm bullish momentum.
Price consolidating above W base, showing strength.
📈 Bias: Bullish above neckline; potential for further upside.
🗓️ Upcoming Event: Q1 results due soon — may act as a trigger for next move.
⚠️ Risk: Breakdown below ₹890 could negate the setup CMP = 962.65 total 70 points nearly 7% SL.
TATACHEM

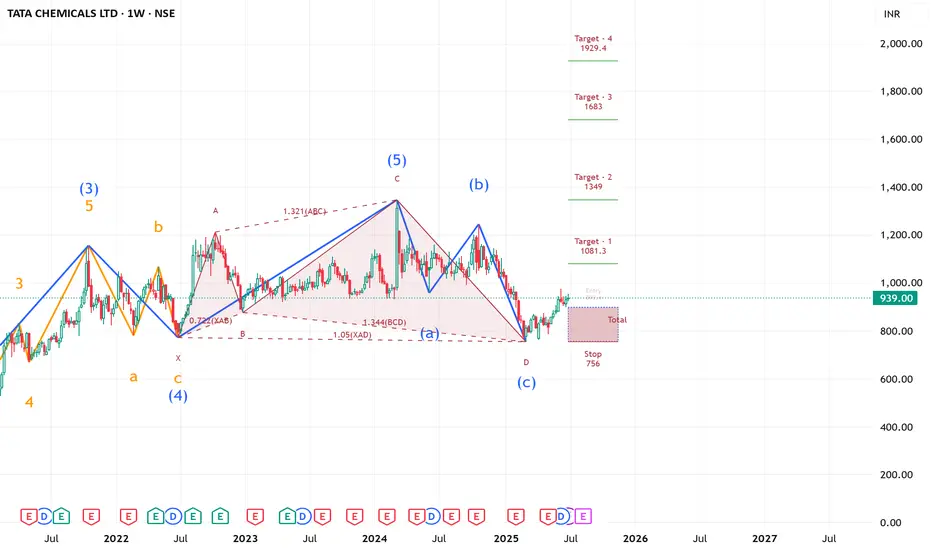
TATA CHEMICALS Ready to FIRE ( LONG TERM IDEA ) !!!TATA CHEMICALS' weekly counts indicate a bullish wave structure.
Both appear to be optimistic, and this stock's invalidation number is 756.
Investing in declines is a smart move for long-term players.
Long-term investors prepare for strong returns over the next two to five years.
TOP PLAYER IN THE INDUSTRY OF CHEMICALS
Every graphic used to comprehend the theory of elliot waves, harmonic waves, gann theory, and time theory
Every chart is for educational purposes.
We have no accountability for profit or loss.
Tata Chemicals Set for Bullish Swing, Targeting ₹1200-₹1220 Tata Chemicals is showing strong bullish momentum on the weekly chart, making it an attractive pick for swing traders. With a target range of ₹1200 to ₹1220 in the next 1 to 2 weeks, this stock is positioned for potential short-term gains.
Key Technical Highlights:
The stock has recently closed at ₹1128.65, marking a high over the past one to two months, indicating sustained strength.
Multiple RSI indicators are showing bullish momentum, reinforcing confidence in the uptrend.
The chart pattern suggests a clear bullish bias, making Tata Chemicals an appealing candidate for swing trading.
Trade Setup:
Target: ₹1200 to ₹1220
Stop Loss: ₹1092.60
Time Frame: 1 to 2 weeks for swing traders
Reason for the Buy Call:
Bullishness on the Weekly Chart: The stock has consistently shown strength, breaking through key resistance levels.
RSI Momentum: Multiple RSI indicators suggest ongoing upward pressure, confirming that buyers are in control.
Conclusion:
Tata Chemicals offers a solid swing trade opportunity, with technical indicators pointing towards further gains. With a target of ₹1200 to ₹1220 and a stop loss of ₹1092.60, this trade setup presents an attractive risk-to-reward ratio for swing traders.
Disclaimer: This is for educational purposes only and not financial advice. Please do your own research before making any investment decisions.

#FINPIPE 231#invest target330 #nifty #banknifty #trading #btcusdFINPIPE 231
Target 330+
RR > 4
Return >40%
Risk <9%
Timeframe < 8M
NSE:FINPIPE
Buy Recommended
Can hold for long term
Shared with 💚
By Rachit Sethia

#VIDHIING 473 tgt 627 #equity #KIRIINDUS #BODALCHEM #SUDARSCHEMVIDHIING 473
TGT 627
SL 420
Return > 35%
Risk < 12%
RR ~ 3
Timeframe <6M
NSE:VIDHIING
Buy Recommended
Can hold for long term
Shared with 💚
By Rachit Sethia

#RALLIS 288 TGT 525 #Investment #TataChem #TATASons #TATAMOTORSRALLIS 288
TGT 525
SL 224
RR ~4
Timeframe <8M
Return > 80%
Risk < 25%
NSE:RALLIS
Buy Recommended
Can hold for long term
Shared with 💚
By Rachit Sethia

TATACHEM--This stock is facing the resistance from top levels at 1150 levels...
price is trading in a channel...
now it is ready to breaks the channel, after strong break price gives us some retracement to enter short side again for targets of below demand zone...
soo keep look for short side up to the below demand zone and support levels.

TATACHEM Daily timeframe analysis for long term
NSE:TATACHEM has given strong breakout of consolidation range over year near 1040 price.
We can buy near 1043 and can see long term move above 1040 with SL of 1000 if it give pullback add more till 1033 .
Major targets levels are highlighted in blue lines.

#Tata chem, moving in tight range, R:R in favor, long at 950/968Tata chem is moving in a tight range Since Apr'23 and making higher low's but not higher high. In my opinion going long at 970 with small SL below 940. We can add till 950 also or enter at 947/950 to reduce risk in the trade, on upside targets can be 1) 1021 2) 1039 3) once 1039 is crossed bring SL to cost or 1021 to ensure no loss in the trade. I think spring effect is going to help bull's, there can be a scenario where flushing out of weak hands can happen below 965.

Tatachem - Elliott Wave CountTatachem - Elliott Wave Count
The market appears to be in a bearish trend, and we can expect wave C to complete between 780 and 680. After that, we can expect an upward rebound.
Please exercise caution when trading as this information is for educational purposes only.
NSE:TATACHEM NSE:TATACHEM1! BSE:TATACHEM


TATA CHEMICALSTATA CHEMICALS - There is a bearish cycle forming on the stock. As long as the price stays below the invalidation of 1084, bearish pressure could remain and could move towards the 800 level with a strong resistance.
This idea is based on the Elliott Wave Theory. Any trade/Investment should be managed with proper risk management.

TATACHEM weekly chartTatachem is in the consolidation phase and a good move can come above 1080 closing and then above 1200++.
My long term targets are 1500, till then it is a buy on dip candidate.

My view on TatachemTatachem giving trendline breakout.
Forming inverse H&S
Looking good above 1016-17
Tgt 1030++
We are keeping on radar tatachem 1020 CE

My view on TatachemTatachem Forming Head & Shoulder
Below 987
Tgt 976-970-960++
Keeping on radar Tatachem 990 PE

TATACHEM - Bullish Consolidation BreakoutNSE: TATACHEM is closing with a bullish consolidation breakout candle supported with volumes.
Today's volumes and candlestick formation indicates strong demand and stock should move to previous swing highs in the coming days.
The stock has been moving along the horizontal support for the past few days which is indicating demand.
One can look for a 8% to 13% gain on deployed capital in this swing trade.
The view is to be discarded in the event of the stock breaking previous swing low.
#NSEindia #Trading #StockMarketindia #Tradingview #SwingTrade

TATA Chemicals NSE:TATACHEM
The firm’s consolidated net profit hiked by 53% to Rs 711 crore in the March quarter, while revenue from operations leaped by 27% to Rs 4,407 crore. It's alright hyped on monthly timeframe. On weekly it can touch the previous high. But for now it appears to be range bound.
Trading setup of 10% gains incoming.
*Not a financial advice.
My charts speaks louder than words.
I'm a chartist and I paint charts.

TATACHEM near TRENDLINE BREAKOUTWe saw 30% Correction from the All Time High price & The price facing Downward trendline resistance and now very near to breakout level of trendline. If price breaks the level 990 and closes than price will head towards the target of 1015/1040+ & If price closes above the 1055 than we can see targets of 1100/1200+. The Support zone between the 940--920. Price Breakdown below the 920 and closes than target will be 900/870+
Traders, if you liked this idea or if you have your own opinion about it, write in the comments. I will be glad.

TATA Chemicals Ltd - Multiple Indicators 📊 Script: TATACHEM (TATA CHEMICALS LIMITED)
📊 Nifty50 Stock: NO
📊 Sectoral Index: NIFTY 500 / NIFTY MIDCAP
📊 Sector: Commodities Chemicals
📊 Industry: Chemicals & Petrochemicals
Key highlights: 💡⚡
📈 Script is trading at upper band of Bollinger Bands (BB).
📈 MACD is giving crossover.
📈 Double Moving Averages may give crossover in next trading session.
📈 Volume is increasing along with price which is volume breakout.
📈 Current RSI is around 65.
📈 One can go for Swing Trade.
⏱️ C.M.P 📑💰- 1200
🟢 Target 🎯🏆 - 1317
⚠️ Stoploss ☠️🚫 - 1136
⚠️ Important: Always maintain your Risk & Reward Ratio.
⚠️ Purely technical based pick.
✅Like and follow to never miss a new idea!✅
Disclaimer: I am not SEBI Registered Advisor. My posts are purely for training and educational purposes.
Eat🍜 Sleep😴 TradingView📈 Repeat🔁
Happy learning with trading. Cheers!🥂


#greenply #rushil #greenpanel #archidply #centuryply #wipl #Riil#GREENPLY
NSE:GREENPLY
NSE:GREENPLY
GREENPLY
CMP 202
Target 235
SL 174
TF < 6 months
Return 24%
Entry 189
Factors:
BULLISH WEDGE BREAKOUT
Trend Following
Rising Volume with rising Prices.
Flag pattern breakout.
Pennant Pattern Breakout with Bullish Candle.
Retest Successful.
Higher Highs & Higher Lows.
Broken above RESISTANCE levels
Trading at SUPPORT levels
Earnings are strong.
Bullish Wedge Breakout
Risk Return Ratio is healthy.
And
Rising from Double Bottom Pattern to Flag Pattern forming.
If you like my work KINDLY LIKE SHARE & FOLLOW this page for free Stock Recommendations.
With 💚 from Rachit Sethia

#TATAMETALI #TATASTEEL #TATAELXSI #TCS #TATACOMM #TATAMOTORS #IT#TATAMETALI
CMP 875
Target 1040
Sl 755
Time frame < 3 months
NSE:TATAMETALI
INVEST & HOLD NSE:TATAMETALI
Factors:
BULLISH WEDGE BREAKOUT
Trend Following
Rising Volume with rising Prices.
Flag pattern breakout.
Pennant Pattern Breakout with Bullish Candle.
Retest Successful.
Higher Highs & Higher Lows.
Broken above RESISTANCE levels
Trading at SUPPORT levels
Earnings are strong.
Bullish Wedge Breakout
Risk Return Ratio is healthy.
And
Rising from Double Bottom Pattern to Flag Pattern forming.
If you like my work KINDLY LIKE SHARE & FOLLOW this page for free Stock Recommendations.
With 💚 from Rachit Sethia

TATACHEM : Rectangle pattern TATACHEM trading in Rectangle pattern in 15 min time frame.
If any bullish candle stick pattern formed near support line, we can see reversal of stock
If support break then its good to wait for retest and sell if find any bearish candle.
Like, Share, Comment for regular updates.
Disclaimer
I am not sebi registered analyst
My studies are Educational purpose only
Please consult with your Financial advisor before trading or investing
