Tata Chemical, #tata chem# tata chemical📉 Trend Reversal from ₹790–₹800 Support Zone
'W' pattern formed on daily chart — trend reversal signal.
Bottom range & neckline breakout confirm bullish momentum.
Price consolidating above W base, showing strength.
📈 Bias: Bullish above neckline; potential for further upside.
🗓️ Upcoming Event: Q1 results due soon — may act as a trigger for next move.
⚠️ Risk: Breakdown below ₹890 could negate the setup CMP = 962.65 total 70 points nearly 7% SL.
Tatachemical

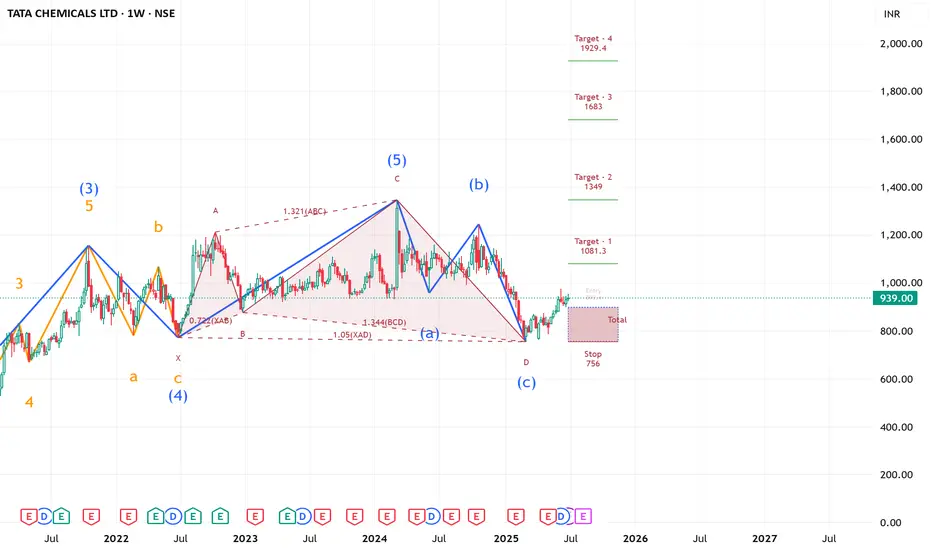
TATA CHEMICALS Ready to FIRE ( LONG TERM IDEA ) !!!TATA CHEMICALS' weekly counts indicate a bullish wave structure.
Both appear to be optimistic, and this stock's invalidation number is 756.
Investing in declines is a smart move for long-term players.
Long-term investors prepare for strong returns over the next two to five years.
TOP PLAYER IN THE INDUSTRY OF CHEMICALS
Every graphic used to comprehend the theory of elliot waves, harmonic waves, gann theory, and time theory
Every chart is for educational purposes.
We have no accountability for profit or loss.
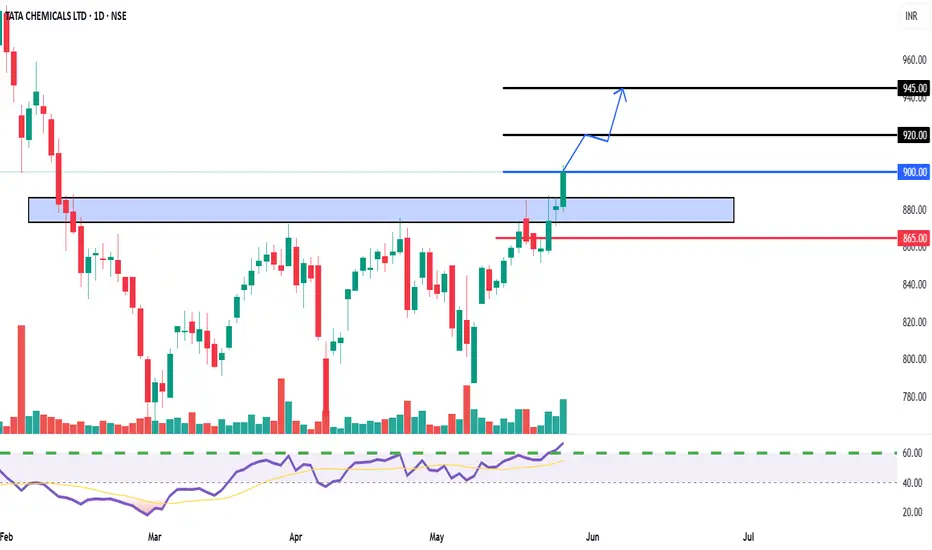
TATA CHEMICALS Breakout Confirmed - Buy on MomentumEntry Price:
Aggressive Entry: Around CMP (₹900-₹905)
Conservative Entry: On a retest of the breakout zone (₹875-₹885), if the opportunity arises.
Target Price 1 (T1): ₹920
Target Price 2 (T2): ₹945
Stop Loss (SL): ₹865 (Closing basis below the breakout zone and previous support)
TATA Tech Breakout: Inverted Head & Shoulder Targets ₹856+A bullish reversal pattern forming in Tata Technologies Ltd (TATATECH) on the daily timeframe.
Pattern Identified:
📌 Inverse Head and Shoulders Pattern
Left Shoulder: Price dips and recovers
Head: A deeper dip followed by recovery
Right Shoulder: A higher low and bounce
Neckline: Resistance around ₹755 is tested multiple times
Key Technical Insights:
Breakout Above Neckline: Today's close above ₹755 confirms breakout
Target Projection:
Target = Neckline + Height (from Head to Neckline)
Projected Target = ₹856+
Volume Confirmation (optional): Typically, volume should rise during breakout for stronger confirmation
Sentiment:
Reversal from downtrend to possible uptrend
Bullish momentum expected to continue toward the ₹856+ zone

TATACHEMNSE:TATACHEM
One Can Enter Now !
Or Wait for Retest of the Trendline (BO) !
Or wait For better R:R ratio !
Note :
1.One Can Go long with a Strict SL below the Trendline or Swing Low.
2. R:R ratio should be 1 :2 minimum
3. Plan as per your RISK appetite and Money Management.
Disclaimer : You are responsible for your Profits and loss, Shared for Educational purpose

TATA CHEMICAL DIVERGENCE 1 YEAR LOOKOUT CMP :1088
needs monthly closing above 1151 for first confirmation and 1251 final confirmation.
stuck in same range for long time with rsi divergence.
note : its just for educational purpose and not a trading call/tip.

Tata Chemicals Set for Bullish Swing, Targeting ₹1200-₹1220 Tata Chemicals is showing strong bullish momentum on the weekly chart, making it an attractive pick for swing traders. With a target range of ₹1200 to ₹1220 in the next 1 to 2 weeks, this stock is positioned for potential short-term gains.
Key Technical Highlights:
The stock has recently closed at ₹1128.65, marking a high over the past one to two months, indicating sustained strength.
Multiple RSI indicators are showing bullish momentum, reinforcing confidence in the uptrend.
The chart pattern suggests a clear bullish bias, making Tata Chemicals an appealing candidate for swing trading.
Trade Setup:
Target: ₹1200 to ₹1220
Stop Loss: ₹1092.60
Time Frame: 1 to 2 weeks for swing traders
Reason for the Buy Call:
Bullishness on the Weekly Chart: The stock has consistently shown strength, breaking through key resistance levels.
RSI Momentum: Multiple RSI indicators suggest ongoing upward pressure, confirming that buyers are in control.
Conclusion:
Tata Chemicals offers a solid swing trade opportunity, with technical indicators pointing towards further gains. With a target of ₹1200 to ₹1220 and a stop loss of ₹1092.60, this trade setup presents an attractive risk-to-reward ratio for swing traders.
Disclaimer: This is for educational purposes only and not financial advice. Please do your own research before making any investment decisions.

INVESTMENT IDEA - TATA CHEMICALSTata Chemicals, a renowned leader in the chemicals industry is compelling an investment prospect, propelled by a confluence of bullish technical indicators and promising market dynamics.
Reasons are listed below :
Technicals:
Tata Chemicals has recently broken out from an ascending triangle pattern, signaling a potential uptrend and presenting an attractive entry point for investors.
After multiple tests in the 1100-1200 zone, the stock has decisively broken through, indicating strong bullish momentum and potential for sustained upward movement.
A significant bullish marubozu candle on the weekly timeframe underscores robust buying pressure and hints at a continuation of the bullish trend.
Breaking free from a consolidation phase spanning over two years, Tata Chemicals demonstrates the potential for a new bullish trend trajectory, presenting an opportune moment for investors.
Accompanied by a surge in trading volumes, the recent price action reflects heightened investor interest and confidence in Tata Chemicals' prospects.
Trading above both the 50 and 200 exponential moving averages (EMA) in the weekly timeframe, Tata Chemicals enjoys strong technical support, further reinforcing the bullish outlook.
Fundamentals :
Tata Chemicals boasts a healthy Price-to-Earnings (PE) ratio, indicating favorable valuation relative to its earnings and potential for investor returns.
The company demonstrates impressive growth in both profit and sales on a year-over-year basis, reflecting strong operational performance and market demand for its products.
Tata Chemicals has been actively reducing its debt burden, showcasing prudent financial management and strengthening its balance sheet resilience.
With a substantial dividend payout ratio of 48%, Tata Chemicals rewards its shareholders with attractive dividends, highlighting its commitment to delivering value and sharing profits with investors.
Target - 1540 // 1777
Stoploss - weekly close below 970
DISCLAIMER -
Decisions to buy, sell, hold or trade in securities, commodities and other investments involve risk and are best made based on the advice of qualified financial professionals. Any trading in securities or other investments involves a risk of substantial losses. The practice of "Day Trading" involves particularly high risks and can cause you to lose substantial sums of money. Before undertaking any trading program, you should consult a qualified financial professional. Please consider carefully whether such trading is suitable for you in light of your financial condition and ability to bear financial risks. Under no circumstances shall we be liable for any loss or damage you or anyone else incurs as a result of any trading or investment activity that you or anyone else engages in based on any information or material you receive through TradingView or our services.
@visionary.growth.insights

TATACHEM--This stock is facing the resistance from top levels at 1150 levels...
price is trading in a channel...
now it is ready to breaks the channel, after strong break price gives us some retracement to enter short side again for targets of below demand zone...
soo keep look for short side up to the below demand zone and support levels.

NSE-TATACONSUM - Short term trend tracking up? NSE:TATACONSUM
Tata Consumer Products Ltd, a prominent member of the Tata Group, is a key player in the food and beverage industry, both nationally and abroad. This tea company is the second largest in the world and dominates many markets. It has expanded beyond South Asia, with a particular focus on India. foothold in several other regions such as Canada, the United Kingdom, North America, Australia, Europe, the Middle East, and Africa.
Acquisition of Food Business
In FY2020, the company got the consumer products business from Tata Chemicals Ltd. This includes selling salt with the name 'Tata Salt', and food products like spices and pulses with the name 'Tata Sampann'. It was an all-equity deal. counts for about 71% of branded business revenues of the company. About 22% of the revenue comes from business operations outside of the local area, including Canada, the United States, the United Kingdom and Europe, the Middle East, and Australia.
Branded Vs Non-Branded
90% of total revenues come from branded food & beverages business & the rest 10% comes from the non-branded business of company.
Revenue segmentation
India Beverages(37% of revenue) - Brands such as Tata Tea, Tata Gluco+, Himalayan, Tata Coffee Grand
India Foods(27% of revenue) - Brands such as Tata Salt, Tata sampann, Tata Soulfull, Tata sampann yumside
US Coffee(11% of revenue) - Brands such as Eight O'clock
International Tea(15% of revenue) - Brands such as Tetley, teapigs, Good Earth
Tata Coffee(10% of revenue)
As of 9MFY23, Growth businesses include Tata Sampann, NourishCo, Tata Soulfull, and the RTE/RTC business (Tata Smartfooz) grew 53%YOY
Tata Starbucks
It is a joint venture between Tata Consumer Products and Starbucks Corporation of America wherein the company is working towards expanding the presence of Starbucks retail coffee stores in the subcontinent of India.
Presently, it operates 311 Starbucks stores in the nation.
source : screener
disc: Invested first trance

TATACHEM Daily timeframe analysis for long term
NSE:TATACHEM has given strong breakout of consolidation range over year near 1040 price.
We can buy near 1043 and can see long term move above 1040 with SL of 1000 if it give pullback add more till 1033 .
Major targets levels are highlighted in blue lines.

#Tata chem, moving in tight range, R:R in favor, long at 950/968Tata chem is moving in a tight range Since Apr'23 and making higher low's but not higher high. In my opinion going long at 970 with small SL below 940. We can add till 950 also or enter at 947/950 to reduce risk in the trade, on upside targets can be 1) 1021 2) 1039 3) once 1039 is crossed bring SL to cost or 1021 to ensure no loss in the trade. I think spring effect is going to help bull's, there can be a scenario where flushing out of weak hands can happen below 965.

Tata Chemicals can be slow but is looking solid.Tata Chemicals Ltd. CMP – 1011.90 (Long Term Investment Idea)
Market Capitalization Rs 25,778.8Cr
Red Flags:🟥
FIIs are decreasing stake
MFs are decreasing stake
Green Flags:🟩
No debt
Zero promoter pledge
Improving annual net profit
Improving cash from operations annual
Dividend Yield @CMP = 1.78%
Previous Happy Candles Number – 87/100
New Happy Candles Number – 79/100
Fresh Entry/ averaging / compounding after closing above 1031
Targets: 1063 and 1084.
Long term target: 1108+.
Stop loss: Closing below 935.
The above information is provided for educational purpose, analysis and paper trading only. Please don't treat this as a buy or sell recommendation for the stock. We do not guarantee any success in highly volatile market or otherwise. Stock market investment is subject to market risks which include global and regional risks. We will not be responsible for any Profit or loss that may occur due to any financial decision taken based on any data provided in this message.

Tatachem - Elliott Wave CountTatachem - Elliott Wave Count
The market appears to be in a bearish trend, and we can expect wave C to complete between 780 and 680. After that, we can expect an upward rebound.
Please exercise caution when trading as this information is for educational purposes only.
NSE:TATACHEM NSE:TATACHEM1! BSE:TATACHEM

tata chemical 1w time frame decending symentric triangletata chemical 1w time frame
decending symentric triangle pattern
buy @ 1031 target @ 1059, 1089, 1117.50
risk reward 1 : 3.4
its just a view trade @ your own risk
sl@1004.5

follow up, trendline breakout doneTATACHEM has done breakout and now once given good close on weekly basis can go for 1200+++

TATA CHEMICALSTATA CHEMICALS - There is a bearish cycle forming on the stock. As long as the price stays below the invalidation of 1084, bearish pressure could remain and could move towards the 800 level with a strong resistance.
This idea is based on the Elliott Wave Theory. Any trade/Investment should be managed with proper risk management.

My view on TatachemTatachem giving trendline breakout.
Forming inverse H&S
Looking good above 1016-17
Tgt 1030++
We are keeping on radar tatachem 1020 CE

TATACHEMNSE:TATACHEM
One Can Enter Now ! Or Wait for Retest of the Trendline (BO) Or wait For better R:R ratio
Note :
1.One Can Go long with a Strict SL below the Trendline or Swing Low of Daily Candle.
2. Close, should be good and Clean.
3. R:R ratio should be 1 :2 minimum
4. Plan as per your RISK appetite
Disclaimer : You are responsible for your Profits and loss, Shared for Educational purpose

TATACHEM - Bullish Consolidation BreakoutNSE: TATACHEM is closing with a bullish consolidation breakout candle supported with volumes.
Today's volumes and candlestick formation indicates strong demand and stock should move to previous swing highs in the coming days.
The stock has been moving along the horizontal support for the past few days which is indicating demand.
One can look for a 8% to 13% gain on deployed capital in this swing trade.
The view is to be discarded in the event of the stock breaking previous swing low.
#NSEindia #Trading #StockMarketindia #Tradingview #SwingTrade

Ascending triangle.Tata Chemicals weekly chart. An ascending triangle type pattern can be observed. Breakout about 1030 can lead price to reach previous highs around 1180. Worth keeping an eye on.
❤ & follow?

TATA Chemicals NSE:TATACHEM
The firm’s consolidated net profit hiked by 53% to Rs 711 crore in the March quarter, while revenue from operations leaped by 27% to Rs 4,407 crore. It's alright hyped on monthly timeframe. On weekly it can touch the previous high. But for now it appears to be range bound.
Trading setup of 10% gains incoming.
*Not a financial advice.
My charts speaks louder than words.
I'm a chartist and I paint charts.

Tata Chemical Dobule BottomDouble bottom in TATA chemical with pinbar at support
above 850 can do 900, 940 or more
-Saptarish_Trading
