Tatachemical


Tatachemical ready for breakout 1DA triangle inside a pole & flag. Some awesome setup, keep any eye.
Pure price action, no Jazz!

TATACHEM - Symmetrical Triangle BuildupLong-term bet stock for me.
I keep accumulating this stock on dips and decent quantity in my long-term portfolio.
Daily charts have a symmetrical triangle, BO of the same might give some good move.
CMP - 724
One can go long on BO with a small SL of 696 DCB.
All key levels are mentioned in the chart.

Tata Chemicals swing buying sideTata Chemicals
BUY = 749
STOP LOSS = 727.70
TARGET = 791.10
Don't just trade on my strategy first backtest ant then trade on your own risk and i am not responsible for any loss


TATA CHEMICALSTATA CHEMICALS, near trendline, after breakout going to fly.
Once breakout done, enter on buy side.

TATACHEM ::: HIGH RISK BULLISH TRADEH I G H R I S K T R A D E.
10 MAY 2021
INSTRUMENT: TATACHEM
TREND: BUY
TIME FRAME: DAY
CMP: 683.80
BUY ABOVE: 697
STOP LOSS: 681
TGT 01: 730
DISCLAIMER:
We are not S E B I registered analysts. Please consult your personal financial advisor before investing. We are not responsible for your profits/losses whatsoever.

TATA CHEM - RSI DIVERGENCETATA CHEMICAL showing RSI Divergence on daily chart. Can short below Todays low.


Tata Chemical Long build up Tata Chemical Long build up Buy at CMP 508
SL 490
TGT will go up to 600/700/700+


Tata Chemicals - First Target Rs. 485 Tata Chemical is showing good support on Gann Fans, followed by new Elliott wave supercycle, this stock will finally show some movements. Also, a recent breakout adds to the momentum.
My first target: Rs. 485

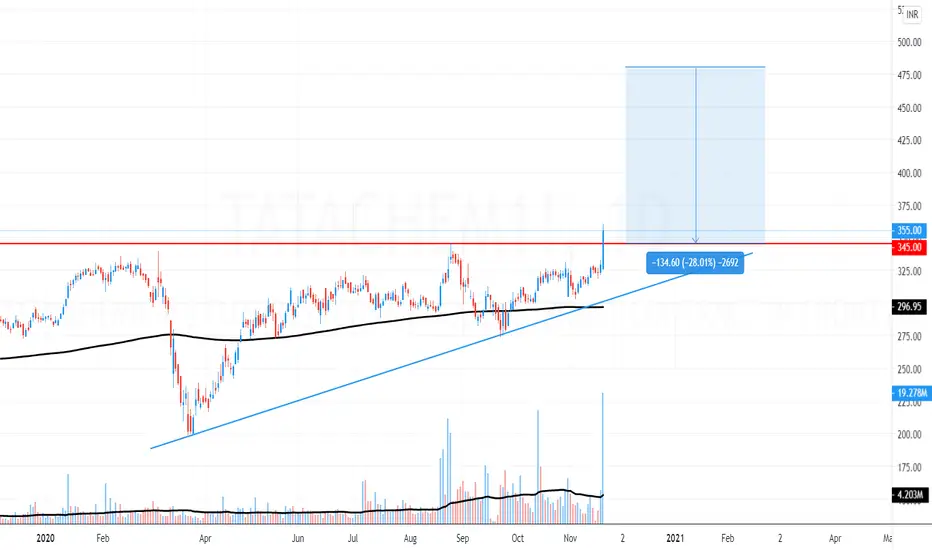
Tata Chemical : good follow on Friday post Momentum Bar Tata CHemical have shown good follow up bar post Momentum bar created on Thursday. with support at 353 & 330 one can see more upside.e

HERE COMES TATA CHEMICAL WITH A BREAKOUT WITH VOLUME BUY BUY BUYHERE COMES TATA CHEMICAL WITH A BREAKOUT WITH VOLUME BUY BUY BUY
HERE COMES TATA CHEMICAL WITH A BREAKOUT WITH VOLUME BUY BUY BUYVV
HERE COMES TATA CHEMICAL WITH A BREAKOUT WITH VOLUME BUY BUY BUYV
HERE COMES TATA CHEMICAL WITH A BREAKOUT WITH VOLUME BUY BUY BUYHERE COMES TATA CHEMICAL WITH A BREAKOUT WITH VOLUME BUY BUY BUY
HERE COMES TATA CHEMICAL WITH A BREAKOUT WITH VOLUME BUY BUY BUY
HERE COMES TATA CHEMICAL WITH A BREAKOUT WITH VOLUME BUY BUY BUYHERE COMES TATA CHEMICAL WITH A BREAKOUT WITH VOLUME BUY BUY BUYHERE COMES TATA CHEMICAL WITH A BREAKOUT WITH VOLUME BUY BUY BUY
HERE COMES TATA CHEMICAL WITH A BREAKOUT WITH VOLUME BUY BUY BUYHERE COMES TATA CHEMICAL WITH A BREAKOUT WITH VOLUME BUY BUY BUYHERE COMES TATA CHEMICAL WITH A BREAKOUT WITH VOLUME BUY BUY BUYHERE COMES TATA CHEMICAL WITH A BREAKOUT WITH VOLUME BUY BUY BUYHERE COMES TATA CHEMICAL WITH A BREAKOUT WITH VOLUME BUY BUY BUYHERE COMES TATA CHEMICAL WITH A BREAKOUT WITH VOLUME BUY BUY BUYHERE COMES TATA CHEMICAL WITH A BREAKOUT WITH VOLUME BUY BUY BUYHERE COMES TATA CHEMICAL WITH A BREAKOUT WITH VOLUME BUY BUY BUYHERE COMES TATA CHEMICAL WITH A BREAKOUT WITH VOLUME BUY BUY BUYHERE COMES TATA CHEMICAL WITH A BREAKOUT WITH VOLUME BUY BUY BUYHERE COMES TATA CHEMICAL WITH A BREAKOUT WITH VOLUME BUY BUY BUYHERE COMES TATA CHEMICAL WITH A BREAKOUT WITH VOLUME BUY BUY BUYHERE COMES TATA CHEMICAL WITH A BREAKOUT WITH VOLUME BUY BUY BUYHERE COMES TATA CHEMICAL WITH A BREAKOUT WITH VOLUME BUY BUY BUYHERE COMES TATA CHEMICAL WITH A BREAKOUT WITH VOLUME BUY BUY BUY
tatachem breakign out from 1hr time frame sm triangletatachem breakign out from 1hr time frame sm triangle

R-0226 Intraday Cash Buy TATACHEM @302.20-303.7 SL 297 TGT 315 Intraday Cash Buy TATACHEM @302.20-303.7 SL 297 TGT 315
Crosses pivot 296 + Next resistance 320/341 + Above VWAP 304.5 + Moving average and oscillators total 16 signals indicates a buy + Ichomoku cloud break out + TK cross over => GO LONG

tata chemicalhello!! In tata chemicals 315 level can be seen and next moves depend on the breakout of the trendlines lets see what will happen next...... #my_view #learner

Tatachemicals - Three Blacks Crows at Top#tatachemicals - has seen good uptrend which seems to be “stalling out” at the top and the Three Black Crows pattern has also emerged after sideways price action.


TATACHEMTATACHEM moving in channel - Bullish
For Intraday Can be short/long considering the channels
