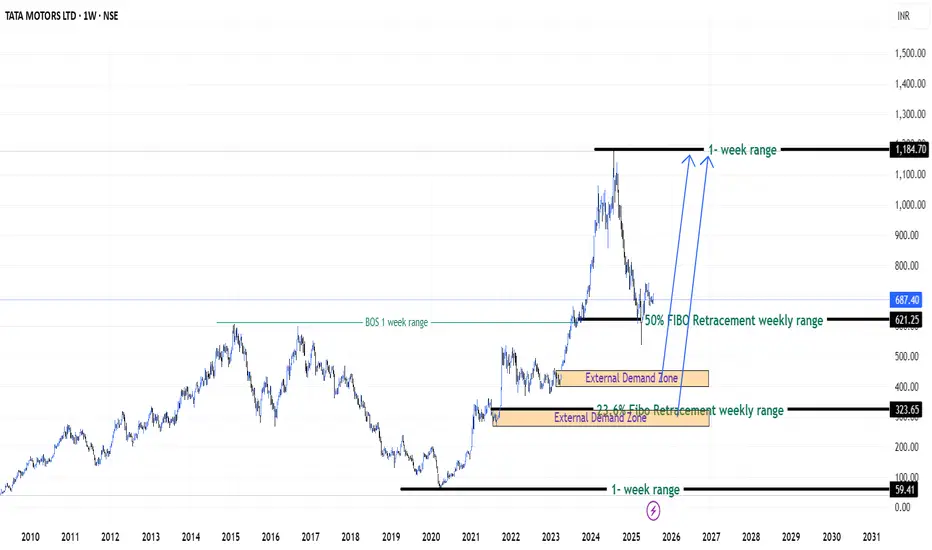
Patience on Tata Motors Stock (India) - {27/07/2025}Educational Analysis says that Tata Motors (Indian Stock) may give trend Trading opportunities from this range, according to my technical analysis.
Broker - NA
So, my analysis is based on a top-down approach from weekly to trend range to internal trend range.
So my analysis comprises of two structures: 1) Break of structure on weekly range and 2) Trading Range to fill the remaining fair value gap
Let's see what this Stock brings to the table for us in the future.
DISCLAIMER:-
This is not an entry signal. THIS IS FOR EDUCATIONAL PURPOSES ONLY.
I HAVE NO CONCERNS WITH YOUR PROFITS OR LOSS,
Happy Trading,
Stocks & Commodities TradeAnalysis.
My Analysis is:-
Short term trend may be go to the external demand zone.
Long term trend breaks the new high after going from discount zone.
Tatamotors
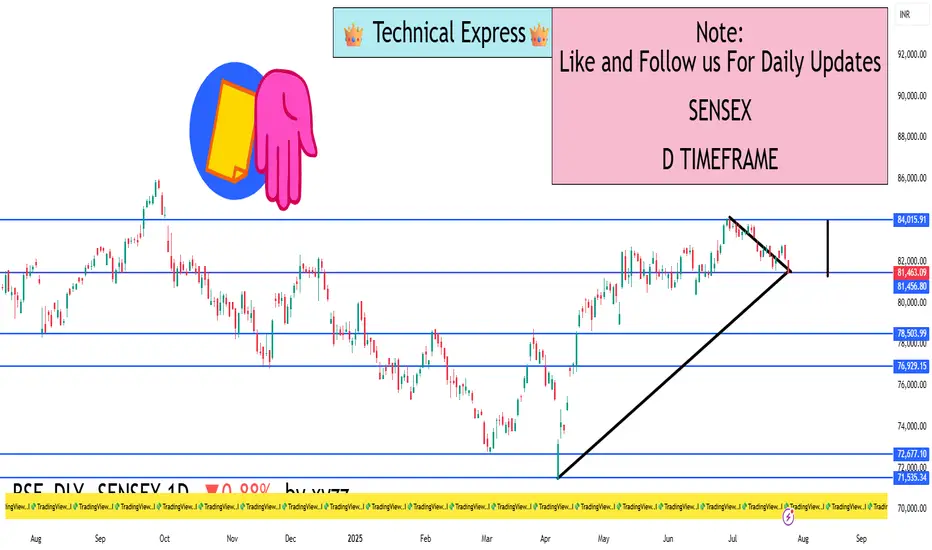
SENSEX 1D Timeframe📉 SENSEX Daily Overview (as of July 25, 2025)
Current Price: Around 81,460
Daily Change: Down by approximately 720 points (–0.9%)
Day’s High: About 82,070
Day’s Low: About 81,400
Previous Close: Around 82,184
📊 1-Day Candlestick Analysis
The candle for today is bearish, indicating strong selling pressure.
The price opened near previous levels but faced resistance at around 82,000.
Sellers dominated most of the day, pushing the index toward the 81,400 support zone.
🔍 Key Support and Resistance Levels
Level Type Price Range
Resistance 82,000 – 82,200
Support 81,400 – 81,000
If Sensex breaks below 81,400, the next target could be around 80,500 or 79,900.
If it holds above support and bounces, it could retest 82,200.
🧠 Technical Trend Analysis
Short-Term Trend: Bearish
Medium-Term Trend: Neutral to mildly bullish (as long as above 80,000)
Market Structure: Lower highs forming, suggesting pressure building on bulls
Indicators (assumed):
RSI may be approaching oversold
MACD likely showing bearish crossover
Volume increasing on red candles—indicating strong sell interest
📌 Sentiment & Market Context
Financial stocks (like banking, NBFCs) are under pressure.
Global cues (such as interest rate uncertainty and geopolitical concerns) are impacting investor confidence.
FII outflows and weak earnings in key sectors are adding to bearish momentum.
The broader trend remains range-bound, but with short-term downside bias.
✅ Strategy Suggestions (For Traders & Investors)
Swing Traders: Wait for a reversal candle (like a bullish engulfing or hammer) before considering long positions.
Breakout Traders: Watch for breakdown below 81,000 for continuation of the fall.
Positional Traders: Can wait to enter near 80,000–79,500 if the market holds that key level.
🔄 Summary
SENSEX is under pressure with a drop of 720+ points.
Technical structure suggests caution, especially if 81,000 breaks.
Support: 81,000 – 80,500
Resistance: 82,000 – 82,200
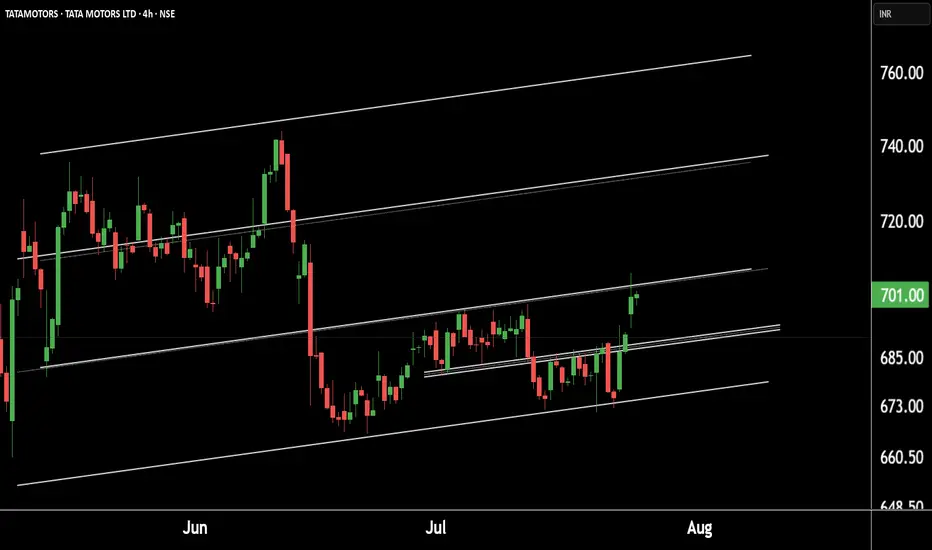
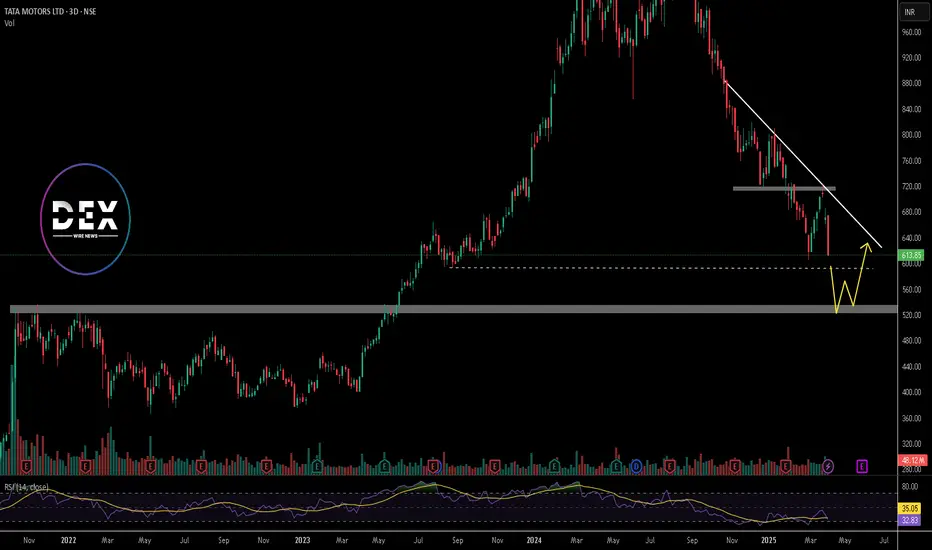
Tata Motors Gearing Up for a Fresh Rally! Technical Breakout !!This is the 4 hour chart of tata motor.
Tatamotor is moving in well defined parallel channel and bounced from it's supportt level near at 680, now ready for the breakout level at 705 .
If this level is sustain after the breakout then , we will see higher price in Tata motor.
Thank you !!
Tata Motors: From Profit Pressure to Growth Potential... Company Overview
* Name: Tata Motors Ltd.
* Industry: Automotive
* Key Segments: Passenger Vehicles (PV), Commercial Vehicles (CV), Electric Vehicles (EV), Jaguar Land Rover (JLR)
* FY25 Milestone: The Automotive business became debt-free
Q4 FY25 Performance Overview
* Net Profit: ₹8,556 crore (Down 51% YoY)
* Reason for Decline:
* High base due to deferred tax benefit in Q4 FY24
* Lower domestic volumes in PV and CV segments
* Reduced operating leverage amid falling demand
* Revenue: Marginal YoY increase (Consolidated revenue at record level for FY25)
* Positive Developments Despite Profit Decline :
* JLR Profitability Improvement
* Profit rose despite slightly lower revenue
* Supported by higher volumes and reduced depreciation
* Debt-Free Automotive Division:
* Major financial milestone for FY25 :
* Record Annual Revenue:
* Highest consolidated revenue in Tata Motors' history
* Future-Focused Investments:
* Capital allocation towards EVs, new product development, and manufacturing capacity
Strategic Growth Drivers – Reasons for Optimism
1. Electric Vehicle (EV) Leadership
* Tata Motors holds a dominant position in India’s EV market
* Plans to launch 10 EV models by 2026
* Battery Gigafactory is expected to begin production in 2026
* Strong alignment with India’s clean mobility goals
2. Expanding Product Portfolio
* Focused on SUV and ₹10–20 lakh price segments
* Upcoming launches:
* Curvv EV
* Harrier EV
* Sierra EV
* Strategy to cater to diverse customer preferences
3. Improving Financial Health
* Targeting 10% EBITDA across PV and EV divisions
* Demerger of CV and PV businesses to streamline operations and unlock value
4. Strong Base in Commercial Vehicles
* Market leader with 37.83% share in EV segment
* CV recovery is expected with infrastructure and rural demand growth
5. Supportive Macroeconomic and Policy Environment
* Government incentives: FAME II, PLI scheme
* EV-friendly policies encouraging domestic manufacturing
* Economic tailwinds: rising disposable income, urbanization, rural penetration
Risks and Challenges Ahead
* Intensifying Competition:
* Pressure from Maruti Suzuki, Hyundai, and new players
* Global Geopolitical and Trade Risks:
* US tariffs, material shortages (e.g., rare earths for EVs)
* Domestic Demand Slowdown:
* Inflation and high interest rates are affecting affordability
* Jaguar Land Rover’s Transition Challenges:
* EV transformation complexity
* Global demand volatility
* Production ramp-up hurdles
Conclusion
Tata Motors is at a pivotal juncture. While short-term profitability has taken a hit due to exceptional prior-year gains and cyclical volume pressures, the company’s fundamentals remain strong. Its leadership in EVs, ambitious expansion plans, and a now debt-free automotive business position it for long-term success.
However, realizing this potential depends on:
* Execution of its EV roadmap
* Sustained domestic demand
* Managing global uncertainties
* Staying competitive in an evolving auto landscape
Strategic Verdict:
Short-term caution, long-term confidence.
Tata Motors appears well-poised for a resilient comeback, driven by structural transformation and market-aligned growth strategies.
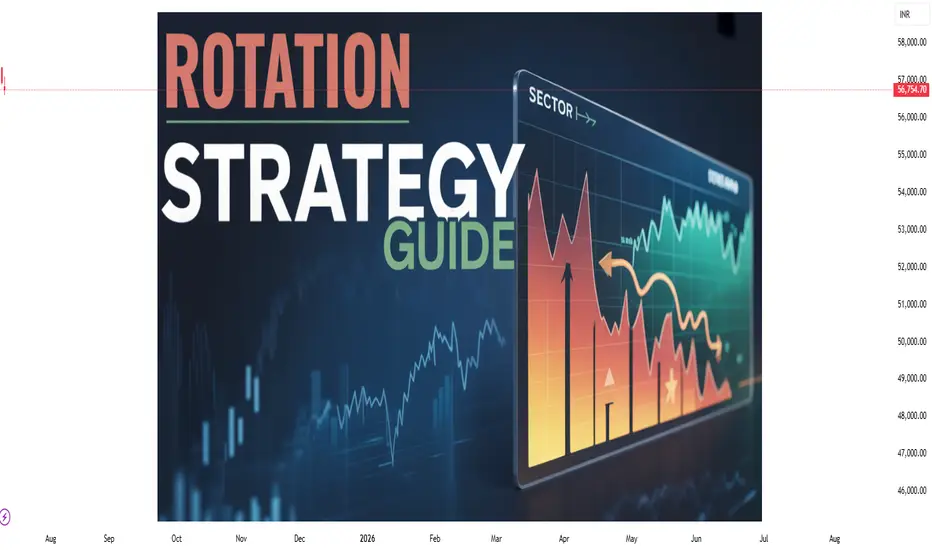
Sector Rotation Strategy🌐 Sector Rotation Strategy: A Smart Way to Stay Ahead in the Stock Market
What Is Sector Rotation?
Imagine you're playing cricket. Some players shine in certain conditions — like a fast bowler on a bouncy pitch or a spinner on a turning track. The same idea applies to stock market sectors.
Sector Rotation is the process of shifting your money from one sector to another based on the market cycle, economic trends, or changing investor sentiment.
In simple words:
"You’re moving your money where the action is."
First, What Are Sectors?
The stock market is divided into different sectors, like:
Banking/Financials – HDFC Bank, Kotak Bank, SBI
IT– Infosys, TCS, Wipro
FMCG – HUL, Nestle, Dabur
Auto – Maruti, Tata Motors
Pharma – Sun Pharma, Cipla
Capital Goods/Infra – L&T, Siemens
PSU – BEL, BHEL, HAL
Real Estate, Metals, Energy, Telecom, etc.
Each sector behaves differently at various stages of the economy.
Why Is Sector Rotation Important?
Because all sectors don’t perform well all the time.
For example:
In a bull market, sectors like Auto, Capital Goods, and Infra usually lead.
During slowdowns, investors run to safe havens like FMCG and Pharma.
When inflation or crude oil rises, energy stocks tend to do better.
When interest rates drop, banking and real estate might shine.
So, instead of holding poor-performing sectors, smart investors rotate into the hot ones.
How Does Sector Rotation Work?
Let’s say you are an investor or trader.
Step-by-step guide:
Track the economy and markets
Is GDP growing fast? = Economy expanding
Are interest rates high? = Tight liquidity
Is inflation cooling down? = Growth opportunity
Observe sectoral indices
Check Nifty IT, Nifty Bank, Nifty FMCG, Nifty Pharma, etc.
See which are outperforming or lagging.
Watch for news flow
Budget announcements, RBI policy, global cues, crude oil prices, etc.
E.g., Defence orders boost PSU stocks like BEL or HAL.
Move your capital accordingly
If Infra and Capital Goods are breaking out, reduce exposure in IT or FMCG and rotate into Infra-heavy stocks.
Real Example (India, 2024–2025)
Example: Rotation from IT to PSU & Infra
In late 2023, IT stocks underperformed due to global slowdown and US recession fears.
Meanwhile, PSU and Infra stocks rallied big time because:
Government increased capital expenditure.
Defence contracts awarded.
Railway budget saw record allocations.
So, many smart investors rotated out of IT and into:
PSU Stocks: RVNL, BEL, HAL, BHEL
Capital Goods/Infra: L&T, Siemens, ABB
Railway Stocks: IRFC, IRCTC, Titagarh Wagons
This sector rotation gave 30%–100% returns in a few months for many stocks.
Tools You Can Use
Sectoral Charts on TradingView / Chartink / NSE
Use indicators like RSI, MACD, EMA crossover.
Compare sectors using “Relative Strength” vs Nifty.
Economic Calendar
Track RBI policy, inflation data, IIP, GDP, etc.
News Portals
Moneycontrol, Bloomberg, ET Markets, CNBC.
FIIs/DII Activity
Where the big money is going – this matters!
Sector Rotation Heatmaps
Some platforms show weekly/monthly performance of sectors.
📈 Sector Rotation Strategy for Traders
For short-term traders (swing/intraday):
Rotate into sectors showing strength in volumes, price action, breakouts.
Use tools like Open Interest (OI) for sector-based option strategies.
Example:
On expiry weeks, if Bank Nifty is showing strength with rising OI and volume, rotate capital into banking-related trades (Axis, ICICI, SBI).
Sector Rotation for Long-Term Investors
For investors, sector rotation can be used:
To reduce drawdowns.
To book profits and re-enter at better levels.
To ride economic trends.
Example:
If you had exited IT in late 2022 after a rally, and entered PSU stocks in early 2023, your portfolio would’ve seen better growth.
Pros of Sector Rotation
Better returns compared to static investing
Helps avoid underperforming sectors
Takes advantage of macro trends
Works in both bull and bear markets
Cons or Risks
Requires monitoring and active management
Timing the rotation is difficult
Wrong rotation = underperformance
May incur tax if frequent buying/selling (for investors)
Pro Tips
Don't rotate too fast; let the trend confirm.
Use SIPs or staggered entry in new sectors.
Avoid “hot tips”; follow actual price and volume.
Blend sector rotation with strong stock selection (don’t just chase sector).
Conclusion
The Sector Rotation Strategy is one of the smartest, most practical tools used by both traders and investors. You don’t need to be a pro to use it — just stay alert to the market mood, economic cycles, and where the money is moving.
Think of it as dancing with the market:
“When the music changes, you change your steps.”
Keep rotating. Keep growing.
Institutional Trading Process 1. Investment Idea Generation
This is where it all begins.
Institutions generate trading ideas based on:
Fundamental research (company earnings, macroeconomic data)
Quantitative models (statistical or algorithmic strategies)
Technical analysis (price action, trends, volume)
Sentiment analysis (news flow, social media, market psychology)
Often, the research team, quant team, or portfolio managers work together to develop high-conviction trade ideas backed by data and analysis.
2. Pre-Trade Analysis and Risk Assessment
Before placing a trade, institutions perform:
Risk/reward analysis
Scenario testing (How does the trade perform in different market conditions?)
Volatility analysis
Position sizing based on portfolio risk budget

TATAMOTORSi Observed these Levels based on Price Action and Demand & Supply which is my own Concept "PENDAM CONCEPTS"... Please don't take any trades based on this chart/post... Because this chart is for educational purpose only not for Buy or Sell Recommendation... Thank Q

Buy the Dip: Tata Motors Set to Zoom from ₹713 to ₹799!Consider buying Tata Motors stock below ₹713 with a long-term target of ₹799, offering a potential profit of approximately 12%.

TataMotors Time To BoostTataMotors Recently Touched Day 1 Timeframe Demand Zone And In Previous He Also Touched Monthly / Quarterly Demand Zone So Trend Is UP Perfect Swing Trading Setup

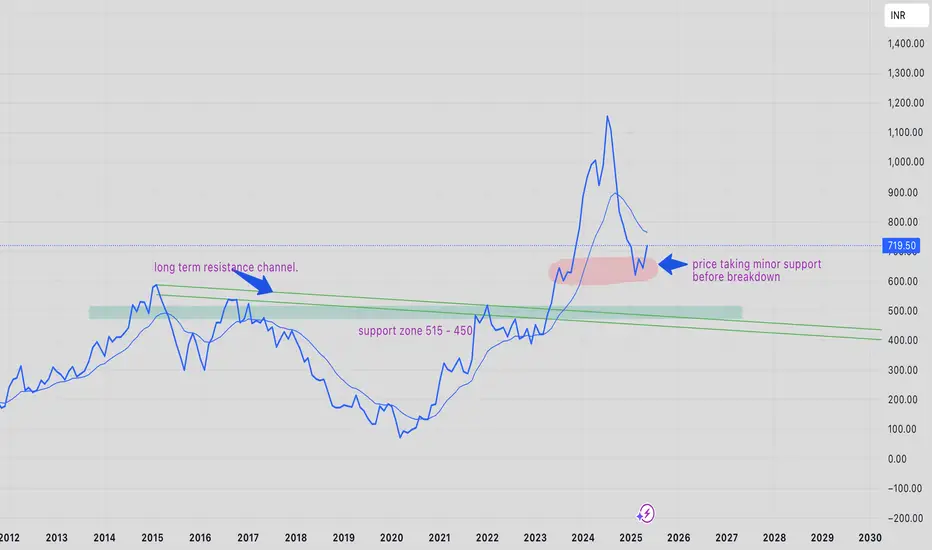
price analysis of TATAMOTORS-EQ for long term goalsTATAMOTORS-EQ price trend is in downtrend this is because price is trying to retest its previous all time high resistance zone ~550 - 425.
people of wish to add and have a long term goal it is better to add at those lvls because the current bounce might be used as selling opportunity by traders/speculators because of minor support.
as always people are advised to trade as per their risk capacity.
TATA MOTOR LONGtatamotors ling idea. learning purpose only.
tata motors long it can give good upmove from here as per my opinion

HUGE POTENTIAL IN THE NIFTY AUTO INDEX - STARTING OF THE 5 WAVEIndian Auto Index Technical Analysis
The Indian Auto Index made an all-time high (ATH) of approximately 27,700, completing Wave 3
From there, a Wave 4 corrective phase began, ending at 19,300 (a 30% decline).
A large Flag pattern has formed on the monthly charts and has been broken with a strong bullish candle, projecting a full target of 38,000 (an upside of 63%).
Using the Fibonacci extension from the COVID fall, the 3.618 level comes to approximately 32,600.
Taking the extension of Waves 3 and 4, the 1.618 level also points to 32,600, reinforcing this level as a major target.
List of Technical Targets
Target 1 – 23,960
Target 2 – 25,500
Target 3 – 27,700 (previous ATH)
Target 4 – 32,600 (Fibonacci confluence)
Target 5 – 34,000
Target 6 – 38,000 (flag pattern breakout target)
Important Dates Based on Time Cycle Analysis
17 November 2025
30 March 2026
4 January 2027
29 April 2029

TATA Motors India - Trading 680 to 1000Daily chart,
The stock NSE:TATAMOTORS rallied from 535 to 742 since 7 April 2025, and I think a cooling down (minor correction) should take place before resuming the bullish trend.
Expected to test the nearest support around 680
Technical indicator RSI is near the overbought zone. A signal that a correction (downwards or sideways) can be soon.
So, a new entry (Buy) should be in parts after testing the support 685 - 680 and rebounding.
Above 745 for 2 days, the target will be 880 then 1000
Consider the stop loss below 680

Equity Research - TATA MOTORS LTD 📈 Buy Zone: ₹670.50 – ₹680.30
🎯 Target: ₹740.00
🛑 Stop Loss: ₹641.70
💹 CMP: ₹680.30
Technical Highlights:
✅ Bullish volume spike
✅ RSI above 60 – strong momentum
✅ Price above 20EMA & 50EMA
✅ Breakout and retest on 15m & 1H chart
✅ Good risk-reward setup
📊 Strategy: Wait for confirmation candle on 15min TF above ₹681 for entry.
📉 Stop loss below recent swing low at ₹641.70.
For Education Purposes Only

Live buying signal in TataMotors at 664Live Khareedo (Buy) signal in Tata Motors at 664. Lets see how long it will go up.
Note: This is not a buy/sell trade call, trade at your own will and analysis. Use stop loss too.

TataMotors is in bullish zoneMy custom indicators named Jadugar and Paka Kam generated signals in last 1H candle that Becho @ 658.4 means sell at this price, lets see how much it will drop.
Note: This is not a buy/sell trade call, this is education purpose post, trade at your own will, Use stop loss.

Tata Motors Technical🇮🇳🛵#TATA Motors is trading at ₹649.85 on the NSE, at the time of tweet, reflecting a slight increase of 5% from the previous Weak close.
Over the past three years, the stock has delivered a strong return of 43.57%, outperforming the Nifty 100’s 37.57%.
In my views bottom has been made and right time add in the portfolio
Chart For your reference

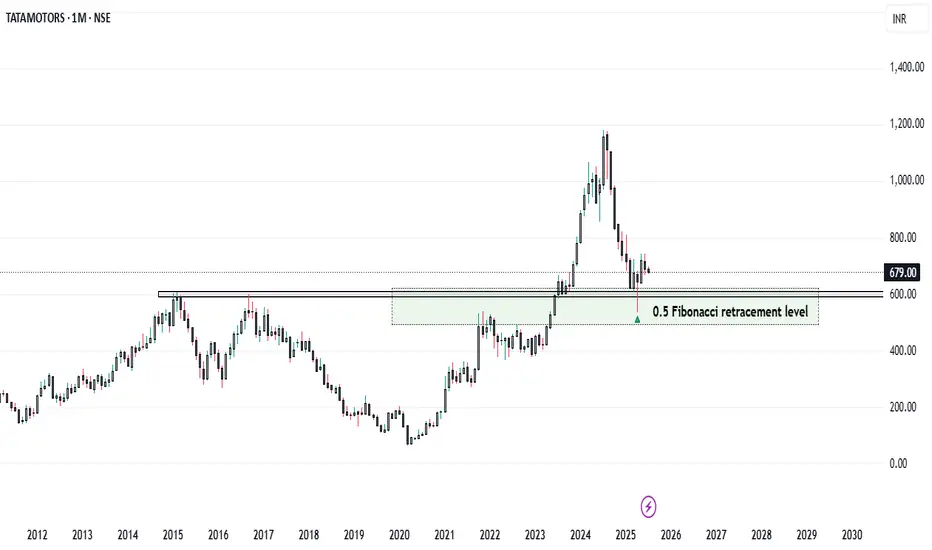
Tata Motors at ₹600: Support Zone in Focus...
Tata Motors at Key Technical Support: A Long-Term Buying Opportunity..?
Tata Motors is currently trading near the ₹600 level, which marks a significant technical support zone. This level is important not only because of historical price action but also because it aligns with the 0.5 Fibonacci retracement level of the broader uptrend seen in recent months.
The ₹600 mark has acted as a strong support on the monthly chart, suggesting a potential reversal point for long-term investors looking for value entry. From a purely technical perspective, this level could provide a solid foundation for a possible bounce or even a continuation of the longer-term bullish trend.
However, it is important to note that while technical indicators may suggest an attractive entry point, Tata Motors remains subject to various fundamental factors that could drive volatility in the short to medium term. These include:
- JLR (Jaguar Land Rover) Sales Data
- Quarterly Earnings Results
- Global Tariff and Trade Policy News
These elements can significantly impact investor sentiment and stock performance, sometimes overriding technical signals.
Disclaimer: This analysis is based solely on technical chart patterns and should not be considered financial advice. Market conditions can change rapidly, and it’s crucial to conduct your research and consider fundamental factors before making any investment decisions.

TATA MOTORSI am feeling bullish on Tata Motors for the short term. Let's see how it reacts around the key level of ₹800. If it holds and shows strength, we can decide whether to stay bullish for the long term. For now, I remain bullish.

Jaguar Land Rover Temporarily Halts U.S Shipments Amid TariffsJaguar Land Rover (JLR), owned by Tata Motors, has paused shipments to the U.S. market this April. The move follows a 25% import tax on vehicles imposed by U.S. President Donald Trump. JLR described the U.S. as a vital market and stated it is now adjusting to new trade rules with business partners.
The pause is a short-term step. The company aims to finalize longer-term strategies to manage the new tariffs. Analysts believe other British carmakers may soon follow this approach. Britain's auto sector faces pressure from falling domestic demand and the costly transition to electric vehicles.
David Bailey, a University of Birmingham professor, predicts more stoppages. He said automakers will reassess their plans amid rising costs and trade uncertainty. Recent data shows U.K. car production fell 13.9% last year to 779,584 units. Over 77% of these vehicles were exported.
The Society of Motor Manufacturers and Traders (SMMT) voiced concern. CEO Mike Hawes said the timing worsens an already challenging period. He urged swift trade talks to protect jobs and growth. The SMMT has stayed in regular contact with the U.K. government to seek solutions.
To soften the tariff’s impact, carmakers rushed to build inventories in the U.S. JLR was among them. U.K. car exports to the U.S. jumped 38.5% in Dec, 12.4% in January and 34.6% in February.
According to official figures, British automakers shipped £8.3 billion ($10.7 billion) worth of cars to the U.S. in the 12 months through September. Cars remain Britain’s largest goods export to the U.S. However, goods make up a smaller portion of overall trade. Services account for 68.2% of the £179.4 billion ($231.2 billion) in total U.K.-U.S. trade during the same period.
JLR is not independently listed. But looking at the parental company, Tata Motors (TATAMOTORS.BO) trades on India’s BSE. Its stock closed at INR 613.85 on April 4th, 2025 (6.15%).
Technical Analysis: Bearish Momentum Since July 2024 Highs
Tata Motors stock peaked at INR 1179 in July 2024. Since then, it has shown a sharp downtrend. It has surged in bearish momentum and has been breaking major support levels. In late January 2025, the price broke below key support at INR 715 and has retested it in March 2025. Currently, it trades lower and is approaching the next support at around INR 591.
If this level fails to hold, the price may fall to INR 525. The downtrend has persisted for months, indicating sustained bearish pressure in the market. The weekly RSI now reads 32, derived from deep bearish sentiment. If the RSI dips further, it may signal oversold conditions. However, the current momentum suggests the stock could still drop.
If INR 591 holds, a short-term bounce may follow, with a short-term recovery phase that could push the stock toward the descending trendline. Still, bears maintain control for now, and a break below 591 may accelerate further losses.
Tata Motors Its near supportTata Motors Near Support 626 | Technical Analysis
Tata Motors is currently trading near its key support level of ₹626. If this level holds, we may see a potential rebound, while a breakdown could lead to further downside. Traders should watch for confirmation signals and volume trends before making decisions. Keep an eye on RSI, moving averages, and trendline support for better insights.
🔹 Support : ₹626
🔹 Resistance : Next levels to watch
🔹 Trend : Monitor for breakout or reversal signals
#TataMotors #StockAnalysis #SupportLevel #TradingView #StockMarket

Tata motor at golden Fib ratio Tata motor at golden Fib ratio
Disclaimer :-
This is only for the knowledge purpose don't take it as a buy or sell recommendation do your own analysis before dealing in securities

Tata Motors at Make or Break Level: What Should You Do...?TATA MOTORS is currently facing significant short-term resistance at a crucial lower low level. The stock has attempted to breach this resistance twice this week but has encountered rejection on both occasions. If it fails to overcome this resistance shortly, we could anticipate a further decline, potentially nearing the 600 rupee mark. This outlook is especially pertinent given the company's recent weak earnings report, which has likely dampened investor sentiment and contributed to selling pressure.
Should the stock manage to successfully break through the resistance, it will be vital to monitor its ability to maintain this newfound position above the breakout level. Sustaining this momentum could signal renewed buying interest and potentially pave the way for a rally. Conversely, if the stock fails to break through the resistance one more time, it may present an opportunity to enter a short position, particularly after confirming a bearish technical setup of your choice—whether that be through indicators such as moving averages, relative strength index (RSI), or candlestick patterns.
For those considering a short position, our target price would be strategically set at 600 rupees, whereas if pursuing a long position, we would aim for a target of 825 rupees. This dual approach allows for a balanced strategy, aligning with market movements and technical indicators while managing risk effectively.
