Review and plan for 5th June 2025 Nifty future and banknifty future analysis and intraday plan.
Positional ideas.
This video is for information/education purpose only. you are 100% responsible for any actions you take by reading/viewing this post.
please consult your financial advisor before taking any action.
----Vinaykumar hiremath, CMT
TATATECH

TATA TECH - Bullish Inverted H&S Breakout (Daily T/F)Trade Setup
📌 Stock: TATA TECHNOLOGIES ( NSE:TATATECH )
📌 Trend: Strong Bullish Momentum
📌 Risk-Reward Ratio: 1:3 (Favorable)
🎯 Entry Zone: ₹750.55(Breakout Confirmation)
🛑 Stop Loss: ₹699.00(Daily Closing Basis) (~5.6% Risk)
🎯 Target Levels:
₹773.45
₹795.70
₹816.35
₹840.55
₹867.00
₹896.85 (Final Target)
Technical Rationale
✅ Bullish Inverted Head & Shoulder Breakout - Classic bullish pattern confirming uptrend continuation
✅ Strong Momentum - Daily RSI >60 & Weekly RSI >50
✅ Volume Confirmation - Breakout volume 3.43M(while posting) vs previous day's 767.40K (Nearly 5x surge while posting)
✅ Multi-Timeframe Alignment - Daily and weekly charts showing strength
Key Observations
• The breakout comes with significantly higher volume, validating strength
• Well-defined pattern with clear price & volume breakout
• Conservative stop loss at recent swing low
Trade Management Strategy
• Consider partial profit booking at each target level
• Move stop loss to breakeven after Target 1 is achieved
• Trail stop loss to protect profits as price progresses
Disclaimer ⚠️
This analysis is strictly for educational purposes and should not be construed as financial advice. Trading in equities involves substantial risk of capital loss. Past performance is not indicative of future results. Always conduct your own research, consider your risk appetite, and consult a financial advisor before making any investment decisions. The author assumes no responsibility for any trading outcomes based on this information.
What do you think? Are you watching NSE:TATATECH for this breakout opportunity? Share your views in the comments!

TATATECHKeep eye on TATATECH. If the price moves above 732, consider buying with a small SL.
Confirmation of the head and shoulders pattern occurs when the price breaks decisively below the neckline
Disclaimer:
This is not financial advice. Please do your own research or consult with a financial advisor before making any investment decisions. Investments in stocks can be risky and may result in loss of capital.

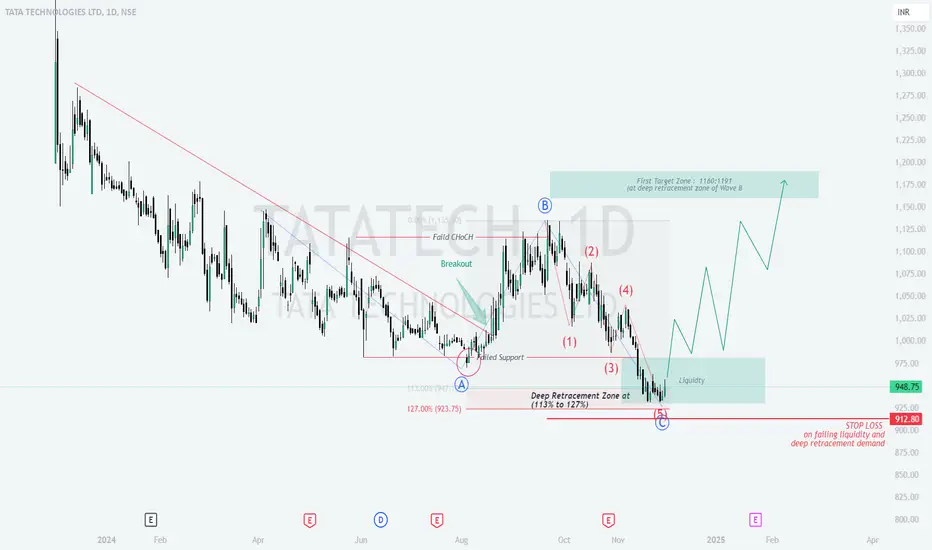
TATATECH : time to wake up now3. Tata Technologies Ltd
Analysis:
Wave Structure: A 5-wave corrective structure with Wave C reaching a deep retracement zone (113%-127% of Wave A).
Liquidity Zone: Indicates possible institutional accumulation near current levels.
Target Zone: Marked at 1160-1191 INR, aligning with Wave B retracement levels.
Stop Loss: Placed at 912.80 INR, just below the support zone.
Trading Plan:
Action: Initiate buy positions at current levels (948.75 INR) or near the 923-912 zone if prices dip.
Stop Loss: Place at 912.80 INR.
Targets:
First Target: 1160 INR.
Final Target: 1191 INR.
Reasoning:
Confluence of support in the retracement zone suggests potential for reversal.
Target aligns with historical resistance, providing logical exit levels.

Tata Technologies Trying to bounce after forming a bottom. Tata Technologies Ltd. CMP – 1130.30 ( Long Term Investment Idea) (Potential Candidate for becoming a Portfolio Stock in future)
Market Capitalization Rs 45,852.7Cr
Red Flags:🔴
High Valuation
Declining cash from operations annual
Green Flags:🟢
No debt
Zero promoter pledge
FIIs are increasing stake
MFs are increasing stake
Improving annual net profit
Happy Candles Number – 42/100
X/2 Fresh Entry/ averaging / compounding after closing above 1132
Final Entry 1166
Targets: 1203, 1227 and 1257
Long term target: 1286, 1348 and 1404
Stop loss: Closing below 1070
The above information is provided for educational purpose, analysis and paper trading only. Please don't treat this as a buy or sell recommendation for the stock. We do not guarantee any success in highly volatile market or otherwise. Stock market investment is subject to market risks which include global and regional risks. We will not be responsible for any Profit or loss that may occur due to any financial decision taken based on any data provided in this message.
