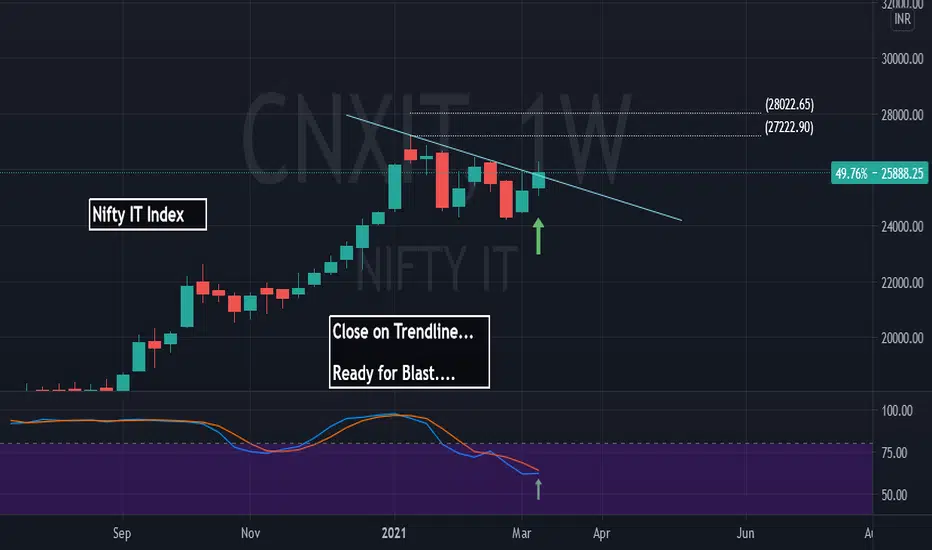
Nifty It Index will it blast ???On the verge of Blast....
Closed right on weekly trend line..
Watch out for many opportunities....
US Economy will do good this year...
Apne IT Majors ki Chandi hi Chandi.....
TCS
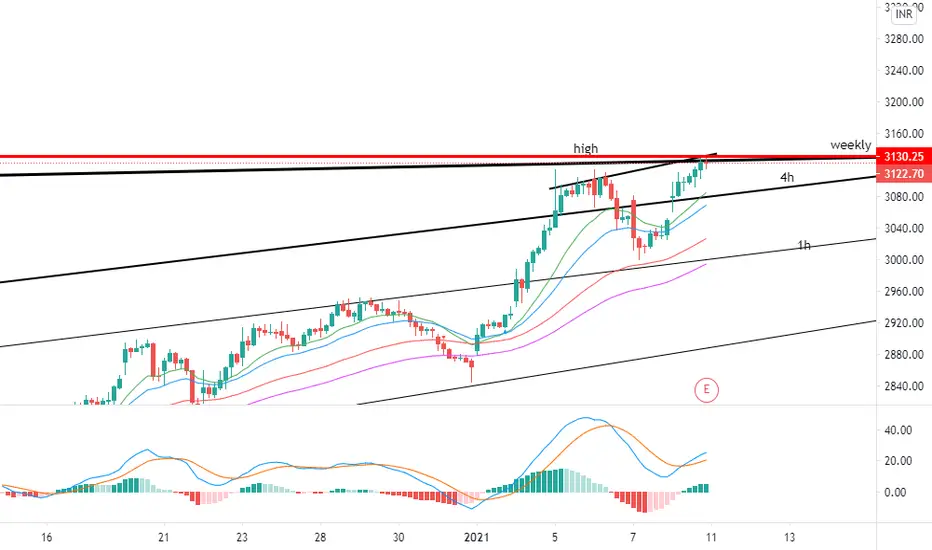
TCS: moving upward 🚀 swing setup TCS breaks all resistance and moving upward... short-term setup at buy (3130-3160).


TCS Long broke previous trendline and closed above ressitance level good entry for intraday or small positional trade

TCS - Trendline BreakoutTATA CONSULTANCY SERVICES
Breaking Out Trendline
Bouncing off Main Trendline
Bouncing off 100 Daily MA
Targets in Green

TCS-INTRADAY Inverse H&STCS bounced from FIB 23.6 and still can go up anytime after retesting short term resistance. Also it is making an inverse H&S should bounce perfectly if everything goes as planned.

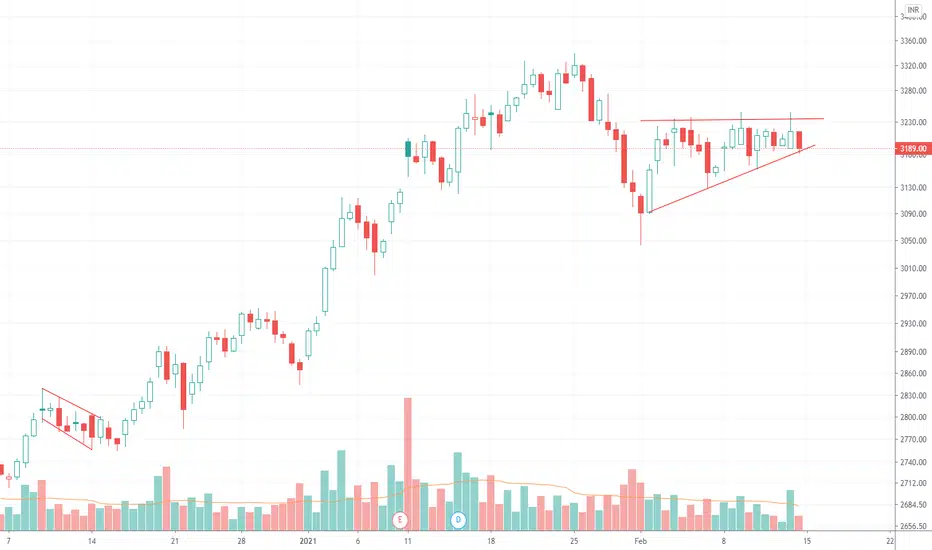
TCS good but confusing ascending triangle structureTCS forming a very good structure
But it broke down the trend line in the last few hours on friday
The momentum downside may be fake
It maybe true
With upcoming shorting opportunities visible in nifty
Tcs being a heavyweight will surely follow the trend
But we should be ready for everything
So make sure you trade wisely
Keep stop loss accordingly


IT STOCKS - Start of another leg of bull rally? - ANALYSISThe analysis is done purely based on chart patterns and price action.
The analysis is done on 15 min TF, but the target as shown in charts can take couple of days upto weeks.
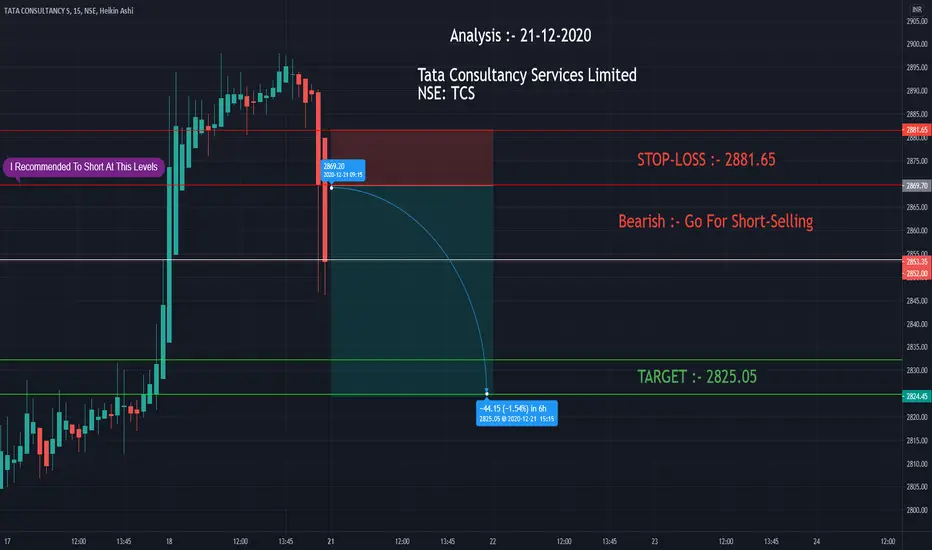
As can be seen from NITFY IT chart as well as from charts of stocks linked below, price went for retracement phase, made a low on 21st December 2020 and then gave breakout from trendline.
Thereafter the price gave good breakout and came down to retest the levels.
This can be a signal another leg of bull rally.
Targets are determined with the help of Trend-Based Fib extension tool.
Traders must check for signals of reversal before entering into any trade.
This analysis is just for study purpose and to show beginners how to analyse a sector and its stocks.
This is not a trade recommendation. Traders must trade with their own risk and money management.
TCS chart analysis-
INFY Chart analysis -
WIPRO chart analysis -
HCLTECH chart analysis -
Feel free to comment for any suggestion or query regarding price action or chart analysis.

TCSTCS, 15 MIN CHART
Can go towards 3275, and 3338
Stoploss below 3180
Disclaimer
I am not SEBI REGISTERED Analyst
My Studies are Educational purpose only
Consult with your financial advisor before trading or investing

Shorsell blo 3187
Tgt 3128
Book profit as per your risk and reward ratio
Don't wait for entire target.


A short on TCS will make my kitty GreenA formation of M pattern breaking down the Bull Flag is seemed to be formed which can witness us to take profit at the nearest gravitational BLACK LINE


Go long at current price, SL is close below 11.4, PT 14-15Clear breakout with good volume, retest at small volume


Infosys - All poised a decent correction ? Stay cautious I usually prefer a 3-hour time frame chart to understand the longer trend of the stock.
IT stocks have had a stellar rally since the March lows and it seems to me that the bulls are finally getting tired before they get active all over again.
Infosys the beast is showing some serious negative divergences on a 3-hour time frame. Additionally, the dollar index is also looking to bottom out in near time :)
Infosys can correct till 1020-1050 in near short time :)

TCS is bullish should buy from daily trendline supportTCS is bullish should buy from daily trendline support

Nifty it index viewNifty it index given upside break out after a correction.
Many stocks like Tcs, Mindtree, Infy, Techm and other stocks also given break out or ready to break out. Buy on dip simple.

TCS 2.0Nice chart formation, and a consistent move in the channel. After some consolidation looking good for 3K this time !!
