TCS Weekly ChannelLooks like TCS is about to breakout on weekly chart..
Lets hope closes above the weekly channel line...
Trading levels marked..
Happy Trading...
Like... Share..Follow
TCS

Weekly pattern breakout in TCSTCS is forming beautiful price action from past 2-3 Years and it has given a breakout in weekly time frame.
Stop loss is going to be below trend line and target can be as per ones risk reward.

TCSthis IT stock breakout major resistance level if this week candle closed strongly then considered as good breakout and only for educational purpose

TCS--@Breakout or Breakdown ??I am sharing the important levels of Support and Resistance. These levels plays a crucial role in trading decisions, as they act as reliable markers of price movements.
------>>Support levels are price points where an asset tends to find buying interest, preventing it from falling further.
---->Resistance levels, on the other hand, are points where selling pressure typically prevents the asset from rising higher.
Take a look at these levels and trade accordingly. Recognizing and respecting these support and resistance levels can help traders make informed decisions and manage risk effectively. They serve as key reference points for technical analysis and are vital tools in successful trading strategies.
Trade safe...Thank you guys for your support

TCS // Short Term Trade Opportunitywww.tradingview.com
NSE: TCS : After touching its 52w HIGH recently, the chart looks Neutral in current pullback condition. The concerning item are Open Gaps. As per Gap theory, every Gap has to be filled. So, why to look for an opportunity, if possible. Here you go:
If TCS goes below 3850 level, one can go SORT having the Bearish view. The first target can be 3820. The next target will be 3750.
For bullish view, if it goes above 3870, you can go for LONG position with the targets as 3897 / 3910 / 3923 / 3965.

TCS TCS is currently moving in range at weekly timeframe for more than 3 years.
TCS has shown a decent performance in recent Q3 result.
TCS Q3 Results Live Updates | Key Highlights of the Quarter Ended December 31, 2023
Revenue at `60,583 crore, +4.0% YoY, +1.7% YoY in Constant Currency
Operating Margin at 25.0%*; an expansion of 0.5% YoY
Net Income at `11,735 crore*, +8.2%* YoY | Net Margin at 19.4%*
Net Cash from Operations at `11,276 crore ie 102% of Net Income
Diverse and inclusive workplace: Women in the workforce: 35.7% | 153 Nationalities
Investing in the workforce: 39.7 million learning hours YTD | 3.7 million competencies YTD
LTM IT Services attrition rate at 13.3%
Dividend per share: ` 27.00, including ₹ 18.00 as special dividend | Record date 19/01/2024 | Payment date 05/02/2024

TCS Daily timeframe analysis for long term
NSE:TCS is strong bullish after it has taken splendid bounce from golden zone and has reached first target since buying level 3534.
Next Buy Level is 3679 - 3534. We can see long term move above 3680 if it give pullback buy more near 3679 to 3534 range.
Major targets levels are highlighted in blue lines.

TCS --Trading in a channelThis stock is trading in a bullish channel...
wait until price breaks this channel and gives us retest to sell...If price comes back again to top side will look for sell...keep looking for short..

#QUICKHEAL 244 Buy TGT 300 SL 219 Recommended - Rachit Sethia QUICKHEAL 244
TGT 300
SL 219
RR >2
Return > 22%
TF < 6M
Factors: BULLISH WEDGE BREAKOUT Trend Following Rising Volume with rising Prices. Flag pattern breakout. Pennant Pattern Breakout with Bullish Candle. Retest Successful. Higher Highs & Higher Lows. Broken above RESISTANCE levels Trading at SUPPORT levels Earnings are strong. Bullish Wedge Breakout Risk Return Ratio is healthy. And Rising from Double Bottom Pattern to Flag Pattern forming. If you like my work KINDLY LIKE SHARE & FOLLOW this page for free Stock Recommendations. With 💚 from Rachit Sethia

TCS BREAKOUT WTCS has given BO on W TF
from cmp we can expect good move, here we can plan a swing trade.

TCS trending upwardsTata Consultancy Services Ltd. is a leading global IT services, consulting and business solutions organization offering transformational as well as outsourcing services to global enterprises. The company has a global presence in multiple industry verticals and services consisting of consulting, integration, application services, digital transformation services, cloud services, engineering services and many more.
Tata Consultancy Services Ltd CMP is 3494.55. The Negative aspects of the company is high valuation (P.E. = 28.6). The Positive aspects of the company are no debt, FIIs are increasing stake, MFs are increasing stake, improving annual net profit, improving cash from operations annual.
Entry can be taken after closing above 3501. Targets in the stock will be 3582, 3682 and 3765. Long term target in the stock will be 3853+. Stop loss in the stock should be maintained at Closing below 3000.
The above information is provided for educational purpose, analysis and paper trading only. Please don't treat this as a buy or sell recommendation for the stock. We will not be responsible for any Profit or loss that may occur due to any financial decision taken based on any data provided in this message.

TCS --Near its Demand Zones??I am sharing the important levels of Support and Resistance. These levels play a crucial role in trading decisions, as they act as reliable markers of price movements.
------>>Support levels are price points where an asset tends to find buying interest, preventing it from falling further.
---->Resistance levels, on the other hand, are points where selling pressure typically prevents the asset from rising higher.
If price breaks the resistance, we have a chance of filling the bearish gap, soo keep in buyside until it touches the zone of resistance and bearish gap.
Take a look at these levels and trade accordingly. Recognizing and respecting these support and resistance levels can help traders make informed decisions and manage risk effectively. They serve as key reference points for technical analysis and are vital tools in successful trading strategies.
Trade safe...Thank you guys for your support

TCSNSE:TCS
One Can Enter Now !
Or Wait for Retest of the Trendline (BO) !
Or wait For better R:R ratio !
Note :
1.One Can Go long with a Strict SL below the Trendline or Swing Low.
2. R:R ratio should be 1 :2 minimum
3. Plan as per your RISK appetite and Money Management.
Disclaimer : You are responsible for your Profits and loss, Shared for Educational purpose
#DYNAMATECH 4126 Recommended Buy - Rachit Sethia #stockstowatchDYNAMATECH 4126
Open Targets and Open SL
Factors: BULLISH WEDGE BREAKOUT Trend Following Rising Volume with rising Prices. Flag pattern breakout. Pennant Pattern Breakout with Bullish Candle. Retest Successful. Higher Highs & Higher Lows. Broken above RESISTANCE levels Trading at SUPPORT levels Earnings are strong. Bullish Wedge Breakout Risk Return Ratio is healthy. And Rising from Double Bottom Pattern to Flag Pattern forming. If you like my work KINDLY LIKE SHARE & FOLLOW this page for free Stock Recommendations. With 💚 from Rachit Sethia

Weekly Double bottomTCS has broken out of weekly double bottom and a symmetrical triangle
Upmove confirmed?


TCSAfter very long time TCS has broken out from the triangle. Some good upside is visible on the chart but do it keep SL & position size in check

TCS--@Resistance Zone?? This stock has encountered persistent resistance within the 3460 range on multiple occasions. On the flip side, the price has consistently found support along a trendline, leading to upward movements.
It's advisable to maintain a bullish perspective as long as the price remains above this trendline. However, exercise caution, as there's a possibility of a false breakdown below the trendline, which could mislead traders and necessitate a prudent approach before considering short positions.

TCS AnalysisAfter a strong gapdown... price is in a range
a drop base drop is going to observe in this stock...
look for sell up to 3340-3330 levels...

TCS - A Crucial LevelTCS remains at a crucial resistance level. While a move to 3580 could trigger a bullish scenario, price below the level has a bearish touch.
This is only an idea. Any trade/Investment should be made with proper risk management only.

TCS Long opportunityDouble Confirmation
Target 3700
CMP: 3421
XABCD Pattern & ABCD pattern both are giving same target. Rest info mentioned on chart

TCS Parabolic Trend BrokenInterest rates are already turning over and should increase mortgage applications which should prove to be bullish for this stock. Tiny homes and container homes will gain in popularity during this time and I believe TCS will benefit greatly from the new trend.
Weekly RSI has bullish divergence going all the way back to Dec 2016 + the last year is showing huge divergence. This one should not take long to develop

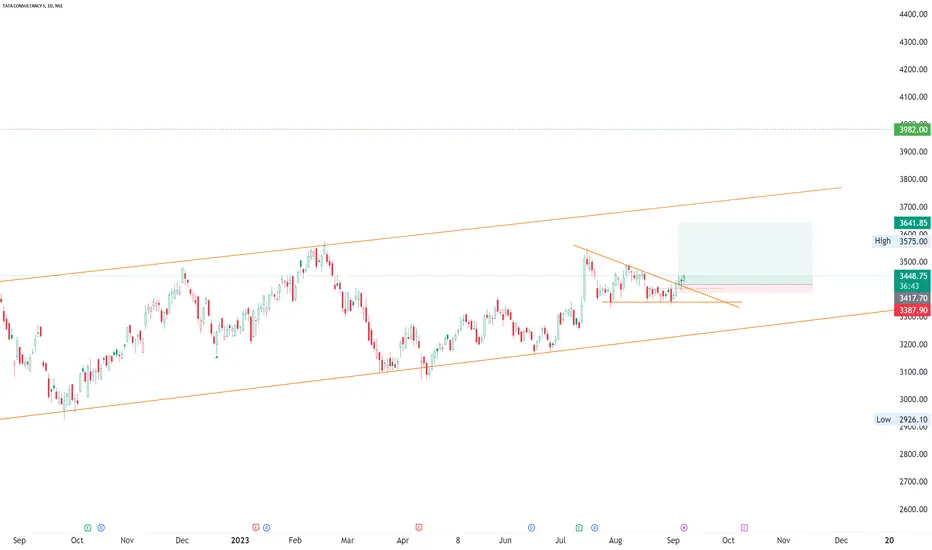
TCS--Will break 3400 ??observations::
facing resistance multiple times from this zone...3400 range...
if this range is broken will see a strong momentum towards upside is possible...
we have a trendline support as well...now price is at important level...
if price takes the help of trendline will be on buyside...keep track this levels...
3200 and 3400.
