Nifty, Banknifty and top stocks analysis for tomorrow + levelsIndices opened strong, but faced headwinds at higher levels. What could be going on? I feel this is normal and that the indices need some time to stabilize. What's your view?
TCS

#100% Perfect Intraday In Option# We make only profit
#We Achieve All Level
#TCS #BANKNIFTY #NIFTY #RELIANCE #INFY #HDFCBANK

#BANKNIFTY For this Week#we make only profit
#Upside last level 35060.
#Strong Chance For 1500+ Downside Movement.


#Banknifty By @ayushsaini123#We make Only Profit...
# level is to important in Banknifty .
#i will tell all level in my Friday Video.

TCS Good Zones For #Bottomfishing Best Buy Zone: 2889 - 3398
Good Buy Zone: 3398 - CMP
Add on bounce, not while it is falling.
Long Term Portfolio Stock.
Tracking Quantity can be taken at CMP. (Tracking Quantity : Suppose you want to Invest Rs.X in a particular stock. The amount between Rs.X/5 or Rs.X/10 would be tracking quantity) (‘Tracking Quantity’ of a stock in your portfolio will help you keep a track of the stock if it is coming in the indicated buying zones.)(Sometimes Out of sight goes out of mind so buying tracking quantity of stocks that you want to add in future helps.)

#Banknifty By @ayushsaini123#We will make only profit..
#banknifty #Nifty #Trading
#I will tell you everything in video
#Please try to understand level's

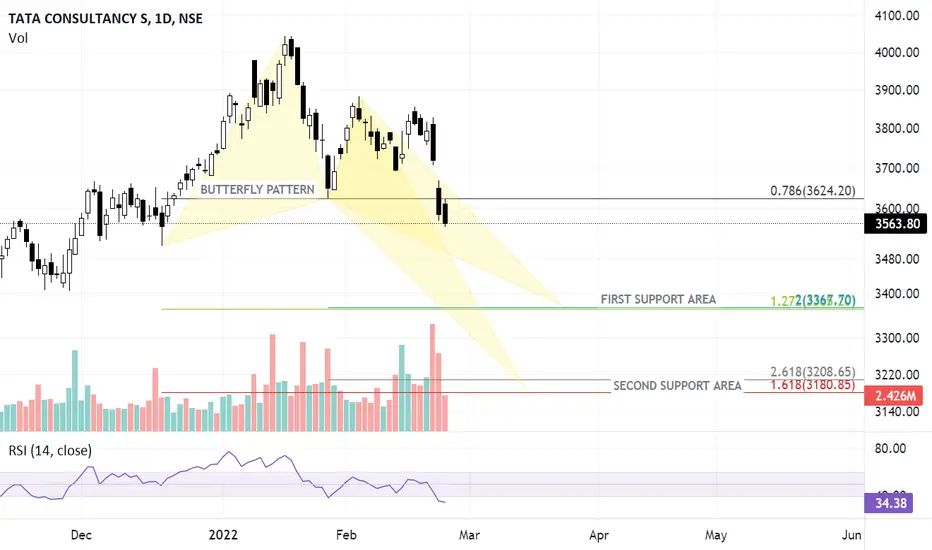
TCS HARMONIC LEVELS FOR POSITIONAL TRADINGTCS is currently in a correction mode, and it is likely that we may see further weakness in the stock, and stock could move lower to 3400 to 3200 levels in the near term.
This is a great stock for Investment and for positional trading also.
I can see butterfly pattern formation on its daily chart, which is suggesting a good support area around 3400 -3367 levels and at 3180-3208
Stock can be bought in tranches as both of these levels can be seen in the stocks.
Disclaimer: Not a recommendation to trade.
TCS 1DTCS currently at the bottom of a crucial zone. It can give a good move either side.
If it breaks down expected target can be around 3100.
If reverses from this zone one can expect a target of 4050+
Trade safe. Manage risk. Be profitable.
Please follow us for more simple trading analysis and setups. Also let me know in the comment in case you have any queries.
Disclaimer :- This is just my view. Please analyze charts yourself and then decide to take any trades.

#Option Trading #Banknifty#We will make only profit..
#banknifty #Nifty #Trading
#I will tell you everything in video
#Please try to understand level's


#BANKNIFTY JOIN FOR INTRADAY #We will make only profit.
#BANKNIFTY#NIFTY
#I will Tell you full trade in my Video.
#Don't buy any Trade without stop loss..


TCS is in a Important Breakout Point, Buy/Sell after BreakoutTCS Intraday Strategy for 10/02/2022
TCS is in a Important Breakout Point, Buy/Sell after Breakout

Nifty, Banknifty and top stocks analysis for tomorrow + levelsBudget over rally over? We saw Nifty closing almost exactly at the budget day's closing price, possibly owing to a resumption of FII selling. Where do you think we could be headed? Do you foresee a deeper correction? IT especially looking a little weak.

TCS LongTCS has been a fundamentally good stock which ultimately is good to hold for a long time. However, The recent budget has also been focused on IT which is an added advantage for IT Sector.
At present, the chart shows Cup and handle pattern which will fetch 10% and above on breakout. I'm holding TCS for quite a while now and looking forward to investing more.

Nifty, Banknifty and top stocks analysis for tomorrow + levelsThe market ended on a rather indecisive note after gapping up. How are you going into the Budget day? What's your view?

Support Zone of Nifty IT: Good time to Accumulate Tech StocksNifty IT heading towards Support Zone. Time for Bottom Fishing of Tech Stocks.
Go through heavy weight counters of IT Sectors
Infy
NSE:INFY
TCS
NSE:TCS
Tech M
NSE:TECHM
Naukri
NSE:NAUKRI

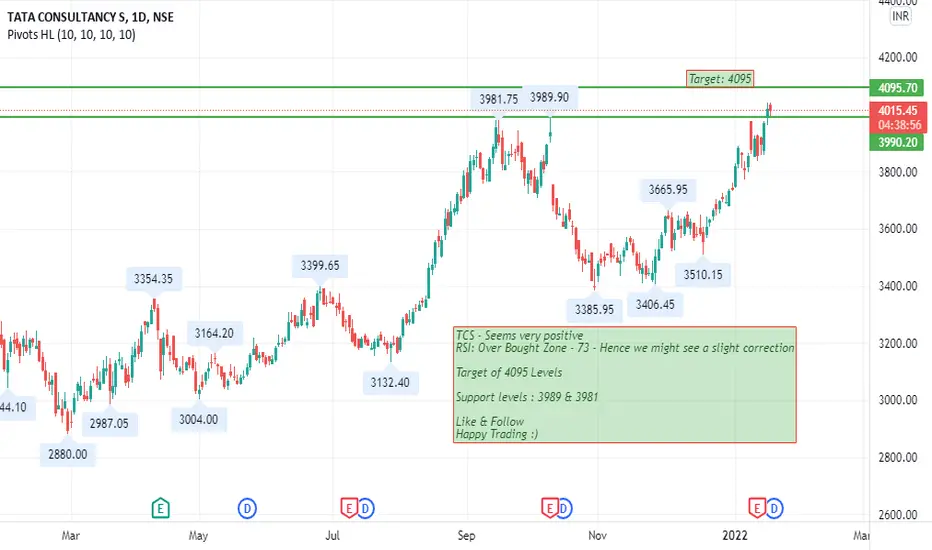
TCSTCS - Seems very positive
RSI: Over Bought Zone - 73 - Hence we might see a slight correction
Target of 4095 Levels
Support levels : 3989 & 3981
Like & Follow
Happy Trading :)
Nifty, Banknifty and top stocks analysis for tomorrow + levelsNifty breaks down, closing below 18. Banknifty survives! What's your view on the market? Pre-budget volatility, profit-booking or a deeper rejection of highs?

TCS intraday long tradeAn obvious flag and pole pattern in TCS on 15 mint time frame.
On breakout it can give a minimum target of 4050
Buy onlu after a breakout and carry the position if it closes above 4053 on daily basis.

TCS - Pullback completed - Ready to Go upObservations:
1. Formed Triangle pattern (in this year 2021) - Support is raising with the same level of Resistance - indication to go up shortly
2. Went up shortly and pulled back to same resistance level (now turned to support) - 2nd confirmation to go up
3. Targets are specified in the charts above.
Note:
I'm not recommending buying this stock. This is for education purposes.
Please invest after careful research. I'm not responsible for your profits/losses.
- Gnanasekaran

V Shaped recovery for Nifty in progress?Certainly looks like V-shaped recovery is on cards. Two key resistances in the path of V-shaped recovery are 18243 and 18343. The supports levels from the current closing price of the day are 18125 and 17957. Below that range 17494 which is 50 EMA will be major support. Bears might take control of NIFTY below this range. Three IT companies and their performance this evening will be key factor for the coming two days. Infosys results seems to be above par. Increasing COVID19 cases and Hawkish stand of US FED can spoil the recovery party. We still remain cautiously positive at this level as it has been a phenomenal run from the recent bottom of 16410 on 20th December. Will NIFTY glide ahead or halt and correct a little from here? Much depends on three super duper bumper results to be declared this evening.
