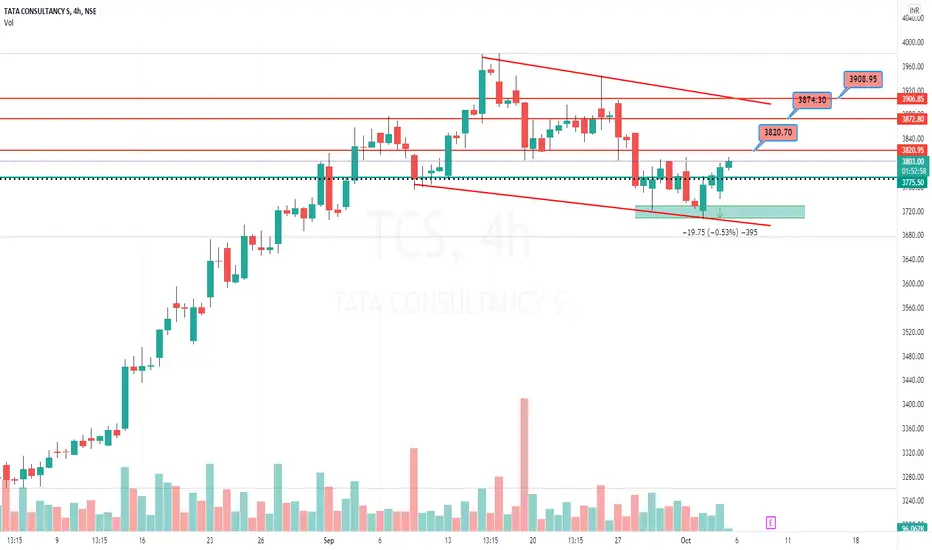
Falling ChannelStock Analysis: TCS has formed falling channel it is good buy now with below demand level as stop loss for the target given on the chart.
lets' see
Happy Investing!
Tcslong
Tcs breakout buyBuy if tcs price crosses above 1900 tomorow.macd histogram turning positive and macd crossover with rsi above 50 is indicating a buy

TCS, 1D TimeframeTCS has just given breakout of trendline in 1D time frame. But we should be cautious also as it is on the R2 of Pivot Points. One can go long as soon as it crosses the R2.

TCS looks good On 2H chartNSE:TCS
TCS on 2H chart showing good breakout to consolidation area of 3155-3240. And it may show good up move from here. One can consider this counter for swing trade. TCS now has a strong support of 3150 while next resistance area is of 3380-3400
hari om
shree ram
ambdnya

TCS LONG SETUPOn one hour time frame basis TCS is forming an ascending triangle pattern and if we see overall IT sector is also bullish. we will go long on TCS for positional basis for the target of upper resistance formed. Good luck traders.
(Note:- This is my personal views. Please consult with your financial advisor before taking trade.)

TCSTcs tooked support as per price action, one can go long at current level or in dips with mentioned key levels in chart
Disclaimer
I am not sebi registered analyst
My studies are Educational purpose only
Please consult with your Financial advisor before trading or investing

BUY TCS AROUND 3183 TGT 3300/3450 SL BELOW 3170 The Scrip is @ support and trying to hold 50dma which is a good level for short term entry for prescribed target and stop loss. As the results were below expectation but they were not that bad to make any further downside move as dollar is supposed to be strong in upcoming time.


SEND TCS TO NEW ATH ₹4500The most powerful stock right now is TCS.
Bullish consolidation in continuation.
Just needs technical analysis NSE:TCS to trade this, forget the news.
EVERYTHING IS PRICED IN THE CANDLES.


TCS Ascending triangle breakoutBIG BREAKOUT! ALL TIME HIGH
Targets would be 3600, 3800 on swing levels
Stoploss would be a close below 3320 levels on daily charts

FULL SEND TCS TO ₹4440 : NEW ATH INCOMINGMost of the large caps mimic the same setup.
Long term bullish trend intact.
Measure move on horizontal ranges S/R
Bullish ascending triangle.
LONG TF out of it! NSE:TCS


Short Term Cash Buy TCS @3153.00-3156 SL 3101 TGT 3240It broke 3124(R1) and now about to break 3168(R2).
MACD cross at 3122, RSI indicates more upside.
TK cross over at 3088 on hourly chart.
Ichimoku cloud break out at 3101 and look set for getting close to nest resistance 3256 which is close to our TGT.


POSITIONAL INVESTMENT VIEW IN #TCS BREAKPOSITIONAL INVESTMENT VIEW IN #TCS BREAK OUT RETEST 3130 - 3140
BUY TCS 3130 - 3140
STOP LOSS - 3040 CLBS
TARGET -3250 3300 3050 3600 ++++

TCS TIME TO LONGTCS IS NOW ON A TREND LINE SUPPORT GOOD TIME TO GRAB THIS GIANT STOCK FOR SHORT AND LONG TERM

TCS intraday position for 23/04/21Disclaimer: for education purposes only and not recommended for trade
Intraday position for #TCS for #intraday on 23/04/21 and each line has it's own entry and exit point.

POSITIOAL INVESTMENT VIEW IN #TCSPOSITIOAL INVESTMENT VIEW IN #TCS
TCS LOOKING VERY STRONG CMP 3080 KEEP ADDING TILL 3040
STOP LOSS - 3000 CLBS
TARGET -3200 3400 3600 +++ NEW HIGH

TCS Long broke previous trendline and closed above ressitance level good entry for intraday or small positional trade

TCS-INTRADAY Inverse H&STCS bounced from FIB 23.6 and still can go up anytime after retesting short term resistance. Also it is making an inverse H&S should bounce perfectly if everything goes as planned.
