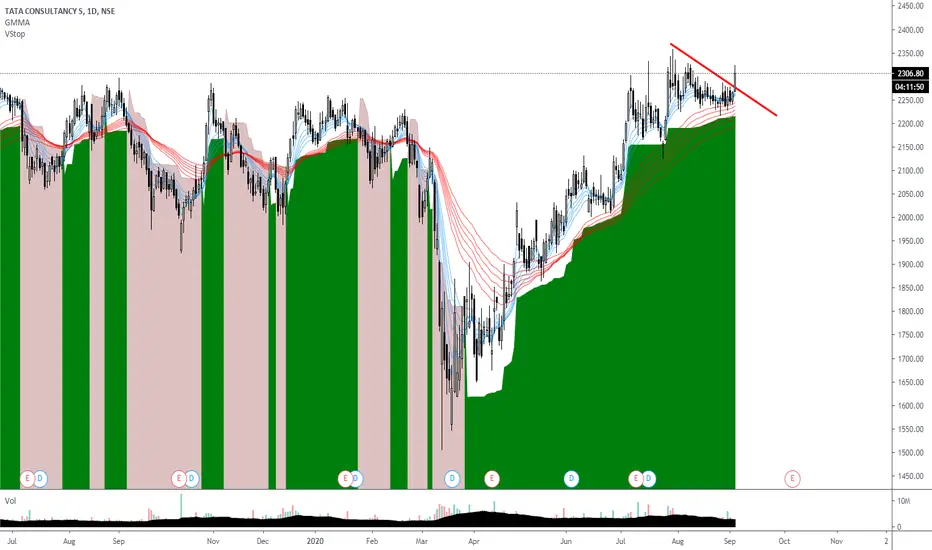
Tcslong


TCS viewAfter a big run TCS paused for some time. And didn't close in weekly candle below 2650. Now it's looks like to ready for another break out in chart and RSI. If close above 2680 in 1 hour candle buy simple.

Live Intraday Trading - A trend following momentum trade !!TCS has got all the good news along with nifty for going uptrend , just a good entry and good management of a trade !!

Live Intraday Trading - Trading a positive news in a stock !!A gapped up opening in the morning , similarly a positive news in the stock . Just waited for a perfect entry .
Usually the stock in news are very volatile , so they must be traded very cautiously .

TCS does it give similar returns like infy or other it stocks?I am looking at TCS for long time, well for one month, but it did not brake to new highs.
Now it broke the descending triangle pattern.
Does it give the similar brake out like infy or wipro?
Let see
Your humble trader
Kiran

TCS resistance Break | 3000 + comingTCS just broke the supply really undervalued companied among other tech giant having price in $ not justifying the price here.
this stock value more than 5000 rs we just stated here
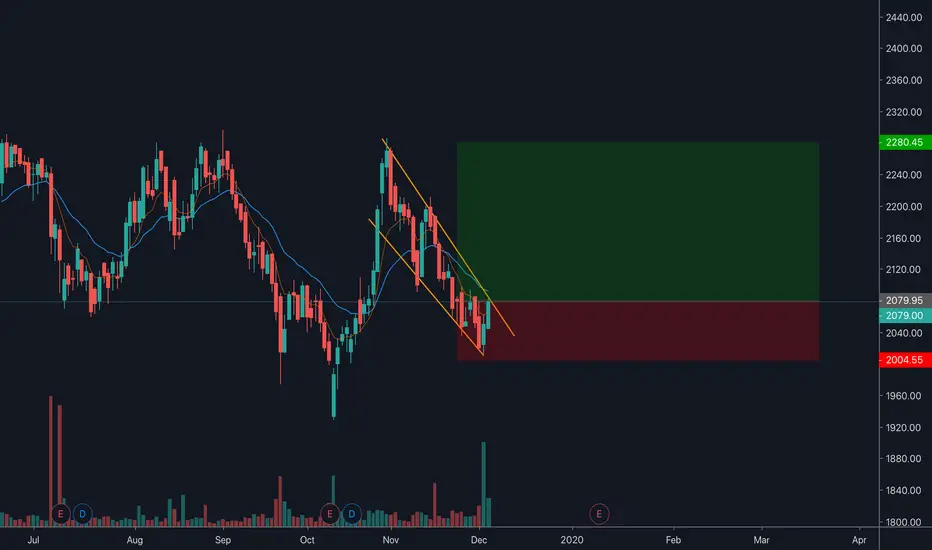
below 2350 is a good buy with stop below 2100

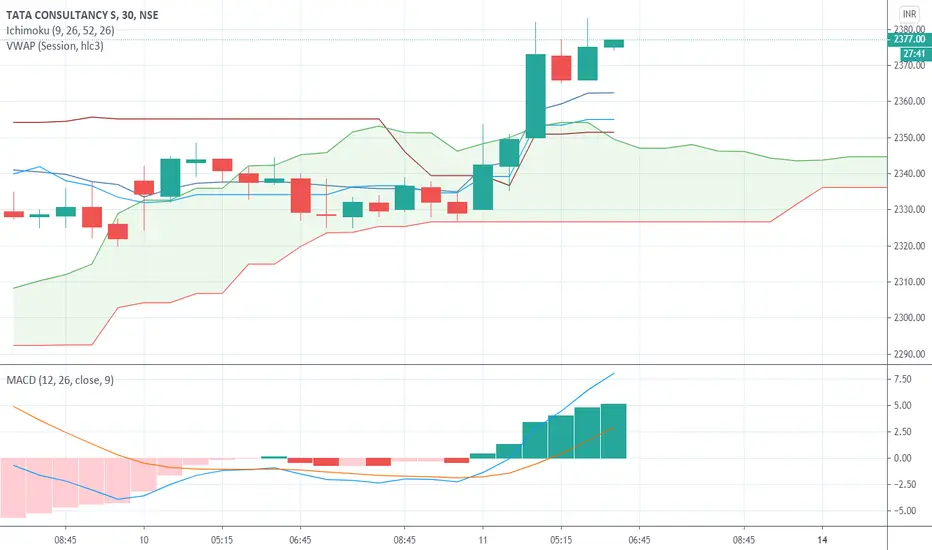
R-0210 TCS about to break R2 2374 next resistance 2490 GO LONGShort Term Cash Buy TCS @2360.00-2367.7 SL 2313.7 TGT 2449(Short term trend remains positive)
Last time we did 2285->2360 and booked good profit, it is continuation of short term trend.
Above VWAP and about to break R2 2378-2383 once it breaks it convincingly can see upside in the range 2450-2490.
MACD cross over + TK cross over + folloed by ichomoku cloud break out

R-0202 Cash Buy TCS @2275.00-2280 SL 2214 TGT 2395Short Terma Cash Buy TCS @2275.00-2280 SL 2214 TGT 2395
Crosses the pivot point 2267 and next resistance 2318/2378/2490
We expect the momentum to continue as its above VWAP and TK cross over with MACD cross over

R-0141 BUY TCS 2292-2300 SL 2244 TGT 2384Ichimoku cloud break out + MACD cross over + TK cross over + Above VWAP so we expect rally to continues 2350-2400

TCS Entered Blue Sky expect to Rise till 2450 Minimum ! Buy and Hold it for 1-week Wonderful gains going to come
Close above 2300 for the first time after 3 years, lets make it go long and better.
Stop Loss of 2260

TCS Long Trading SetupNeed to settle in channel
Adding some stock here
Below 2100
Stop : 2000
Target : 2200 , 2300


TCS Long Target done all target done successfully and now price at resistance will take some time to clear above zone

TCS Breakout Regression Trend and Hit last Target - Next LevelTCS Breakout Regression trend and stock Hit last Target 2245 and closed above. TCS has more then 20MA volume since last 3 treading session
Showing BULLISH in all indicator:
CCI in Overbought
RSI near to Overbought zone
Stoch in Overbought
Higher High since 3 day
Stock outperforming from Benchmark and Sectoral Index
----------------------------------------------------------
Support : 2200
Breakdown : 2256
CMP : 2263
Breakout : 2277
Short Target : 2295
----------------------------------------------------------
(Disclaimer: This is only for educational purpose.)
--------------------------------------------------------

TCS Long Update | First Target Done Price hit First Target and now moving towards ..
Market is Bullish and India too.

Buy TCS | Expected Profit 12-16%Goodluck Capital Recommendation
Buy Tata Consultancy Services
(NSE: TCS)
Buy Range - 1970-2000
Target - 2200-2300
Potential Return^ 12-16%
Once 1st target hit, reset StopLoss at 2118
^ Potential returns are calculated based on the median of buy range.

TCS Price At Daily Trendline Support Volume is good we need daily close above the Trend line Support
if we have that on monday market than ready for the big 10% jackpot