CREAM of the CROP on Bittrex Our scanners pulling up a LOT of shitcoins forming potential bottoms on various 9s, 9,13s AND consistently exhibiting RSI divergence.
The following are just a few. Will update if I I get long any of these GEMS. Will be interesting to see how the lot of these perform on average. DARE say the Market is RUNNING OUT of SELLERS?!
BITTREX:HMQBTC
BITTREX:DYNBTC
BITTREX:XZCBTC
Last one on Polonoeix BITTREX:LBCBTC
Tdsequential

Bitcoin Daily Update (day 245)I believe that it is possible to beat the market through a consistent and unemotional approach. This is primarily achieved through preparing instead of reacting. Click here to learn more about how I use the indicators below and Click here to get my complete trading strategy! Please be advised that I swing trade and will often hold onto a position for > 1 month. What you do with your $ is your business, what I do with my $ is my business.
My recent Bitcoin Bubble Comparison - 3 Day Chart led to the following calls: < $5,750 by 11/15/2018 & my prediction for the bottom is $2,718 by 1/20/19 | My Bitcoin Bubble Comparison - Monthly Chart closely mirrored my price and time targets | Calling for $35 ETH before the end of 2018.
Previous analysis / position: “However what is most important to me is the daily shooting star that closed 2 hours ago. My stop loss is set pennies above the top of that wick.” / Short ETH:USD from $197.81 | Short USDT:USD from 0.968 (order at 0.97 to close at nominal loss)
Patterns: Symmetrical has worked it’s way past three quarters completion and is no longer valid (just like descending triangle) | Potential h&s on 4h
Horizontal support and resistance: S: $6,319 | R: $6,332 - $6,339
BTCUSDSHORTS: Almost back down at support levels. Makes me think that this is the most pressure we have seen from leveraged longs all year and the price has gone nowhere. Consider this a bearish divergence since shorts pulling back this hard/fast usually equates in a price increase.
Funding Rates: Longs pay shorts 0.01% | A chart showing funding rates would be very interesting, anyone know where I could find one?
Short term trend (3 day MA): Today’s candle closed below | bearish
Medium term trend (8 day MA): Close below but still has bullish cross with 3 MA = neutral
Long term trend ( 34 day MA): Bearish | If/when 8 makes bearish cross with 3 then all with be in alignment.
Overall trend: Bear
Volume: This weeks candle has more volume than last weeks. So we have that going for us, which is nice.
FIB’s: Broke through 0.618 at $6,312 and 0.5 at $6,345 | 0.382 held at $6,378
Candlestick analysis: Price broke down below yesterday’s shooting star, confirming the entry outlined in Day 244
Ichimoku Cloud: Fell out of 4h cloud and it is showing massive resistance overhead
TD’ Sequential: 4h r9
Visible Range: Testing highest liquidity zone from the last year. Being below the point of control (POC) should lead to strong resistance above. 4h cloud agrees.
Price action: 24h: -0.28% | 2w: -1.24% | 1m: -2.08%
Bollinger Bands: Should test bottom band after finding strong resistance from MA
Trendline: bear: $6,448 | bull: $6,227
Daily Trend: chop
Fractals: Two down at $6,313 | Up: $6,447
RSI: Has cooled off on shorter TF’s. If we are going to get another rally (if you consider a 1% move a rally) then it should come soon.
Stochastic: Incoming 4h buy signal agrees with RSI assessment
Summary: Right now is a time to keenly watch the charts, even though it might not seem that way at first glance. We got a daily close below the 3 and 8 MA’s and at the same time we confirmed the shooting star that was pointed out in yesterday’s post.
If the 3 MA crosses below the 8 MA then we will be in a fully bearish setup. According to Tyler Jenk’s Consensio theory the price cannot trend until all moving averages are in agreeance (Consensio is Latin for agreement).
As long as they are jumbled up, like they are now, then further sideways action is to be expected. However, we are only one crossover away from the trends all being in agreeance and that is something to pay very close attention to. Being in a fully bearish setup does not necessarily mean the price will trend down, it simply means that the price is ready to trend down.
The chart doesn't look ready for that crossover quite yet. The 4h is on a red 9 and a 1-4 candle correction is expected to follow. After 4 - 16 hours the expected correction should be complete and we will be primed to get the final crossover when tomorrow's daily candle closes.


Bitcoin Daily Update (day 243)I believe that it is possible to beat the market through a consistent and unemotional approach. This is primarily achieved through preparing instead of reacting. Click here to learn more about how I use the indicators below and Click here to get my complete trading strategy! Please be advised that I swing trade and will often hold onto a position for > 1 month. What you do with your $ is your business, what I do with my $ is my business.
My recent Bitcoin Bubble Comparison - 3 Day Chart led to the following calls: < $5,750 by 11/15/2018 & my prediction for the bottom is $2,718 by 1/20/19 | My Bitcoin Bubble Comparison - Monthly Chart closely mirrored my price and time targets | Calling for $35 ETH before the end of 2018.
Previous analysis / position: “If you are not in a position then opening a short at $6,300 - $6,315 provides favorable risk:reward. A stop loss slightly above $6,400 makes a long of sense” / Short USDT:USD from 0.0968 (order set at 0.97 to exit at a nominal loss) | Short ETH:USD from $197.81 & Short ADA:BTC from 0.00001129
Patterns: Symmetrical triangle with $5,492 target if it breaks to the downside and $7,101 target if it breaks to the upside
Horizontal support and resistance: Prior support is expected to become resistance from $6,345 - $6,385 | S: $6,300
BTCUSDSHORTS: Pulling back hard, will it find support above 28,500? | Could this be the last squeeze before the trend starts?
Funding Rates: Longs pay shorts 0.01% | Do not think funding has been this out of balance towards longs in all of 2018
Short term trend (3 day MA): Price above and angling up = bullish | Trying to make bullish crossover with 8 MA (signals medium term trend along with 3 week)
Medium term trend (3 week MA): 3 & 8 MA’s are angling up but price is below = neutral
Long term trend ( 34 Week): bear
Overall trend: If 3 day crosses 8 that will make me short term bullish (although I will wait for much more confirmation before looking for a bullish entry). Definitely don’t like being against the trend with my shorts
Volume: gfy
FIB’s: Broke through 0.618 at $6,312 and 0.5 at $6,345 | Next up is 0.382 at $6,378
Candlestick analysis: Just took out daily shooting star. I was really hoping that the top of that wick would hold as resistance
Ichimoku Cloud: 4h cloud is fatting up after a bearish kumo twist. Shows thick resistance from $6,340 - $6,478 unless we can breakthrough the thin cloud before | Broke through 1h cloud on this last move | Daily cloud is right above the down trend line. This has saved me before, the area between the cloud and the bear trendline indicates a potential area for a bull trap
TD’ Sequential: D g1 | 4h g5 | Had a small 1 candle correction after the g9 on the hourly, now g2 > g1
Visible Range: Testing point of control for 2018. There should be a ton of built of resistance in this area
Price action: 24h: +0.088% | 2w: -1.66% | 1m: -11.52%
Bollinger Bands: Testing MA right now. MA is angling up which indicates that it is less likely to act as resistance
Trendline: Bear trend: $6,475 | Bull trend: $6,200
Daily Trend: bull
Fractals: Created new down fractal at $6,300
RSI: One hour RSI is very overbought (> 80) while we are trading at major resistance. Very strong indication of a reversal
Stochastic: 4h is overbought, agrees with 1h RSI
Summary: I rarely put any emphasis on the 1h hour chart. However I have the 1h & 10m RSI's to be very helpful for recognizing when we are overbought or oversold on a short term basis. After the price broke through the daily shooting star as well as the 4h shooting star from the prior candle I was very worried that we would pump right back through $6,400. Now I am feeling cautiously optimistic. Being overbought at major resistance is generally a very strong sign of a short term reversal.
If you took the position that I outlined yesterday then your stop should still be safe (for now) and I don't see any reason why that should be adjusted now. If you are still on the sidelines then this could be a great opportunity to build a short and use a tight stop loss. We are at a very significant resistance cluster and this was the original area where I suggested an entry from two days ago . Setting a stop loss anywhere from $6,450 - $6,550 makes a lot of sense based on horizontal and trend resistance.

Bitcoin Daily Update (day 242)I believe that it is possible to beat the market through a consistent and unemotional approach. This is primarily achieved through preparing instead of reacting. Click here to learn more about how I use the indicators below and Click here to get my complete trading strategy! Please be advised that I swing trade and will often hold onto a position for > 1 month. What you do with your $ is your business, what I do with my $ is my business.
My recent Bitcoin Bubble Comparison - 3 Day Chart led to the following calls: < $5,750 by 11/15/2018 & my prediction for the bottom is $2,718 by 1/20/19 | My Bitcoin Bubble Comparison - Monthly Chart closely mirrored my price and time targets | Calling for $35 ETH before the end of 2018.
Previous analysis / position: “Bounce to $6,385 | selloff to $6,000 | bounce to $6,150 and then breakdown $6,000” & warned against selling bear flag breakdown due to underlying support / Short USDT:USD from 0.968 | Short ETHUSD' from $197.81
Patterns: Coil
Horizontal support and resistance: S: $6,300 | R: $6,312
BTCUSDSHORTS: Closed below triangle
Funding Rates: Longs pay shorts 0.01%
Short term trend (4 day MA): Above MA, but it has not starting turning up - neutral
Medium term trend (4 week MA): bear
Long term trend ( 32 Week): bear
Overall trend: bear
Volume: Lowest monthly volume since Oct 2017
FIB’s: Selloff found support at 0.786 ($6,210) | Breaking down 0.618 ($6,327) is very significant | 1.618 extention is at $5,630
Candlestick analysis: Daily was a bit of a darth maul | Interested to see how we react from the 4h doji
Ichimoku Cloud: 1h cloud called the area of resistance on this last pump. Watch for price to close below the kumo at ~$6,300
TD’ Sequential: With monthly close the setup in continued with a r3 | Daily r5 | Weekly r4
Visible Range: Looking back to Feb 2018 (when this range started) and the POC is at $6,339 with the bottom of the highest volume node at $6,162.
Price action: 24h: +0.63% | 2w: -1.37% | 1m: -4.42%
Bollinger Bands: Daily MA at $6,364 has just starting angling up which is very interesting. Haven’t seen this angle up for weeks and that indicates that it is less likely to act as resistance
Trendline: Bear trend is at $6,500 | Bull trend line (phase 2 hyperwave) is at $6,195
Daily Trend: bull
Fractals: Busted two down fractals on last move, next one waits at $6,055
RSI: 4h resisted 50 | 1h no longer oversold and is pulling back from overbought territory
Stochastic: Daily buy signal | 4h entering overbought territory | 1h sell
Summary: Everything is still going according to plan. I was closely watching the monthly close today for a couple reasons. First of all I was really wanting the TD’ setup to continue with a red 3 as outlined in my most reason Bitcoin Bubble Comparison . The second reason was a close below $6,390 (Bitstamp) gave us the lowest monthly close since September 2017.
Now I am watching for resistance to hold strong below $6,385 over the next 24 - 48 hours. If that happens then I will be feeling confident in a $6,000 retest,. I still expect that area to provide one last dead cat bounce before the price breaks down the yearly support.
If you are not in a position then opening a short at $6,300 - $6,315 provides favorable risk:reward. A stop loss slightly above $6,400 makes a long of sense based on horizontal support and resistance along with the visible range volume profile.

VTC consolidating on Perfected Monthly 9 BITTREX:VTCBTC flashing perfected 9 Buy on Monthly timeframe per TD....also just happens to be consolidating very nicely near bottom range of a nice channel for 60+ days.
Check mark on chart was when it went 110%ish in <6 hours thanks to a small pump-group (this thing moves very fast both directions due to lower liquidity AND IS why it's been the target for pump groups and whales in the past).
Get in while the gettin is good lads.

BTC Bubble Comparison - Monthly ChartI believe that it is possible to beat the market through a consistent and unemotional approach. This is primarily achieved through preparing instead of reacting. Click here to learn more about how I use the indicators below and Click here to get my complete trading strategy! Please be advised that I swing trade and will often hold onto a position for > 1 month. What you do with your $ is your business, what I do with my $ is my business.
The monthly Stochastic and TD' Sequential are showing multiple similarities as 2014 - 2015. The last buy signal did a great job of calling the bottom and it also lined up with a monthly red 8. If that pattern continues then we should get a $2,880 bottom in February 2019 and then it should take 12 months to close back above $6,400. This lines up very nicely with the most recent Bitcoin' Bubble Comparison that I did on the 3D chart.

[QTUM/BTC] COULD BE A REAL SURPRISE [ 50-250% PROFIT]#QTUM / BTC ( Bittrex )
Buy Range : 0.00059-62
Stop Loss : Not recommend
Target 1 : 97425
Target 2 : 153132
Target 3 : 270262
WEEKLY CHART :
- RSI touched oversold zone and now its pushing high
- MACD is lossing bear momment and starting to show positive action
DAILY CHART :
- RSI touched very oversold zone and shares a bullish divergency
- Supported by EMA20
- Downtrend broken and new pattern spotted
- CCI turned into GREEN
- MACD continue climbing and sharing positive action
4 HOUR CHART :
- RSI looks overbought but it could extend positive mommentum
- MACD and CCI looking to do another leg up after small retracement
- RSI divergency visible on this timeframe too.
- EMA20/MA50 below candlesticks and MA200 is being testing right now.
- Big volume action on the last hours
- Ichi cloud broken and offerin support

Bitcoin Daily Update (day 234)I believe that it is possible to beat the market through a consistent and unemotional approach. This is primarily achieved through preparing instead of reacting. Click here to learn more about how I use the indicators below and Click here to get my complete trading strategy! Please be advised that I swing trade and will often hold onto a position for > 1 month. What you do with your $ is your business, what I do with my $ is my business.
My most recent Bitcoin Bubble Comparison - 3 Day Chart led to the following calls: < $5,750 by 11/15/2018 & my prediction for the bottom is $2,718 by 1/20/19 | | Calling for $35 ETH before the end of 2018. Previous analysis / position: “The current price is $6,408 and I expect that combination of support to provide a bounce to $6,428.” / Short USDT:USD from 0.968
Patterns: Descending triangle
Horizontal support and resistance: S: $6,394 | R: $6,415
BTCUSDSHORTS: Testing bottom of triangle
Funding Rates: Longs pay shorts 0.01%
Short term trend (4 day MA): Bear
Medium term trend (4 week MA): Bear
Long term trend ( 32 Week): Bear
Overall trend: All trends are in agreement, however short and medium are within a c hair of flipping
Volume: Just noticed that you can draw a trendline on the volume moving average. The trendline broke in the middle of September and that could have indicated the upcoming low volume chop.
FIB’s: 0.618 = $6,530 | 0.5 = $6,441 | 0.382 = $6,351
Candlestick analysis: Daily candles are as follows: shooting star, inverted dragonfly, hanging man. All indicate a reversal to the downside
Ichimoku Cloud: Most of the clouds are in agreement and indicate a bear trend (1h - 1w)
TD’ Sequential: Most time frame are flipping back and forth due to the chop. Weekly red 3 falls below red 2 at $6,132
Visible Range: Looking back to September 6th' (when this range started) point of control at $6,400 and two high volume nodes from $6,386 - $6,464
Price action: 24h: +0.005% | 2w: +4.01% | 1m: -4.47%
Bollinger Bands: Daily has closed below MA for 14 straight days
Trendline: 1h-4h charts are fitting into a bear trend and the top end is currently being challenged
Daily Trend: Chop
Fractals: Up: $6,792 | Down: $6,057
RSI: Stuck at 50 on most time frames
Stochastic: Starting to diverge from 4h buy signal while 1h is pulling back from a sell. Interesting how 3d stoch is bouncing/diverging while price goes nowhere
Summary: The price has fit into a trend (that can be seen on 1h and 4h charts) over the past 36 hours and the top end of that channel is currently being challenged. If this 4h candle closes above that trendline, which sits at $6,400, then I would expect a retest of the horizontal resistance at $6,445 - $6,464. If not then it should retest the bottom of the trend at $6,350.
I’m not sure how much less interesting this price action can get and I am afraid to ask. The gods of volatility are frowning on us all. What do we need to offer as sacrifice?
USDT, BCH, Ripple the Standard...take them all!!! Just please return the volatility that we have all become so addicted to. Both financially and emotionally. I’ve been to a fire ceremony, I have contributed poetry, I have danced for rain and still I wait. Waiting for the new higher high or lower low to spark the next wave of euphoria or despair.
Until then I will continue sacrificing, dancing and soul searching. No amount of TA can save us while Bitcoin' is stuck in a range of < $50!!!
I spent 2 hours with my spiritual guru/mentor this afternoon and she gifted me an essence that is meant for (among other things): being chronically tired from overwork and poor energy management. When lifestyle and work habits aren’t nourishing my physical body. Healing imprints of betrayal and bringing physical richness into our lives.
It may feel like Bitcoin' is betraying us with the lack of volatility but the bottom line is that she does not owe us anything. While it remains dormant I will focus on awakening my spirit and harnessing my 6th' sense to predict what the indicators cannot!!!


Bitcoin Daily Update (day 233)I believe that it is possible to beat the market through a consistent and unemotional approach. This is primarily achieved through preparing instead of reacting. Click here to learn more about how I use the indicators below and Click here to get my complete trading strategy! Please be advised that I swing trade and will often hold onto a position for > 1 month. What you do with your $ is your business, what I do with my $ is my business.
My most recent Bitcoin Bubble Comparison - 3 Day Chart led to the following calls: < $5,750 by 11/15/2018 & my prediction for the bottom is $2,718 by 1/20/19 | | Calling for $35 ETH before the end of 2018.
Previous analysis / position: Changed my call for the bottom from $2,860 by 10/31/18 to $2,718 by 1/20/19 / Short USDT:USD from 0.968
Patterns: Descending triangle
Horizontal support and resistance: S: $6,385 | R: $6,420
BTCUSDSHORTS: Finding support at 30 day MA, could form symmetrical triangle
Funding Rates: Longs pay shorts 0.01% (seems like a long time that longs have been paying)
Short term trend (4 day MA): Bullish for 3 candles, crossing below now
Medium term trend (4 week MA): Right on it, last candle closed below so it is bearish
Long term trend ( 32 Week): Bearish
Overall trend: Bearish but starting to turn up after everything was in agreeance a few days ago
Volume: Remain painfully low
FIB’s: 0.618 = $6,530 | 0.5 = $6,441 | 0.382 = $6,351
Candlestick analysis: Daily hanging man and shooting star
Ichimoku Cloud: 4h cloud holding as resistance | 1h is fully bearish
TD’ Sequential: Bounced from 4h TDST level | 12h R2 failed to close below R1 | D: G2 = G | 3D price flipping after R7 | W R3 = R2 = R1
Visible Range: Looking back to September 6th (when this range started) point of control at $6,400 and two high volume nodes from $6,386 - $6,464
Price action: 24h: +/ - 0 | 2w: -1.71% | 1m: -4.%%
Bollinger Bands: Continues to resist daily MA
Trendline: Top of descending triangle = $6,604
Daily Trend: Chop
Fractals: Up: $6,792 | Down: $6,057
RSI: Stuck at 50 on most time frames
Stochastic: 1h sell signal should be outmatched by 4h buy
Summary: 4h chart is bouncing from TDST level after at red 7. That is in confluence with the stochastic which just flashed a buy signal. The current price is $6,408 and I expect that combination of support to provide a bounce to $6,428.
I wish I was kidding, but this is what the market has come to. In all honestly it has become very frustrating to track and I have been spending the large majority of my time focusing on traditional markets.
However, I intend to stay engaged with the price action so that I don’t get left behind when the next move does happen. Believe me that it will. As the matter or fact the longer that we coil inside this triangle the more violent the following move is expected to be.
So do not let the market lull you to sleep and do the best to stay on your toes. If this was easy then everyone would do it. This is not easy and that is why we will deserve every penny that we earn when the volatility picks up. For now I will remain on the sidelines and plan on remaining there until/if $6,350 support breaks down. At that point I will look to re enter my short positions.

QTUM high likelihood bounce target Been riding this one long for few weeks now as weekly candles tightened into a rounding bottom.
Many higher time frames(monthly, weekly) signaling shaded rectangle as potential target for this BINANCE:QTUMBTC counter rally (SHOULD it be a fake alt-season... BINANCE:QTUMBTC will reject hard here and go on to make new All-Time lows).
Perfect world it comes on a weekly 9 (5.5 weeks from now) marked with flag on chart.
Will update more detail later

Bitcoin Daily Update (day 232)I believe that it is possible to beat the market through a consistent and unemotional approach. This is primarily achieved through preparing instead of reacting. Click here to learn more about how I use the indicators below and Click here to get my complete trading strategy! Please be advised that I swing trade and will often hold onto a position for > 1 month. What you do with your $ is your business, what I do with my $ is my business.
I recently posted Bitcoin Bubble Comparison - 3 Day Chart . It provided new dates and prices for the bottom, however it’s still slightly too early to abandon my predictions from the previous Bitcoin Bubble Comparison ]Bitcoin Bubble Comparison: 1 day - 5 days = < $5,750 | bottom prediction: $2,860 by 10/30 | | Calling for $35 ETH around the same time
Previous analysis / position: Left a comment on October 18th’s post saying that I wouldn’t be able to do the daily update and that I was watching the 4h TD Sequential and Stochastic. Still felt good about short positions due to $6,400 holding as strong resistance / Short BTC:USD from $6,367 | Short USDT:USD from $0.968
Patterns: Descending triangle / hyperwave
Horizontal support and resistance: S: $6,400 | R: $6,428
BTCUSDSHORTS: Appear to have created a lower high without re tested top of triangle
Funding Rates: Longs pay shorts 0.01%
Short term trend (4 day MA): Broke through 4 but now pulling back below. Wait to see where it closes before considering it bullish
Medium term trend (4 week MA): Bear
Long term trend ( 32 Week): Bear
Overall trend: Bear
Volume: Last few days have been well below MA
FIB’s: 0.618 = $6,530 | 0.5 = $6,441 | 0.382 = $6,351
Candlestick analysis: Bearish spinning tops, today forming bullish spinning top
Ichimoku Cloud: Fell out of 4h cloud, but still has not gotten kumo twist or bearish TK Cross. 1h cloud shows a lot of resistance from $6,400 - $6,480
TD’ Sequential: 4h: G3 | 12h price flip
Visible Range: Showing strong resistance from $6,400 - $6,800
Price action: 24h: +0.57% | 2w: -2.72% | 1m: +0.5%
Bollinger Bands: Continuing to resist daily MA
Trendline: Top of descending triangle = $6,670 | Phase 2 hyperwave = $6,000
Daily Trend: Chop
Fractals: Up: $6,792 | Down: $6,057
RSI: Hanging around 50 on all time frames
Stochastic: 4h starting to rally after calling a good buy. Daily is recrossing bearish after a double top
Summary: I entered based on the 12h red 2 below the red 1 in combination with the button top. Based on that entry I should be setting the stop loss above the 12h red 1 at ~$6,501. That is only 2% risk and there really isn’t reason to set it tighter than that.
After taking a number of losses I start to second guess my entries and stop losses. Sometimes I have an inclination to tighten the stops due to be afraid of losing and other times I have a tendency to really widen them due to being frustrating from getting whipsawed.
The last couple weeks have been a lot of the former. Instead of using the stop loss that the TD’ Sequential trading system outlines, I used an approach from Wyckoff.
He states something along the lines of: “When there is a breakout / breakdown of a trading range and the price quickly returns to the middle of the range then it was likely a fakeout”
I entered on the $6,400 breakdown and figured that a return to > $6,450 would indicate a fake breakdown which usually precedes a strong rally. So I set my stops at $6,451 on BTC’ and $204.2 for ETH. Fortunately the BTC’ stop didn’t trigger, unfortunately the ETH’ stop did and there was not the follow through that I was expected. As it stands now I was stopped out on the very top on a 1h wick (which was a green 9).
Trading successfully long term is much more about losing than it is about winning. Prolonged losing streaks will challenge your motivation, confidence, sanity, and finances. Risk management is only one piece of the puzzle. The other part is emotional control, and I could argue that is even more important.
You can tediously manage risk 99% of the time, but that won’t matter if you let your emotions get the best of you on the other 1%.
I have found two very important ways to help control my emotions after taking a string of losses. First I shut off the computer and take a day off. I go outside, socialize and gain some perspective. Then I come back re charged and ready to get back in the trenches.
Another thing that really helps is not adding to losing positions. It can be very tempting to add at a better price when a position moves against you. Controlling that urge will help to minimize losses and maximize wins. Furthermore it will cause less stress/anxiety when things are going your way.
Set the stop loss then forget about it!
In regards to my USDT:USD position, I feel comfortable holding onto that as long as BTC’ is rallying. If it starts dumping then I will look to exit that position.
I went to a bbq last night and today I am playing in a golf tournament. By this time tomorrow I expect to feel fully reinvigorated.

Bitcoin Daily Update (day 231)I recently posted Bitcoin Bubble Comparison - 3 Day Chart . It provided new dates and prices for the bottom, however it’s still slightly too early to abandon my predictions from the previous Bitcoin Bubble Comparison ]Bitcoin Bubble Comparison: 1 day - 5 days = < $5,750 | bottom prediction: $2,860 by 10/30 | | Calling for $35 ETH around the same time
Previous analysis / position: Closely watching trend and horizontal resistance on USDT:USD’ and wanting to see it stabilize before re entering shorts / Short USDT:USD at 0.968 | Short ETH:USD from $198.58 and short BTC' from $6,367
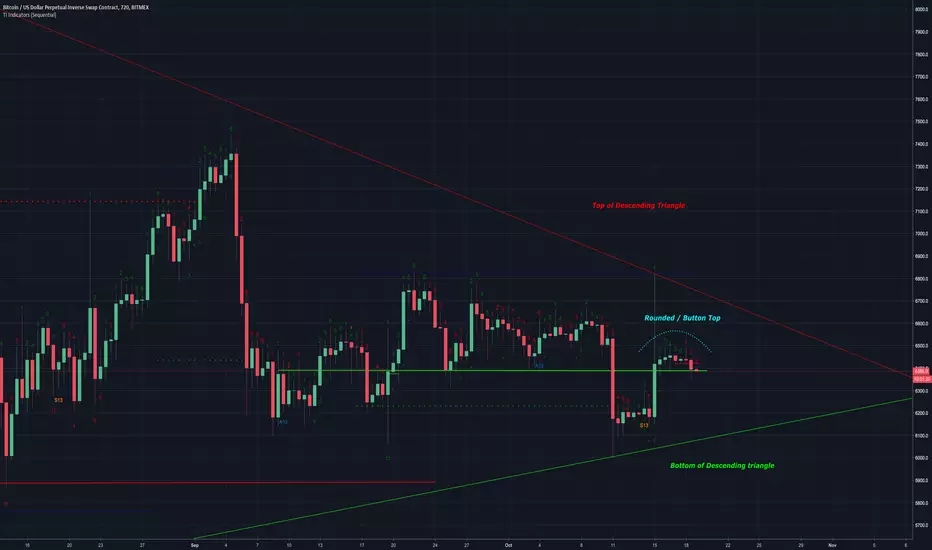
Patterns: Descending triangle | 12h rounded top / button top
Horizontal support and resistance: S: $6,355 | R: $6,400`
BTCUSDSHORTS: Approaching top of triangle
Funding Rates: longs pay shorts 0.01%
Short term trend (4 day MA): Closed below and starting to resist - bear
Medium term trend (4 week MA): Closed below and starting to resist - bear
Long term trend ( 32 Week): Angling down with price below - bear
Overall trend: When all three trends line up it’s time to look for a position
Volume: When volume?
FIB’s: 0.618 = $6,530 | 0.5 = $6,441 | 0.382 = $6,351
Candlestick analysis: Today closed a bearish spinning top
Ichimoku Cloud: “Best entries occur when all the metrics flip at the same time” Watch 4h cloud. It is threatening a bearish TK’ cross and a bearish kumo twist. Bottom of cloud = 6,300.
TD’ Sequential: Weekly R2 falls below R1 at $6,039 on weekly. 1D is price flipping | 12h red 2 closed below a red 1. Red 3 is currently an inside bar.
Visible Range: Gap in volume from $6,242 - $6,349 with one month look back
Price action: 12h: -0.65% | 24h: -0.66% | 2w: -2.36% | 1m: +1.04%
Bollinger Bands: Resisting below daily and weekly MA, watching for it to fall below 12h MA
Trendline: Bottom of descending triangle = $6,100 | Top of triangle = $6,700
Daily Trend: Bearish
Fractals: Up: $6,792 | Down: $6,057
RSI: Hanging around 50 on most time frames
Stochastic: Making bearish re cross on daily with double top | 3d: bullish | W: Bearish
Possible Entries: I really like to build a position when all of the trends (short / medium / long) are moving in the same direction and after today’s close they are all bearish as far as I am concerned.
I also really like to see my major indicators in aggreeance. That is what we are getting today with the moving averages, TD’ Sequential, Ichimoku Clouds, Bollinger Bands and daily Stochastic.
It has been months since I have seen this much confluence in my daily process with these indicators.
Furthermore, USDT:USD' has broken through the downtrend that had me worried and I will likely close that short position out on the next test of support.
Possible Entries: Weekly red 2 falls below the red 1 at $6,039 on weekly | 12h red 2 closed below a red 1 | Daily is price flipping, keep an eye out for a red 2 below today | 4h Ichimoku cloud is threatening a bearish TK’ cross and a bearish kumo twist. Bottom of cloud = 6,300 | There is also a gap in volume below $6,349 with 1 month look back (good place to set stop order)
It can be hard not to get over excited and smash the market sell / short button when all of the indicators would suggest that is a good idea. Take a deep breath and write down your plan. What is your: time horizon, profit target, maximum desired exposure, and where will your stop loss be?
Take the maximum desired position size and divide it by 3. Enter that portion today and then wait until tomorrow to add. That is what I am doing. This will minimize losses when the position moves against you and still leave you with plenty of time to get fully positioned.
This next move is going to be big, you can afford to be as careful as possible when building your position.
Good luck!
BTCUSD daily chartHello guys,
Just a quick update to analise de TD sequential on the daily. We are having a green 13 on the countdown. Notice what happened in the last two 13's.
Best regards,
Alexandre Simões

Bitcoin Daily Update (day 227)I believe that it is possible to beat the market through a consistent and unemotional approach. This is primarily achieved through preparing instead of reacting. Click here to learn more about how I use the indicators below and Click here to get my complete trading strategy! Please be advised that I swing trade and will often hold onto a position for > 1 month. What you do with your $ is your business, what I do with my $ is my business.
My most recent Bitcoin Bubble Comparison led to the following predictions: 1 day - 14 days = < $5,750 | bottom prediction: $2,860 by 10/30
Previous analysis / position: Outlined entries at $6,239 and as well as $6,400 - $6,500 / Short BTC' at $6,330.50 | Stop order triggered on ETH while typing this at $192.70
Patterns: Descending triangle | phase 2 hyperwave
Horizontal support and resistance: (Bitmex) S: $6,150 is being tested | R: $6,300 held strong
BTCUSDSHORTS: Currently testing the upper end of the triangle that I pointed out yesterday . Really starting to think we are going to see record highs.
Funding Rates: Longs pay shorts 0.01%
12 & 26 EMA’s (calculate % difference): Did test 12 EMA on some exchanges. On Bitmex it is - 2.96% | 26: -4.42%
50 & 128 MA’s: 50: -6.15% | 128: -7.74%
Volume: Mild volume on the weekly, but it did make the first higher high since August
FIB’s: 0.886 = $6,169 | 1 = $6,104 | 1.618 = $5,750
Candlestick analysis: Nasty shooting star on the daily candle
Ichimoku Cloud: Currently falling out of thick 1h cloud. Will be watching to see if it closes.
TD’ Sequential: Watching for weekly red 2 falling below red 1 to be in line with descending triangle breakdown and phase 2 of the hyperwave
Visible Range: Has fallen back below point of control and highest volume node
BTC’ Price Spreadsheet: 12h: -0.75% | 24h: -0.37% | 1w: -6.04% | 2w: -5.99% | 1m: -4.82%
Bollinger Bands: Sticking to bottom band, shooting star tells me it is unlikely to return to MA. Weekly resisted MA and should re test bottom band which is below triangle and hyperwave
Trendline: Phase 2 hyperwave = $5,950
Daily Trend: Choppy, starting to roll over
Fractals: Weekly down = $6,098 | Weeky up = $7,435
On Balance Volume: Weekly broke down support and created a lower low
RSI (14 setting): Weekly has broken down from descending triangle and has created a lower low. | D: 35.48 and turning over
Stoch: Daily is trending down nicely. Making bullish cross now, expect another lower high
Summary: The last two entries outlined were stop orders to short at $6,389 and $6,239. Both have been triggered and are into the profit. My stop loss is currently set at $6,330. The market is starting to show serious signs of life and I am expecting a big move in this next week. During time likes these it is very important to be proactive and decisive when the moment of decision comes.
Writing down my plan has helped tremendously with that. When volume and volatility pick up and my heart starts beating faster I can simply take a couple deep breaths and refer to my gameplan.
I currently have a nice short open on BTC’ and I am focusing on building on position on ETH:USD. It’s weekly chart looks like it is ready to take another dive and I am looking at a $35 target based on the visible range volume profile and hyperwave theory - return to phase 1 is expected after breaking down phase 2.
If I have time I will post a chart with my full gameplan.
Here is my plan for BTC':
Watch for $6,000 breakdown which will be a weekly red 2 below a red 1
Then expect a small bounce from $5,850 - $5,900 area
If bounce resists $6,000 - $6,150 then add to position
If bounce breaks through $6,300 then cover
If we rally from here then watch for price to re explore wick from today’s shooting star and find resistance below $6,300.

Bitcoin Daily Update (day 225)I believe that it is possible to beat the market through a consistent and unemotional approach. This is primarily achieved through preparing instead of reacting. Click here to learn more about how I use the indicators below and Click here to get my complete trading strategy! Please be advised that I swing trade and will often hold onto a position for > 1 month. What you do with your $ is your business, what I do with my $ is my business.
My most recent Bitcoin Bubble Comparison led to the following predictions: 1 day - 14 days = < $5,750 | bottom prediction: $2,860 by 10/30
Previous analysis / position: “I do expect a small bounce off the first test of the phase 2 hyperwave trendline. A return to $6,400 to test that area for resistance is the most logical result” / Short BTC from $6,330.50 | Short ETH:USD from $197.02
Patterns: Descending triangle | Phase 2 hyperwave
Horizontal support and resistance: $6,200 was support and is currently being tested for resistance | S: $6,250 - $6,178
BTCUSDSHORTS: Massive triangle starting to form. If daily candle closes above 39,750 then the target is 60,959.
Funding Rates: Longs pay shorts 0.01%
12 & 26 EMA’s (calculate % difference): 12: -3.24% | 26: -4.46%
50 & 128 MA’s: 50: -6.09% | 128: -7.61%
Volume: Last sell off had largest volume on the 1h chart since April 12th and that was the day that set the record for most spot BTC purchased. That indicates to me that some big buyers are getting scared / starting to exit.
FIB’s: Testing 100 level. 1.618 = $3,663 when using May 5 high
Candlestick analysis: 1 day bullish spinning top
Ichimoku Cloud: Kijun-Sen at $6,476 (daily) should act as resistance. 10 minute cloud has actually been very helpful over the past day or so. Was strong support at $6,239 that is thinning and we just got a bearish kumo twist.
TD’ Sequential: 4h R2 currently = R1 if that falls below then I think it would be a pretty good entry.
Visible Range (1 month lookback): High volume nodes from $6,383 - $6,590 should be strong resistance
BTC’ Price Spreadsheet: 12h: +/- 0 | 24h: +8.04% | 1w: -4.75% | 2w: -5.28% | 1m: -0.82%
Bollinger Bands: Last candle failed to return to the band. I expect to see a bulge very soon (as does everyone paying attention)
Trendline: Phase 2 hyperwave and bottom of descending triangle = $5,900. A close below that price would almost certainly lead to the bulge.
Daily Trend: Chop
Fractals: Down: $6,100 | Up: $6,712 (5 in that area) I do not expect up fractal from September 14th to be violated at $6,589
On Balance Volume: Has broken down it’s descending triangle
ADX: Finally bouncing after creating 4 year low
RSI (14 setting): W: 44 | D: 38.26 | 4h: 34.82 and testing down trend | 1h: 46 after resisting 50 just formed lower low and looking like it will create a second lower high (in line with price)
Stoch: %K starting to enter oversold territory on daily and 3d. Weekly still has room to go. 4h making bearish re cross under 25.
Summary: When the higher time frame Bollinger Bands get a super squeeze it will often be followed by a shakeout before the real trend starts. That is something I have been very cognizant of over the last couple weeks and I no longer think that this selloff could be a fakeout.
The reason being is how much time we have spent below $6,400 support. Shakeouts will usually be violate/fast and the rebound will be even more so. The price will not tend to spend much time below prior support and that will trap in the breakout traders who were waiting with stop orders.
I also think that the chances of a bounce to $6,400 are decreasing. In the Wyckoff distribution preliminary support will eventually breakdown and becoming resistance. Therefore I think a selloff to $5,900 and then a bounce back to $6,175 is the most likely outcome. From there I would expect the selling climax to follow.
$6,250 - $6,275 is the number to be watching. If not in a position then a stop order at $6,149 should be a good option. That would also be in line with the red 2 trading below the red 1 on the 4 hour chart if it were to occur in the next 2 hours.
That being said there is still a very decent chance that we bounce from here and retest $6,400 - $6,500. If that happens then be prepared to enter a short. I believe that would be the most favorable entry in terms of risk:reward. $6,651 should be a safe area to set the stop loss with all of those up fractals lining up.
Keep in mind that there is a significant premium on USDT exchanges (currently 1.21%). The prices above are an average of both and would need to be adjusted for your exchange accordingly.

USDCHF / TD Sequential / Bearish ChartUSDCHF is nearing the first pivot point resistance level at 0.99350 and will reach the 9th TD candle on the daily, indicating an impulse down, at least to the previous support level created by the June - July '18 bottoms. Major resistance at 0.236 Fib retracement level. Entered at 0.99303, stop loss at 0.99554, target price 0.98580.

Bitcoin Daily Update (day 223)I believe that it is possible to beat the market through a consistent and unemotional approach. This is primarily achieved through preparing instead of reacting. Click here to learn more about how I use the indicators below and Click here to get my complete trading strategy! Please be advised that I swing trade and will often hold onto a position for > 1 month. What you do with your $ is your business, what I do with my $ is my business.
My most recent Bitcoin Bubble Comparison led to the following predictions: 1 day - 14 days = < $5,750 | bottom prediction: $2,860 by 10/30
Previous analysis / position: “I have an order set at $6,389 to open a short if/when the price falls below $6,400 support. Until then we wait.” / No trade zone = $6,400 - $6,700
Patterns: Descending triangle
Horizontal support and resistance: R: $6,655 | S: $6,524
BTCUSDSHORTS: Starting to trend up and challenging the 50 MA right now.
Funding Rates: Longs pays shorts 0.0342%
12 & 26 EMA’s (calculate % difference): Have made a bullish crossover but failed to support price. Will be interesting to see if we close above those EMA’s.
50 & 128 MA’s: 50 starting to act as clean resistance | 128: -2.32%
Volume: Last couple days have started to pick back up after dip on the 6th' and 7th.
FIB’s: 0.618 = $6,600 | 0.5 = $6,759 | 0.382 = $6,918
Candlestick analysis: Daily hanging man forming. Weekly dojis. Pulling back from 12h shooting star.
Ichimoku Cloud: Price is being squeezed in between Kijun-Sen and Tenken-Sen on daily. Fell out of 12h cloud and now it is becoming resistance. 4h cloud is bullish but appears to have an upcoming kumo twist.
TD’ Sequential: Bouncing off a 4h & 1h R9. 12h has R2 = R1. Daily G6.
Visible Range: Gap in volume from $6,800 - $7,250 is primed for a bull trap. Gap in volume at $5,000 is begging to get filled.
BTC’ Price Spreadsheet: 12h: +0.87% | 24h: -0.52% | 1w: +1.57% | 2w: -1.33% | 1m: +5.75%
Bollinger Bands: Got closed to testing bottom daily band. Will be interested to see if we close below the MA.
Trendline: Drawn on chart. Current bounce came almost perfectly off the green trendline that I pointed out as the key area of support in yesterday’s post.
Daily Trend: Chop that is favoring the bears.
Fractals: New fractal printed yesterday at $6,516 and was almost immediately violated. A close below that number should cause bearish momentum to increase.
On Balance Volume: Trending down after breaking down from it’s triangle.
ADX: Continues to make new lows.
Chaikin Money Flow: Trying to breakthrough 0.2 with c&h type pattern. I don’t think it will happen.
RSI (14 setting): Broke up from triangle and supported retest, however now it appears to be turning over. Watching for new low on daily chart below 49.95.
Stoch: Making bearish recross and forming lower high
Summary: Watch for resistance under $6,650 where horizontal resistance meets the trendline. If bulls breakthrough that area then we should retest the top of the descending triangle for the first time since July.
Also watch for a new low on the 4 hour chart (below $6,480). If breaks breakdown that area of support then I expect the selling momentum to increase significantly. I still have an order set to short at $6,389 and I would move that up to $6,474 if that wasn’t in my no trade zone.
The market feels like it is ready to make a significant move more than ever before (in my experience). I remain confident that it will be to the downside. The main reason that I do not believe this is the bottom is because every on Twitter and Reddit thinks that this is the bottom. Overwhelming exuberance on social media is exactly what I like to counter trade. Maybe they are all right and I am wrong, only time will tell.
Tether (USDT') is showing some signs of cracking. The premium between USD and USDT' exchanges is at a 9 month high.
USD Exchanges | Coinbase: $6,541 | Bitstamp: $6,539 | Gemini: $6,538 | Kraken: $6,540 | Average: $6,539.50
USDT' Exchanges | Binance: $6,638 | Poloniex: $6,638 | Bitfinex: $6,638 | Average: $6,638 | Premium = 1.51%
On Kraken the USDT:USD pair is down 1.55% in the last month and looks like it has much further to go.
That chart has me seriously considering shorting Tether', however I don’t want to have my funds tied up for when BTC' makes it’s move. If you have money on the sidelines then I would be very careful about holding it in USDT or another ‘stable coin’.
I have personally spread out my funds across three exchanges and would recommend the same.

Bitcoin daily chart analysis Hello,
The 128 day MA has been resistance since mid september and is now coinciding with the base of the "small" ascending triangle.
It BTC breaks this point, it might have a breakout until the 200 day MA, wich coincides with the expected triangle breakout increase.
On the TD sequential, a green 4 went above a green 3, indicating the top of the green 3 candle as the entry point to a trade. If it makes the breakout we will likely go to a green 9, completing the setup fase.
In this scenario I think that the 200 day MA will act as a heavy resistence, the RSI will also probably be overbought or close to it and the green 9 would indicate an exit from the trade.
After that we would have to see if it would fall inside the "big" triangle again or if the diagonal line would act as support.
Best regards,
Alexandre Simões

XRP/USD - WILL WE BE RICH?XRP broke out of the descending wedge pattern, ran up to the .236 Fib level and pulled back to retest previous resistance as support. However it did so on very low volume, so the breakout was extremely unimpressive nor vitally important.
If we maintain this level however, we have still formed a higher low, so I've plotted a potential new ascending trend line. We'll see if this holds and what larger dominant pattern emerges from here.
XRP is one of the most exciting assets to trade right now, more so than Bitcoin or ETH potentially. In my eyes, the dominant narrative is this: Bitcoin is destined to win, so if you're a believer then you're bullish bias is overpowering and you're safe to go long from almost anywhere as long as your time horizon is long enough. Ethereum is doomed to failure, so you're fairly safe to short from any level as long as your time horizon is long enough. However Ripple, with all it's potential banking implications and far-reaching network of influence and potential, is one coin that could make us kings or beggars. There's so much disagreement on it fundamentally, that it makes it a fascinating crypto to speculate on. We'll be watching this one extremely closely.
This chart is still neutral, leaning bearish. I say this because of the following:
DMI is still bearish, with a rise in the strength of the trend. Kumo cloud turning to the downside. Stochastic descending from overbought level, RSI potentially moving down through the 50% level.
There are bullish aspects to this chart. There does seem to be a turn in the DI-, RSI might hold the 50% level, there does appear to be a potential double bottom formation, and recent price action as far as volume is slightly more bullish than bearish. Eyes glued to the charts people, eyes glued.

ETH/USD - NEW PATTERN CONFIRMED!The symmetrical triangle pattern is holding. We've had to readjust it several times over the past week to maintain it's levels, however it hasn't made a break that would cause us to question the current range.
As I've stated above, range-bound assets are difficult to trade. Easy to scalp, difficult to trade if you're time frame is longer then a few hours.
Bullish and bearish momentum are battling much more aggressively here on ETH than on BTC, we can look at DMI to confirm that. They keep swapping positions to the dominant. Unfortunately, ADX keeps trailing lower and lower which confirms our lowered volatility. Low volatility is a good place on an asset to enter, however you have to take your bias into account either bullish or bearish. If you're correct in your assumption, then you got in at the best possible price. If you're wrong then price goes against you and it generally goes fairly quickly from low to high volatility.
Everyone's excitement is growing the longer the charts remain boring, as paradoxical as that may sound. As volatility decreases, experienced traders know what follows, which is often quite violent, ie. profitable.
Neutral chart, however it won't be that way for every long.

BITCOIN/USD - DESCENDING WEDGE HOLDS!The descending wedge pattern is still holding. If you had set buy orders at the bottom trend line, merely extending the trend line from the last support into the future, you would be a very happy turtle right now.
Bullish volume is still struggling to push the price upwards, and at the current moment volume is falling off. This is indicative of a lack of faith in Bitcon's bullish movement at this moment in time. Anything can change, but that is the state of volume at the moment. The overall trend is still bearish, and recent price action confirms this both via candlesticks and volume.
The bearish engulfing candle that we see plotted three bars back is quite important, the amount of volume that candle was able to command relative to recent price action lets us know there are plenty of sellers in the market who are still quite hot to trot to sell and short their positions. The bulls did step in as predicted at the opportune time, however as we've discussed ad nauseum important levels only tell us WHERE the bulls might step in (vica versa with the bears). It doesn't tell us whether or not they will be successful. We need volume to confirm movements. Right now, volume is not confirming this bullish movement.
You can see that the area where price found support was not only the ascending trend line, forming still a pattern of higher lows, but it was also a few satoshis short of the 0.236 Fibonacci retracement on the current descending wedge pattern from true high to true low. These are important levels for you to find on your chart when you're plotting out your plan of action. Numbers matter, and observation is required to see how successful a movement is going to be.
Our smoothed Stochastic is signaling that Bitcoin is oversold, and our RSI shows no divergence at the moment.
DMI is still negative, indicating that bearish momentum is still more powerful than bullish momentum, and volume confirms this.
Price also seems to be stalling out, forming a gravestone doji that reversed at the next Fib level, the .382.
If you're predicting a pullback from here, a Fib measurement puts out .618 entry position at 6473.91. Possible scalping targets to the upside could be 6500 and 6550. However the risk to reward ratio here is not worth it, in my opinion. Don't feel the need to trade, I would like to see more bullish volume to come in, and then you could feel more confident taking a long position all the way to the upside of this descending wedge pattern and then re-evaluating.
I will say that we also completed our TD Countdown, with a perfected 13 count which per TD Strategy gives us a buying option. Something to keep in mind.
Bullish factors - bottom of current trend line, completed 13 countdown, oversold stochastic, reversing RSI.
Bearish factors - dominant trend, DMI bearish w/ weak trend, volume, candlesticks.
