99% of people buying $NVDA don't understand this:🚨99% of people buying NASDAQ:NVDA don't understand this:
NASDAQ:GOOGL : “We’re boosting AI capex by $10B.”
Wall Street: “Cool, that’s like $1B or 0.06 per share for $NVDA.”
So from $170.50 at the time of news to $170.56 right?
No.
NASDAQ:NVDA trades at 98× earnings. So that $0.06? Turns into $6.00
Why?
Because people are expecting that to be happening every single year for 98 years and they're paying All of it Today in Full amount.
So NASDAQ:NVDA will get $1B more per year. But NASDAQ:NVDA price per share already increased by $100B in past 2 days 😂
Then it crashes 40% and everyone is wondering why.
TECH

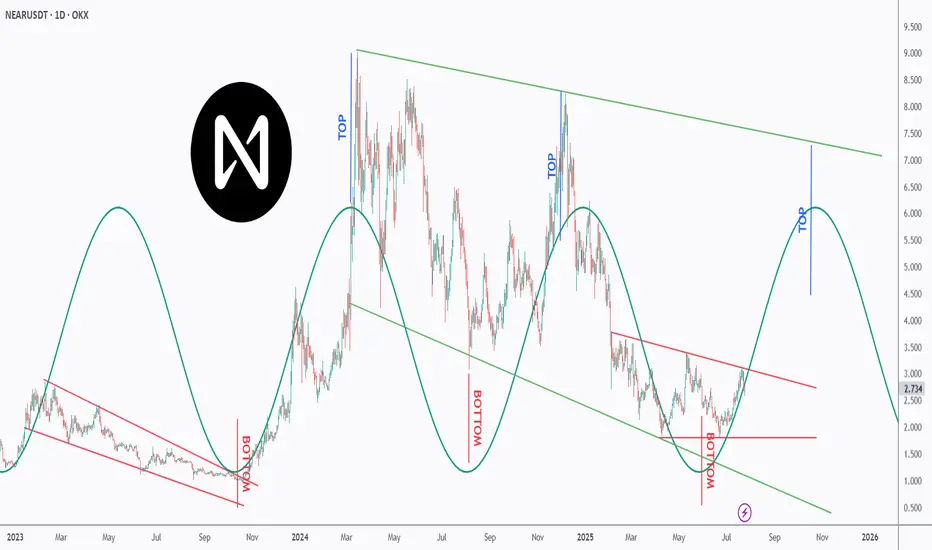
Is NEAR NEARing Its Next Explosion? Watch This Perfect Pattern!NEAR is dancing to a powerful rhythm — and it’s all in the cycles 🔁
This chart uncovers a repeating top-bottom cycle that has held since early 2023, with precise peaks and valleys emerging every few months 📉📈.
After bouncing off a major bottom at ~$2, NEAR is now approaching the mid-line of the descending red channel, suggesting a potential trend reversal is underway 🔄.
Each previous “BOTTOM” aligned with strong recovery waves 🚀, while the projected “TOP” now points toward the $6–7 zone — aligning perfectly with the upper green trendline resistance 🎯.
If the pattern continues, we could be looking at another macro push before year-end 2025 📆.
📊 Will NEAR ride this wave to new local highs — or is it just another lower high in the making? Either way, the rhythm of this chart is too clean to ignore.
📚 Always follow your trading plan regarding entry, risk management, and trade management.
Good luck!
All Strategies Are Good; If Managed Properly!
~Richard Nasr
ARKK: when a breakout isn’t just a breakout-it’s a runway to $91On the weekly chart, ARKK has broken out of a long-standing ascending channel, ending a year-long consolidation phase. The breakout above $71.40, with a confident close and rising volume, signals a transition from accumulation to expansion. The move came right after a golden cross (MA50 crossing MA200), further confirming institutional interest. Price has already cleared the 0.5 and 0.618 Fibonacci retracements — and the 1.618 extension points to $91.40 as the next technical target.
Momentum indicators like MACD and stochastic remain bullish with room to run. Volume profile shows low supply above $75, which could fuel an acceleration toward the target zone.
Fundamentally, ARKK remains a high-beta, high-risk vehicle — but one with focus. The ETF is positioned around next-gen tech: AI, robotics, biotech, and automation. Assets under management now exceed $9.3B with +$1.1B net inflow in 2025. YTD return stands at 37%, and its top holdings (TSLA, NVDA, COIN) are back in favor. This isn’t just a bet on innovation — it’s diversified exposure to a full-blown tech rally.
Tactical setup:
— Entry: market $69.50 or on retest
— Target: $80.21 (1.272), $91.40 (1.618 Fibo)
Sometimes a breakout is just technical. But when there’s volume, a golden cross, and billions backing it — it’s a signal to buckle up.

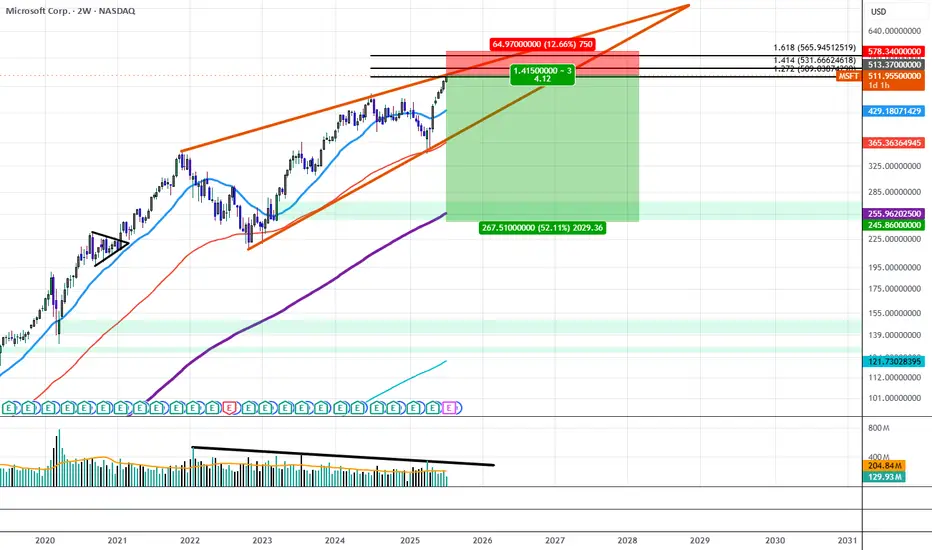
Microsoft Sees Declining Trading Volume Despite All Time HighsSince December of 2021, MSFT traded within a Rising Wedge structure that has gradually resulted in lower and lower highs in volume, at the same time IV on the Options Chain has begun to price down the strikes above $515 while Shorter Term Downside IV has begun to price up all the way out to $240.00. If this trend continues we will likely see the $515 area act as strong resistance as liquid interest above it begins to dry out.
This could be the beginning of a move to break down the wedge and trade down to the lower strikes first targeting the $365 price level and resolving around $240 near the 200 Period SMA.
How expensive is Nvidia today?How expensive is NASDAQ:NVDA today?
❗ You're paying $40 today for $1 of next year's earnings
That's what Nvidia's forward P/E 40x means at current $172 per share
AI might be the future but you're prepaying for it like it's 2060 🤖

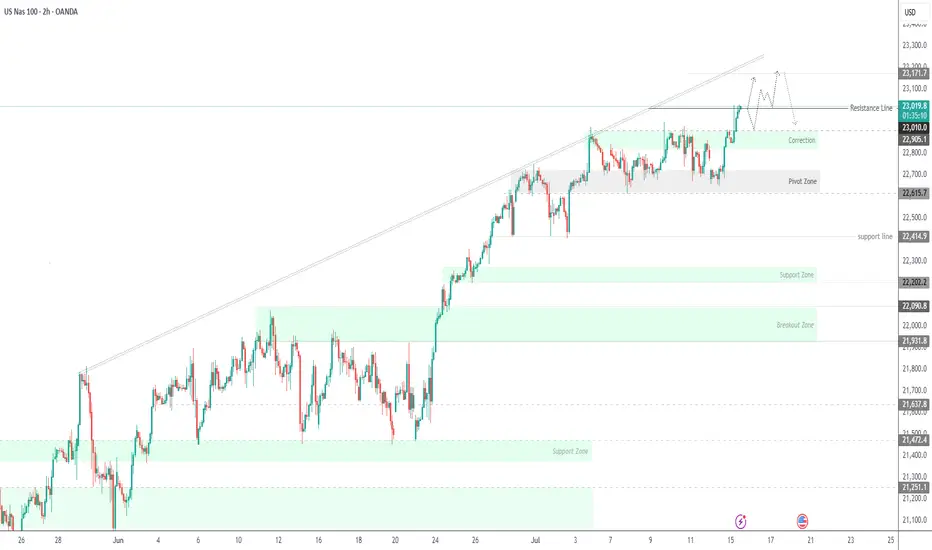
USNAS100 Outlook – CPI Data to Confirm Breakout or PullbackUSNAS100 – Bullish Momentum Holds Ahead of CPI
USNAS100 continues to show strong bullish momentum, trading above 22,905 and recently printing a new all-time high (ATH).
As long as price remains above this level, the next upside target is 23,170, followed by 23,300.
Market Focus – CPI Data Today:
• Expected: 2.6%
• Below 2.6% → bullish reaction likely
• Above 2.6% → bearish pressure expected
• Exactly 2.6% → could trigger a short-term bearish pullback
Key Risk Level:
A confirmed break below 22,905 would signal weakness and open the door for a correction toward 22,615.
NASDAQ at Risk – Tariffs Pressure Tech IndexUSNAS100 – Market Outlook
The index is currently in a sensitive zone, heavily influenced by ongoing tariff tensions. If the current geopolitical pressure continues, it may fuel bearish momentum across the tech-heavy index.
To regain a bullish outlook, we need to see signs of negotiation or de-escalation, which could stabilize the price and lead it toward 23010 and 23170.
However, as of today, the market appears to be setting up for a correction, potentially dipping to 22815, followed by a deeper bearish move targeting 22420.
Support Levels: 22615 – 22420
Resistance Levels: 22905 – 23010

SelectQuote | SLQT | Long at $2.18SelectQuote NYSE:SLQT is currently resting within my historical simple moving average zone. This often signals consolidation and a future move (in this case, let's hope up). Looking at the company's financials, NYSE:SLQT is currently profitable. For Q3 2025 (ended March 31, 2025), the company reported a net income of $26.0 million, up from $8.6 million in Q3 2024. This follows a strong Q2 2025 with a net income of $53.2 million. While like most companies there are likely headwinds in 2025 (earnings are projected at a loss of -$0.20 per share due to seasonal fluctuations and investments in 2025 (e.g., new Kansas facility)), profitability is likely to stabilize in 2026, with EPS forecasts of $0.05, supported by improved Medicare reimbursement rates and operational efficiencies. Ongoing Department of Justice allegations could pose risks... but SelectQuote’s recent $350M investment and cost management suggest profitability may continue if legal issues are resolved favorably.
Thus, at $2.18, NYSE:SLQT is in a personal buy zone. There is a potential for the price to dip to the bottom of the historical simple moving average channel (near $1.25) in the near-term, but time will tell.
Targets:
$2.64
$4.24

USNAS100 Bullish Ahead of NVIDIA Milestone – 23010 in SightUSNAS100 – Outlook
The index continues its bullish momentum, supported by strong tech performance — notably NVIDIA surpassing a $4 trillion market cap.
As long as the price holds above 22880, the trend remains bullish toward:
23010 Then extended targets near 23170
However, a 1H close below 22815 would signal weakness, potentially opening the way for a retracement toward: 22705 And 22615, especially if tariff tensions escalate.
Resistance: 23010, 23170
Support: 22815, 22705, 22615

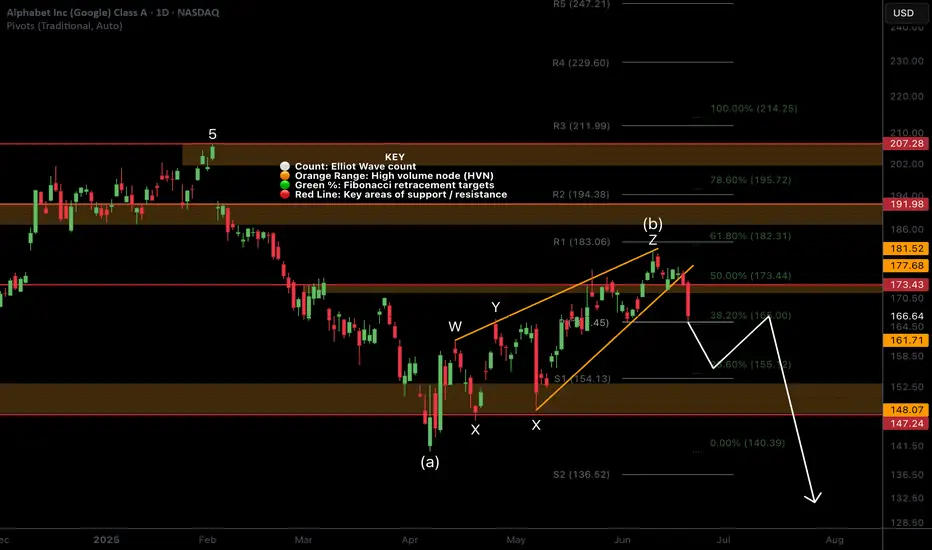
GOOGLE Count changed, Bullish outlook.I have adjusted NASDAQ:GOOG NASDAQ:GOOGL Elliot wave count with a wave 1 completing a leading diagonal backed up by a deep wave 2 correction into High Volume Node support (HVN). We potentially have another 1-2 with fast drop and recovery to the S1 daily pivot which would make long term outlook extra bullish by extending target.
Wave 3 is underway with a target of the all time hime high HVN for wave 5. The next resistance HVN is $191.
Price above the daily pivot and is continuing upwards after testing as support.
Analysis is invalidated below $162 swing low.
Safe trading

USNAS100 Key Level: 22,740 – Will the Trend Continue or Reverse?USNAS100 Update – Bullish Momentum Holds Above 22,740
USNAS100 has continued to push higher, following through as expected from yesterday’s analysis.
The index maintains bullish momentum as long as it trades above the key pivot at 22,740.
However, a 1H close below 22,730 could trigger a bearish correction toward 22,615.
A sustained break below that level may shift the trend to bearish.
Key Levels:
• Resistance: 22,870 / 23,000
• Support: 22,615 / 22,410

NVIDIA to $228If Nvidia were truly done for, why is it impossible to find their latest 5000 series GPUs?
Even if someone wanted to buy one, they simply can't.
The reason lies in Nvidia's commitment to fulfilling the soaring demand from AI data centers, which has left them unable to produce enough H100 and H200 models.
This situation also allows Nvidia to increase their profit margins significantly, capitalizing on the disparity between demand and the media frenzy surrounding them.
DeepSeek serves as a prime example of how out of touch mainstream media can be.
All DeepSeek did was replicate Chat GPT.
Training models requires substantial computing power. The panic surrounding Nvidia and other semiconductor companies is quite amusing; the demand for computing power is skyrocketing!
The gap between the reality of the AI mega-trend and the narrow focus of mainstream media is staggering! It's astonishingly out of touch! Just as out of touch as Cramer was when he declared META was done at $100, or when he thought Chat GPT would obliterate Google at $88.
Stock prices fluctuate between being overvalued and undervalued. While we have metrics like EGF and PE ratios to assess valuation, indicating that Nvidia is currently inexpensive, this doesn't guarantee it won't drop further. However, it is generally wiser to buy stocks when they are cheap rather than when they are costly.
The greater the deviation from the high then the greater the BUYING OPPORTUNITY being presented for the very best leading companies.
The key takeaway is that the deeper Nvidia falls during its corrections, the more advantageous it could be.
Those who are experiencing anxiety during these declines may find themselves selling at a loss, or for a marginal profit possibly around previous highs, while the stock has the potential to rise to $228 and beyond.
The potential for growth is significant; the $228 Fibonacci extension may not represent the peak. Attempting to predict a top for Nvidia could be misguided. Once it reaches $228, Nvidia might maintain a valuation similar to its current $130 level.

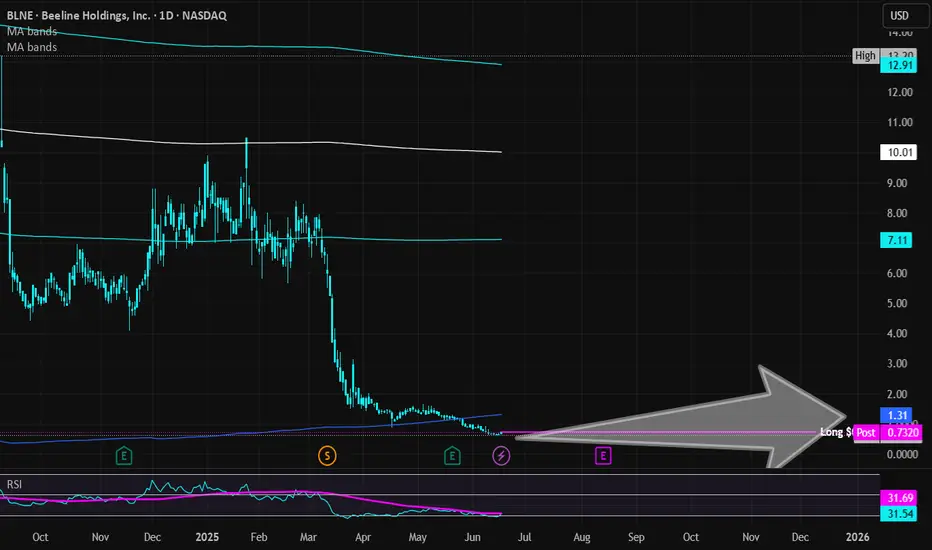
Beeline Holdings | BLNE | Long at $0.72**This is a VERY risky penny stock. Please do not invest if you are risk averse.**
Beeline Holdings NASDAQ:BLNE
Book value = $5.00-$6.00
Revenue past 12 months: $5.21 million (grew by 27.4% over the past year)
Debt-to-equity: 0.21x (low)
Insiders purchased almost $500k in shares in the past 6 months and volume increasing
6 million float, 1.96% short interest, 0.85 days to cover
This is purely a gamble play based on value and insider purchases. Thus, at $0.72, NASDAQ:BLNE is in a personal buy zone.
Targets:
$1.00
$1.25
Google MUST hold this critical level!NASDAQ:GOOG local analysis update
📈 𝙇𝙤𝙣𝙜 𝙩𝙚𝙧𝙢 Further decline below the daily 200EMA, High Volume Node (HVN) and pivot point which it closed below on Friday could see google price fall back below $140.
📉 𝙎𝙝𝙤𝙧𝙩 𝙩𝙚𝙧𝙢 the bullish run has ended with Fridays bearish engulfing, first support below the support it is currently sat at is $156.
Irans conflict has investors shaken and not willing to hold assets over the weekend on the fear of worse news. However, if the conflict is resolved investors could have a great buying opportunity.
𝙏𝙚𝙘𝙝𝙣𝙞𝙘𝙖𝙡 𝘼𝙣𝙖𝙡𝙮𝙨𝙞𝙨
Price is challenging a triple shield: major support HVN, daily pivot and the daily 200EMA. Holding this level is critical and locks in a corrective Elliot Wave pattern from the $140 level completing between the 0.5-0.618 Fib retracement.
Daily DEMA Is about to produce a death cross while RSI is neutral with plenty of room to fall.
Safe trading

Who likes Apple Crumble....WWDC Event FlopSome Key Areas:
Unified Design: Liquid Glass
- Apple unveiled a new design language called Liquid Glass, inspired by visionOS. This aesthetic introduces rounded, translucent elements across iOS 26, iPadOS 26, macOS 26 ("Tahoe"), watchOS 26, tvOS 26, and visionOS 26, aiming for a cohesive and modern look across all devices
Apple Intelligence & AI Enhancements
- Apple expanded its AI capabilities under the Apple Intelligence umbrella:
On-Device AI Models: Developers can now access Apple's on-device large language models to integrate AI features into their apps, ensuring privacy and efficiency.
- Genmoji: A new feature allowing users to create personalized emojis by merging existing ones.
- ChatGPT Integration: Siri can now delegate complex queries to ChatGPT, powered by GPT-4o, with user consent.
- Live Translation: Real-time translation is now available in Messages, FaceTime, and Phone apps, enhancing multilingual communication.
iOS 26 & iPadOS 26: Enhanced User Experience
- Redesigned Apps: Updated Camera, Safari, and Phone apps featuring the new Liquid Glass design.
iPadOS 26 brings
- Advanced Multitasking: Enhanced window management and a Mac-like Preview app.
macOS 26 ("Tahoe"): Productivity Focus
- Personalized Spotlight: Improved search functionality with AI-driven suggestions.
WatchOS 26 & AirPods Enhancements
- AI-Powered "Workout Buddy": Provides real-time insights and encouragement during fitness activities.
Gaming & Developer Tools
- Apple Gaming Hub: A new app aggregating games and challenges, enhancing the gaming experience across devices.
Apple is at a technical inflection point. It needs to hold the wedge or it runs the risk to going lower to the previous lower boundary range.

NBIS : Long worth TryingNebius group stocks are technically strong.
The downtrend since November 9, 2021 has been broken and the price is trading above the 50 and 200-period moving averages.
When we draw a medium-term Fibonacci level, we can take the take profit point at 0.618 and the stop-loss point at 0.382.
This gives us a Risk/Reward Ratio of 3.00.
A small position size is ideal.
Risk/Reward Ratio : 3.00
Stop-Loss : 43.46
Take-Profit : 60.00

ALTCOIN ROADMAP: REVISITED!!! Ethereum vs NvidiaOne of the most insightful ratio charts that provides a remarkable glimpse into the vitality of Altcoins and the appetite for risk is when Ethereum outshines one of the fastest rising stars in the stock market, #NVDA!
The conventional Altcoin index indicates how many of the top 100 Altcoins are outperforming #BTC.
This is indeed a valuable metric that we can rely on for identifying peaks.
However, I believe that if we broaden our perspective and examine the ETH ratio against a Tech Titan, we can truly pinpoint the timing of the banana zone. When it starts and when it is confirmed violent uptrend.
My interest in this ratio was sparked when ETH was still a proof of work coin, validated through GPUs; it seemed like a natural starting point to assess whether the ETH price was overvalued or undervalued.
Even after the transition to POS, I still think it’s worth analysing, as shown by the recent double bottom on the ratio!
The next crucial question is when we can break the multi-year downtrend to genuinely confirm the Banana zone. Because without ETH, there’s no party.
If we enter a big strong banana zone, I believe the ratio could swiftly trend towards 100, so we will be keeping a close eye on it!

Honeywell: Quantum Leap or Geopolitical Gambit?Honeywell is strategically positioning itself for significant future growth by aligning its portfolio with critical megatrends, notably aviation's future and quantum computing's burgeoning field. The company demonstrates remarkable resilience and foresight, actively pursuing partnerships and investments designed to capture emerging market opportunities and solidify its leadership in diversified industrial technologies. This forward-looking approach is evident across its core business segments, driving innovation and market expansion.
Key initiatives underscore Honeywell's trajectory. In aerospace, the selection of the JetWave™ X system for the U.S. Army's ARES aircraft highlights its role in enhancing defense capabilities through advanced, resilient satellite communication. Furthermore, the expanded partnership with Vertical Aerospace for the VX4 eVTOL aircraft's critical systems positions Honeywell at the forefront of urban air mobility. In the realm of quantum computing, Honeywell's majority-owned Quantinuum subsidiary recently secured a potentially $1 billion joint venture with Qatar's Al Rabban Capital, aiming to develop tailored applications for the Gulf region. This significant investment provides Quantinuum with a first-mover advantage in a rapidly expanding global market.
Geopolitical events significantly influence Honeywell's operational landscape. Increased global defense spending presents opportunities for its aerospace segment, while trade policies and regional dynamics necessitate strategic adaptation. Honeywell addresses these challenges through proactive measures like managing tariff impacts via pricing and supply chain adjustments, and by realigning its structure, such as the planned three-way breakup, to enhance focus and agility. The company's strategic planning emphasizes leading indicators and high-confidence deliverables, bolstering its ability to navigate global complexities and capitalize on opportunities arising from shifting geopolitical currents.
Analysts project strong financial performance for Honeywell, forecasting substantial increases in revenue and earnings per share over the coming years, which supports expected dividend growth. While the stock trades at a slight premium to historical averages, analyst ratings and institutional investor confidence reflect positive sentiment regarding the company's strategic direction and growth prospects. Honeywell's commitment to innovation, strategic partnerships, and adaptable operations positions it robustly to achieve sustained financial outperformance and maintain market leadership amidst a dynamic global environment.

NASDAQ Harmonic pattern indicating strong bounce incoming.AI vs. Dot-Com Bubble
When drawing parallels between #AI and the dot-com bubble of the late 1990s, many express concerns that current valuations may be excessively inflated. However, significant differences are apparent.
To begin with, the current price-to-earnings (PE) ratio of the NASDAQ-100 is approximately 30, whereas during the dot-com bubble, it skyrocketed to 200, with many companies lacking any earnings in sight.
Additionally, the market capitalisation to #GDP ratio reached unprecedented levels in the late 1990s, while today's figures, although still high, are supported by robust earnings and solid cash flows from established business models.
Innovations in AI, cloud computing, and digital transformation have fuelled revenue growth, exemplified by #NVIDIA's data centre sales, which surged 409% year-over-year in Q4 2024, and Microsoft's Azure, which experienced a 28% year-over-year increase in 2024. This surge in productivity is being driven by individuals, businesses, and governments alike.
As a result, major tech firms are making substantial investments in AI research and development, with clear strategies for monetisation.
AI is poised to become a transformative force, akin to the transistor, a groundbreaking invention that scales effectively and permeates various sectors of the economy.
Lastly, the Federal Reserve raised interest #rates to 6.5% to tackle inflation after previously lowering them to address Y2K concerns before the bubble burst in 2000.
In contrast, current expectations suggest that interest rates will stabilise or decrease, which would support valuations.

Thoughts on US equities. Not looking good at all. Expecting more sellside distribution on US equities. We need to go towards any discount levels

BULLISH RSI DIVERGENCE ON NINTENDO? SWITCH 2 RELEASE DATE BELOW!Nintendo (NTDOY), the Kyoto based home entertainment company known for games like Mario, recently announced the release date of its new video game console: the Nintendo Switch 2. According to Nintendo they hope to have the system released by June 5th 2025 for customers. A bullish divergence has formed on the 1 hour chart. Will this provide investors with a bullish opportunity, or will Trump Tariff's keep this stock's costs from rising?
Disclaimer: Not financial advice.

WILL APPLE (AAPL) BREAK SUPPORT ON 1 HOUR CHART? CRASH INCOMING?The California based AAPL is down nearly -18% since March. It appears to be approaching some key support trend lines. Will the support prices hold for this tech giant? Are Trump Tariff's fueling a sell off?
Disclaimer: Not financial advice.
