SPCB: Logscale Bullish GartleyThere is a bit of Bullish Diovergence here as we hit the PCZ for the first time; though it'd be even better if overtime we got a local Double Bottom at the PCZ and fromed Bullish Divergence within that range. Besides that I can see some potential in this stock pulling some crazy stuff if this Gartley plays out and think it's worth paying it some attention.
TECH

ETH - All Eyes on 2000 & 1750 👀Hello TradingView Family / Fellow Traders. This is Richard, also known as theSignalyst.
From a long-term perspective, ETH has been overall bullish trading inside the rising broadening wedge pattern just like BTC.
Lately, from a medium-term perspective, ETH got stuck inside 1750 support and 2000 resistance.
As per my trading style, here is my plan:
📉 1- Wait for ETH to approach the 1750 support to look buy setups
📈 2- Wait for ETH to break above 2000 (daily candle) then look for buy setups on its retest
📌 Meanwhile, as long as ETH is sitting midway it would be a no trade zone for me. So I will be waiting patiently!
Remember: Sometimes No Trade, is also a Trade.
Which scenario do you think is more likely to happen first? and why?
📚 Always follow your trading plan regarding entry, risk management, and trade management.
Good luck!
All Strategies Are Good; If Managed Properly!
~Rich

BTC - Bulls Took Over Short-Term ❗️Hello TradingView Family / Fellow Traders. This is Richard, also known as theSignalyst.
As per my last BTC video analysis (attached on the chart) we know that the bulls would take over short-term by breaking above the last minor high in gray.
Yesterday, BTC broke above the high and approaching a minor resistance in red. Now What?
🏹 For the bulls to remain in control, we need a break above the red zone 29250, in this case we will be expecting further bullish movement till the 31,000 resistance zone.
The bears will take over short-term again, if we break below the last minor low (currently around 28250)
Which scenario do you think is more likely to happen next? and why?
📚 Always follow your trading plan regarding entry, risk management, and trade management.
Good luck!
All Strategies Are Good; If Managed Properly!
~Rich

DOGEUSDI KEEP SEEING DOGE @ # 3.
Is anyone else seeing or believing this? Need a second or third confirmation.

BTC - Detailed Top-Down Analysis 🔎Hello TradingView Family / Fellow Traders. This is Richard, also known as theSignalyst.
Here is a detailed update top-down analysis for BTC .
Which scenario do you think is more likely to happen? and Why?
Always follow your trading plan regarding entry, risk management, and trade management.
Good Luck!.
All Strategies Are Good; If Managed Properly!
~Rich

BTC - Correction Started! Till When/Where? 🛬Hello TradingView Family / Fellow Traders. This is Richard, also known as theSignalyst.
As per my last analysis (attached on the chart), we know that BTC has been sitting around a strong resistance/supply zone. And we were waiting for the bears to kick in by breaking below the previous low.
📉 The bears took over by breaking below the H1 head and shoulders neckline and lower trendline from H4.
Now What?
BTC is currently retesting the previous major Daily low in green, if broken downward, expect further bearish movement till the 24k-25k support zone.
🏹 The bears will remain in control short-term UNTIL the bulls kick in by breaking above the last high (around 28,000)
Which scenario do you think is more likely to happen first? and why?
📚 Always follow your trading plan regarding entry, risk management, and trade management.
Good luck!
All Strategies Are Good; If Managed Properly!
~Rich

$PLTR is looking good! Fundamentally & technically w/tailwindsTaking a look at PLTR in this video! Been a long time since I made a video.
Let me know if you have any suggestions!

Netflix dumps and pumps after earningsYesterday, after the market close, Netflix reported its earnings for the 1st quarter of 2023. The tech giant missed analysts’ expectations, resulting in a quick and sharp selloff of nearly 12%. However, this move lasted only three minutes before the price started reversing to the upside. Within the next hour, shares erased all of their early losses.
The company posted $1.305 billion in net income, showing a decline of 18.3% YoY (in 4Q22, Netflix reported a net income of only $55.284 million). Revenue stood at $8.161 billion, up approximately 3.7% YoY and 4% QoQ. Operating income fell by 13% YoY. In addition to that, the average paid memberships rose by 4% YoY, with the company reaching 232.50 million global streaming paid memberships.
In 1Q23, Netflix launched paid sharing in four countries, and in the second quarter of 2023, the company plans to expand this service into more countries, including the USA. Furthermore, Netflix seeks to improve its revenue from advertisements and currency operations. For 2Q23, Netflix forecasts revenue of $8.2 billion, representing a 3% increase YoY. The company also expects to return $1.6 billion in operating income for the same period. Netflix shares are up approximately 105% since their low in May 2022 and about 16.5% year-to-date.
Other important information
The company’s operating income declined for four consecutive months in 2022 - 1.972$ billion in 1Q22, 1.578$ billion in 2Q22, 1.533$ billion in 3Q22, and 550$ million in 4Q22. The same applies to the net income in 2022 - 1.597$ in 1Q22, 1.441$ billion in 2Q22, 1.398$ billion in 3Q22, and 55$ million in 4Q22. In the first quarter of 2023, Netflix saw a significant rebound in both of these metrics.
Illustration 1.01
Illustration 1.01 portrays the 1-minute chart of Netflix stock. The yellow arrow indicates market close, which coincided with the release of the company’s financial results. Within the first three minutes following the announcement, shares dropped nearly 12% before erasing all losses.
Illustration 1.02
Illustration 1.02 displays the daily chart of Netflix stock. Yellow arrows indicate previous earnings, which were accompanied by a similar negative reaction in the price of shares.
Please feel free to express your ideas and thoughts in the comment section.
DISCLAIMER: This analysis is not intended to encourage any buying or selling of any particular securities. Furthermore, it should not be a basis for taking any trade action by an individual investor. Therefore, your own due diligence is highly advised before entering a trade.

BTC - Detailed Video Analysis From Weekly To H1 📹Hello TradingView Family / Fellow Traders. This is Richard, also known as theSignalyst.
Here is a detailed update top-down analysis for BTC.
Which scenario do you think is more likely to happen? and Why?
Always follow your trading plan regarding entry, risk management, and trade management.
Good Luck!.
All Strategies Are Good; If Managed Properly!
~Rich

2Yr & $TNX coming back hard & worrisome for #techLooking @ a few different #yields
(Not shown)Weekly 6month and 1Yr easier to notice BEAR FLAG & the pattern is close to being annulled.
Daily 2Yr looking good, breaking out of channel.
Hard to short dull market but seeing #bond yields climbing is worrisome for short term.
TVC:TNX 10Yr looks like 2Yr.

Potential Bull flag and break impending on INTCIntel is a strong blue chip tech stock that could play on my TSM bearishness. If TSM does get demolished Intel will rise. Intel has strong revenue, is in many mutual funds, and is forming a potential bull flag. If I enter this position, it would be with May 19th calls 38 -40$ strike price.

#yields - $TNX at important juncture1Yr is still holding better than 2yr & 10Yr
IMO Still look like they're fighting to bottom, HOWEVER, TVC:TNX has a history of breaking current support level.
Monthly RSI looks 2b weakening.
While in theory falling #yield is good for #TECH it historically has NOT been good for #stocks

#NVIDIA Take profits! The curse of Jim Cramer will strike U missed the move
A really good move
don't go chasing at these prices would be my suggestion
#cramer is named the inverse oracle for very good record
His track of wrong calls is outstanding!!! :)

tmobileeeeee THIS SHOULD BE GREATHi this tmobile stock is looking decent in the long term sense. maybe a 10-20 Year Outlook, people aint going to give up phones before another asset quote unquote. Lets see where the price ends up.

Shopify: Lift Your (Shopping-)Bags! 🧺🛍Shopify should lift its laden shopping bags – or are they too heavy? We expect the share to move upwards, climbing above the resistance at $57.50 and further from there. There is a 31% chance, though, for Shopify to make a detour below the support at $38.90. In that case, the share would develop a new low in the form of wave alt.(B) in magenta first before heading upwards.

Reversal?Potential reversal identified based on August price action.
We are at a tipping point for tech.
Weekly technicals are oversold.
MACD monthly remains negative.
Jobs report and further Fed hikes may amplify this technical analysis may tip the scales and send tech plummeting.
Good luck,
Opinion - not financial advice

An overview of the markets Overview of many markets - tech may be the canary for the overall stock market, oil could continue to 84-87 area, Gold is at heavy resistance and Dollar is a strong support, Bonds still look strong and maybe a safe haven play, BTC may tag 30k before all is said and done.
Good luck!

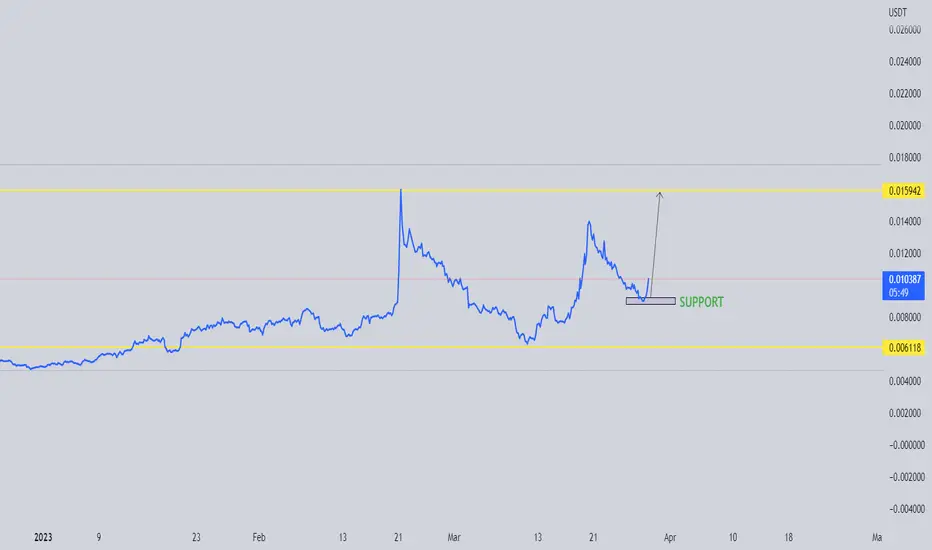
LINA : INCREASE VIEWLINA seems to show an interesting volume.
we will follow this coin to see if it's able to confirm from this support zone.
It will be only interesting if it shows a building increase in the coming time frame.
The increased view means only coins that could be interesting for confirmation.
Most coins are still not building long-term increased views.
RBC - Shift In Momentum In Action ⏱Hello TradingView Family / Fellow Traders. This is Richard, also known as theSignalyst.
📉 RBC has been forming a wedge pattern in red and now has been stuck inside an accumulation phase in the shape of an inverse head and shoulders pattern.
Moreover, RBC is currently sitting around a strong support and round number 0.02
🏹 For the bulls to take over , we need a momentum candle close above the green neckline which would also be breaking above the wedge pattern and accumulation phase for the MarkUp phase to start.
Rubic is a Cross-Chain Tech Aggregator for users and dApps which allows you to swap any of 15,500+ tokens, on & between 40+ major blockchains and 90+ DEXs and bridges in one click.
I like the project overall, so I'll be keeping a close eye on their upcoming news and features that would be the catalyst to pull the price up.
📚 Always follow your trading plan regarding entry, risk management, and trade management.
Good luck!
All Strategies Are Good; If Managed Properly!
~Rich

BTC - Short-Term Correction Started ⏰Hello TradingView Family / Fellow Traders. This is Richard, also known as theSignalyst.
📌 on H4: Left Chart
As per my last analysis, we know that BTC has been sitting around the upper bound of the gray range.
Yesterday, BTC rejected the upper gray zone and now trading lower. Hence, as we approach the lower gray zone / green trendline, we will be looking for short-term buy setups.
UNLESS the zone is broken downward, then a bigger bearish correction would be expected till 25,000
📌 on M30: Right Chart
The bears took over already short-term by breaking below our last low in red.
Now we are bearish trading inside the falling red channel and expecting a movement till the lower gray zone of the range.
Which scenario do you think is more likely to happen first? and why?
📚 Always follow your trading plan regarding entry, risk management, and trade management.
Good luck!
All Strategies Are Good; If Managed Properly!
~Rich

2023 Looks Very BloodyStocks look poised to head sharply lower through the rest of this year. The banking crisis has been snoozed like your alarm clock blaring at you first thing in the morning. The thing is you only get about 5-10 mins before it blares at you again. More bank failures are coming. Most banks are holding treasuries with unrealized losses and myself and others are combing through balance sheets and finding weak players asking to collapse.
This summer looks very negative. My hunch is the debt ceiling issue is going to compound the bank crisis. There seems to have been no progress made at all between Republicans and the White House over the last couple months and we only have 2-3 more months before this becomes a catastrophe. Myself, along with many others, believed initially that this was a non-issue, but the charts are saying otherwise. Perhaps we should not dismiss this as impossible. It could be a black swan that's right in front of everyone's noses but they don't think it is worth inputting into their risk calculations yet.
The rally from the October lows is not impulsive. There is no wave count to be made that is bullish there and the upward action has cut back into previous highs a couple times so there are many reasons to believe further downside is much more likely.
It is going to get a lot worse before it gets better folks.
I hope you all have your seatbelts on and some money in Volatility.
There won't be a warning. One morning we'll just wake up and 6 more banks have announced stress and people will start freaking out. Volatility will spike 40% in a day and people will rush in.
Good Luck.

$398 min Target from C wavePrevious resistances could then act as support to launch to $408.00. From Wave 1- Leg A, is a bullish Cypher pattern. B Leg was the rejection as it retrace back up to Wave 2. Double bottom occurred on the intraday Friday. A leg acted as resistances before the double bottom occurred. This information combined w/ my Technical Analysis on Tech, and Financial Sector I see the SP500 rally early next week and cause a short squeeze.
Looking to long Financials early next week, any negative news in the market is a buy opportunity. I also like Tech, and will likely short the inverse 3x bear etf

Texas Instruments: Don’t Rush It! 🐢With a healthy respect, Texas Instruments is advancing toward the resistance line at $158.99 slowly but surely. Soon, the share should climb above this mark and push off into the green zone between $215.90 and $237.98 to complete wave B in green before turning downwards again. There is a 33% chance, though, that the course could shift away from the next resistance line, dropping below the support at $144.49 instead. In that case, we would expect Texas Instruments to develop wave alt.IV in gray in the gray zone between $130 and $107.68 before moving upwards anew.
