Triple Bottom Setup on AAPL, Target at 205Chart Pattern/Trend Analysis
The main view of this trade idea is on the Daily Chart.
The Company stock Apple (AAPL) appears to have exhibited a triple bottom around the 150-155 support zone over the last 3 months. The stock had 3 declines, the first around the end of January, the second in late February and the last in mid-March. At the time of publishing the stock is testing resistance around the 180 price level. Expectations are for a rally towards the 205 price level. A negation of this view will be observed if AAPL falls back towards the support zone.
There is some positive trending relative strength on AAPL on SPX as well as TLT. These occurred around March 21st.
Technical Indicators
The technical indicators corroborate a bullish view on the stock. There was a switch in the Supertrend indicator around the 160 resistance level with a close above. Also, AAPL had a positive crossover on its 50-day SMA. The Awesome Oscillator (AO) is above 0 and green. Finally the RSI is above 50.
The intra-day trend following indicators of AAPL also display uptrends in the 15-Min, 2-Hour and 4-Hour time frames. The near-term support for the stock is observed around the 167.00 to 167.25 price range.
Recommendation
The recommendation will be to go long at market, with a stop loss at 160 and a target of 205. This produces a risk/reward ratio of 1.42.
Disclaimer
The views expressed are mine and do not represent the views of my employers and business partners. Persons acting on these recommendations are doing so at their own risk. These recommendations are not a solicitation to buy or to sell but are for purely discussion purposes.
TECH

APPLE hello receive a cordial greeting.
They have at their disposal the technical analysis.
Receive a greeting L.E.D
In Spain on 03/31/2022

brief comparison of ASX tech stocks against major tech stocks.Just a simple chart comparison
XTX ASX all technology index.
GOOGL Google
FB Facebook/Meta
AMZN Amazon
MP1 Megaport
NTO Nitro
XRO Zero

My bet against Yields and for the Stock MarketsThe US government bonds are currently on everyone's lips. Wherever you listen, you hear the word recession and people sometimes talk about the "big crash". This is due to the currently enormously rising interest rate curve.
However, I think that we saw our peak in 10-year government bonds yesterday and I think that the 10-year yield curve will now start falling. This is all of a technical nature and should now lead to a sell off to the 61.8% Fibonacci level which should bring us back to the 1% levels. This is enormously good for the stock markets and especially for technology stocks. I think that we can still expect a big surprise from the central bank and that exactly what very few expect will happen.
I'm betting against government bonds and for that I'm betting everything on growth stocks over the next 2 years.
This is no financial advice.

ARKK: V-Shaped Recovery OTW?When taking a glance at Ark's Innovation ETF, multiple indicators are signaling a potential bottom at these prices.
1.) On the weekly logarithmic chart, ARKK touched long-term support on March 14th @ ~ $55 and quickly bounced back to its 0.618 fib level.
2.) Since November 2021, ARKK has remained in a harsh downward channel and is finally showing signs of a possible break.
3.) When observing the MACD on the weekly chart, we see that it has printed a new bottom while the price makes a higher low on a 5-year basis. Given the right conditions, this is signaling bullish divergence and could result in a face-ripping move to the upside.
For all of the reasons above, I believe ARKK has the possibility of breaking its 5-month downtrend and returning to the next significant resistance fib level @ $96.
NFA, just my own opinion based on personal research.

$BOX Ascending Triangle Breakout?After price-basing for about two years, BOX looks almost ready to break out of its ascending triangle on the weekly time frame. Do you agree? I think ATHs are possible over the next couple of months.

NVIDIA NVDAHello, receive a cordial greeting, you have at your disposal the technical analysis of $NVDA, I hope it will help you.
Greetings from Spain L.E.D.
03/23/2022

Rangebound KPIT Tech will break the range ?The 16,000 cr. mid-cap IT company, KPIT - Technologies Ltd. is about to give a breakout. KPIT Tech is a fundamentally sound company, firsthand. In the recent few weeks, the share price of this mid-cap stock was trapped in a range shown in the chart below with blue lines. The higher range of this stock is 601. Two technical indicators signal that this range might be broken soon. Firstly, the stock may see Crossovers of 10, 20 & 50 EMA (Moving Average) soon. Secondly, the stock is not overbought as the RSI of the stock is at 52 points (approx). Also, the stock made an Inverted hammer candle at the closing of Thursday, once confirmed this might make the stock more attractive. The target is between 660 - 675. Moreover, a trailing stop loss is recommended.
Also, please note that this information is only shared for educational purposes. Please consult your financial advisor before entering into any trade. This trade might involve the risk of capital loss.

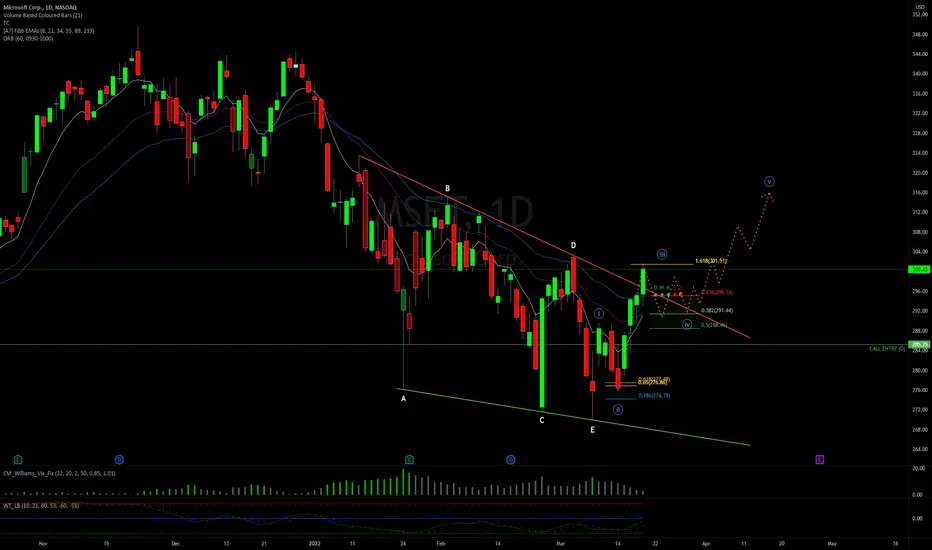
$MSFT | WEEKLY WATCHLIST$MSFT
Played upside on this one last week from $290 for a 10 point move. Expecting some cool down before the next leg higher.
📈$302 | $305, $310, $315
📉$288 | $285, $280, $275
NQ/MNQ Breakout or Breakdown?Bulls have had a nice and surprising push after fomc to the upside this week. Will be watching if price respects the DT line and will consider this an uptrend day in a bear market instead of an official uptrend reversal period until DT line is broken and value created above. I like longs above 500 as there is plenty of space for bulls to prop this up above there and short below 340, however, closed the day in key supply zone. Currently also sitting at 61% fib and will see if it can create value above 61% and push to 50% or reject below 61% going into next week. No bias, following the price/momentum and playing what the market gives us going into next week. With fomc, recent geo-political events and simply no news for this run-up, next week will should bring more volatility as well.

QQQ approaching channel resistance Time to short maybe? I’d personally wait for confirmation first!
Not financial advice and always do your own dd.
Happy trading!

TSLA950 Target on TSLA
LIS would a daily close below 776
Watch for a push above 815 and scalp to 824 this week
840-850 big breakout to watch❗

NASDAQ to break 13KJust an update that a few technical and correlation points suggest that the NSDAQ is likely to break down below 13K.
First up, the breakdown from the consolidation zone was very strong with a gap down and runaway to form a long down candle. No lightening of momentum observed yet.
Next, there appears to be a potential for crude oil price spike. In order for such a spike to occur, there must be a significant event expected to occur. Such an occurrence would also push the NASDAQ down below 13K.
Noted that the lower Bollinger Band is also near 13K, so that may mitigate the downside... hopefully.
Yesterday's close in the white rectangle box was indicative of downside momentum, and can expect some follow through. The yellow box is the projected extended downside expectation; which brings the possibility as low as 11,880.
This is IF support breaks and close below 13K.
12,780 next immediate support below 13K.

Microanalysis of the NASDAQ 4HIn a follow up analysis of the recent favourite, the NASDAQ futures NQ1!, it appears that a possible higher low above 13K has been registered and it is now consolidating below 13,360 (yellow line). Any effort above has been met with swift downdrafts (red ellipse marking the upper tails). If this continues, a breakdown below 13K is expected, and currently is expected to 12,800 target.
Alternatively, a 4H close above the yellow line would signal a breakout of the consolidation zone, and affirmation of a higher low near 13K support.
Technically, 60/40 skewed towards the bears.
Is this the calm before the storm?
Asian into European opening hours would be interesting...

Is NVDA heading toward 162$?The past few weeks, the markets have been extremely volatile. Some are arguing we are in a bear marker, others still convinced on this being a correction.
Regardless your side on that, NVDA is in a clear descending triangle, which is text book bearish, and you can argue almost every tech stock including qqq and spy have formed a major head and shoulders topping pattern.
The sentiment is very bearish right now and today we closed in bear market territory(down 20% from the high). We also closed the day, on multiple tech stocks including the etfs, with a death cross on the daily.
Textbook profit target based on the base of the triangle would be about a 50$ move to 162$. There are multiple stocks forming this pattern and I will upload some of them after this.

PALANTIR:New Beginnings On The Horizon NYSE:PLTR is now set for new beginnings as a major cycle has ended for this stock.
Recently the price has been ranging in the the 8.6-11.4 area which is a high demand area ideal for the current accumulation phase .In fact there is a great probability for the bulls to take the lead and push the price significantly up , taking advantage of the nice potential of PLTR .
Although many technical indicators are already anticipating a rally, it is more reasonable to wait for a close above the 12.6 as a confirmation before the entry .
After the confirmation ,the price is likely to reach the first target ,and potentially the second and the third targets if PLTR succeeds to close significantly above the first and the second target areas successively.
For the trade management It is advisable to :
Close 50% of the position when the first target is hit and move the stop to the entry area .
Close 25% when the second target is hit and move the stop to just below the first target area .
Close the remaining 25% when the third target is hit .
The 9.5 level would represent a reasonable stop level which has the advantage of being tighter than the 8 level despite the latter offering more freedom for the movement of price .
FERVENTLY BROUGHT TO YOU BY MANHATTAN STOCKS .
ALL REQUESTS ,SUGGESTIONS AND REMARKS ARE WELCOME .

AAPL - Market Structure Shift a Bearish CaseApple has broken daily market structure at ~167$ and has been drifting lower since the start of the year. From a technical perspective, the asset appears to be heavy which is sweeping recent lows one by one.
Downside targets I am looking at are:
Target 1: $146.5
Target 2: $138.2
I am looking for a quick move lower to sweep these two lows. If Target 2 is swept then that opens up Targets 3-6.
Over the longer term I am thinking the price will continue lower with the listed lows as targets. I am thinking the second half of the move lower is likely not going to be a straight shot down. Expect chop as the price continues to decline which will likely tempt buyers into the market as short term retraces higher occur.
Target 3: $122.2
Target 4: $116.2
Target 5: $107.3
Target 6: $103.1

SPY COULD FORM A MACRO WEDGE - INTEREST RATESGet your tin foil hats ready for this one folks. It's a long shot, but just throwing this perspective out there to see how it lands in a few weeks.
SPY loves to form wedges, especially after the breakout of other patterns.
In this case, SPY was forming quite the strong channel since September, until it broke out in January (see chart below)
Now that it has broken out, and volatility is at its highest, one potential outcome is SPY / SPX forming a wedge to calm the storm.
Here is where it gets interesting - charts also love symmetry. The price action on one side of a pattern often times matches the price action on the opposite side as well (time is a factor that affects how this looks on the chart, either squeezing or elongating the trends)
Before SPY dumped in January, it had a stair stepping, wedge-like pattern on it's way up - which took 200 days to reach ATH from $415 (a key level). SEE BELOW
Now here is where the tinfoil hat comes on. So far, SPY has mimicked the double bottom formation first seen on the left side. SEE BELOW
Notice both form a 'W' shape, with the left side having less volatility, and therefore having more time to form price action (30 days)
The right side having more volatility, formed a similar pattern in 10 days. 1/3 of the time
This would make sense if we also look at the volume, which is on average 2.4x higher than last September / October.
Following this same logic, we should reach 415 in approximately 1/3 the time it took for SPY to reach ATH from 415 (200 days mentioned previously.)
That means it would take ROUGHLY 66 days to reach 415 from ATH -- March 11 -- The Friday before the first released rate hike and when the FED will release their interest rate plans. This would put the March 15 - 16 FOMC meeting right at the vertex of this wedge.
The MACD also confirms this in a way. If SPY continues its current MACD trend on the Monthly, it should approach baseline in March, flipping red (Take a look at SPY chart, and what happens when the monthly MACD flips red without a catalyst like the FED meeting.)
It also means we could see a more volatile spike to around 460 in the very short term (first week of February or so) and then a trend down from there.
What are some problems with this perspective? It's based entirely off of connecting dots that may not even be there. Also, with all of the news and volatility happening right now, SPY could do something completely un-organized and un-predictable, but it doesn't hurt to try.
This post was written largely for fun, and I'll keep the analysis in the back of my mind. However, I do not plan on basing any of my strategies or trades on the idea alone.
Let's see how poorly this ages ;)
- Thanks for reading!

$AAPL Key Levels, Analysis & Targets$AAPL Key Levels, Analysis & Targets
Well, target 1 was hit this morning so I started a small position…
I do believe we will see at least Target 2 & 3 also so I’m not going in too heavy at the moment…
This is the first time that AAPL is under the 35EMA on the weekly since 2020, and 2019…
I am very much looking forward to this swing… and I’ll be looking for around 25% when all 3 targets are hit…
—
IF YOU'RE ADDING TO LONG POSITIONS:
ONLY ADD at support levels & FIB levels… labeled (most of the time)
(Support=Green, Resistance=Red, Trendlines=Blue) Fib will be labeled if any and their colors will vary.)
I start every position with .5 - 1% of my account and build from there as needed and as possible.
---
I am not your financial advisor. Watch my setups first before you jump in… My trade set ups work very well and they are for my personal reference and if you decide to trade them you do so at your own risk. I will gladly answer questions to the best of my knowledge but ultimately the risk is on you. I will update targets as needed.
GL and happy trading.
IF you need anything analyzed Technically just comment with the Ticker and I’ll do it as soon as possible…

QQQ QQQ bear scenario ..
QQQ would have to close below 319 which I don't think it will after finding support there now.
LVLS near 280-295 would be a great long term bottoming area in the tech names if we get any further downside due to slim possibility, poor reaction to FED decision this upcoming, or from no more QE in markets.
334 to the upside will be our next major resistance to watch iMO. currently 324.

$NLOK: Putopia HedgeRegardless of what deals are made regarding forces, long NLOK offers a pretty solid hedge against any impending cybercrimes that may linger as a result of the current geopolitical conflict and the citizen's reactions there of. This company is also much less exposed to the drains of inflation compared to numerous other stocks on the market.

$SOFI is oversold 👁🗨*This is not financial advice, so trade at your own risks*
*My team digs deep and finds stocks that are expected to perform well based off multiple confluences*
*Experienced traders understand the uphill battle in timing the market, so instead my team focuses mainly on risk management*
Today my team entered digital finance company $SOFI at $10.25 per share. Our take profit is $12 with a stop loss at $9.75.
Our Entry: $10.25
Take Profit: $12
Stop Loss: $9.75
If you want to see more, please like and follow us @SimplyShowMeTheMoney

NASDAQ indecisivenessAfter its rebound, the NASDAQ index is in a small range of 13800 to 143000. It appears to be trapped in a zone and break out or breakdown will follow a decisive move. When that move will happen?
Have to wait for it and watch it happen... then we will know.
Daily technical indicators suggest a skew to the downside, but the 4H technical indicators indicate a potential bounce up.
Let's wait and see what develops...
