$NVDA | REQUESTED TAAfter an INSANE run today, Nvidia looks like it needs to cool down a bit. Going long at this region presents a lower risk/reward than I'd ideally like to take. Things to note are the extended MACD and 2.618% fib extension to potentially conclude wave 3.
Pullback into $255-270s would be ideal to build a base for the 5th wave higher!
TECH

$CYBR: The Future Is NowCYBR is setting up for a massive weekly/monthly move and I think it's important that traders get positioned for the potential move. Earnings were significantly better than estimates and I suspect they still have plenty of room to grow

$GOOGL | TRADE IDEAGoogle gifting us with a new ATH today. All eyes on the previous ATH level of $2973. Need a daily close over this key level to confirm continuation towards my wave 3 target of $3032!

$QCOM | UPDATEAll targets HIT and gap nearly filled after a monster move from earnings! Idea was shared when QCOM was trading at just $130 resulting in over 20% move in equity.
Congrats if anyone played this one!!


$AMD | TRADE IDEAAdjusted my AMD count and this one makes more sense to me now. Looks like a larger nested 1-2 count instead of a 3-4 from the falling wedge area. This makes the count much more bullish and aligns a bit better with current price action.
As long as $118 low holds, I expect $146 target.

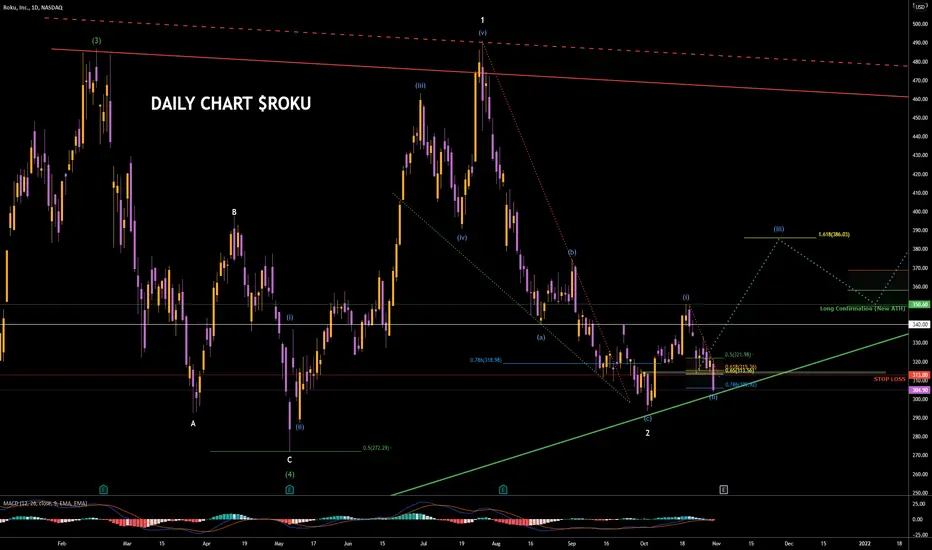
$ROKU | WEEKLY WATCHLIST 11/1Make or break level for Roku here. We must see a strong bounce this week ($25+ bounce) or else it looks quite rough for the outlook of this one...
$QCOM | WEEKLY WATCHLIST 11/1 Didn't have time to do a full Elliot Wave Theory analysis on this one, I apologize for that. However, very clear supply/demand zones labeled, while trading within a wedge. Extremely attractive bullish inverse head & shoulders shown on the chart, looking to potentially confirm and breakout early in the week.
The only thing holding me back from this is the fact that Qualcomm reports earnings on November 3rd. Setup is extremely good on this one, so I may make an exception and possibly day trade this one before earnings. Not looking to swing until after earnings is reported.

$NVDA | WEEKLY WATCHLIST 11/1One of my better counts that I'll be watching develop. We have hit and rejected the 1.618 fib extension wave 3 target of $257.32. I anticipate some distribution to occur this week near this level before an ABC major wave 4 retracement takes place. This should take us anywhere between $226-242 (I know this is vague for now since not much clarity yet) and should expect a bounce somewhere in this price range. Once we can confirm all of this is correct thus far, I will then consider starting my long swing for the wave 5 target of $290-300. Patience is a must here and we will most likely be tracking this setup for 2-4 weeks.

$GOOGL | WEEKLY WATCHLIST 11/1I alerted a Google long debit spread last week and those printed in the end of the week! Expiration is this Friday so please take caution. Looking to potentially roll profits into a new position depending on how price action looks early in the week. An amazing breakout and reclaim of the longer term daily channel.
Last week, I said it was KEY that we get a daily candle close above the previous ATH level of $2925.04 which we did get. Looking for continuation this week to reach my wave 3 target of $3032 before a short wave 4 retracement and 5th wave higher. Really loving this setup as this leads big tech.

$BABA | WEEKLY WATCHLIST 11/1Not my favorite setup into the week... but still worth mentioning here. A possible wave 1 is in and looking to retrace on this wave 2. I have indicated my ideal buy box in the $148-155 range is best. If we can hold there with volume, I will consider taking a small long swing, targeting the mid $190s area.

$AMD | WEEKLY WATCHLIST 11/1Looking like a potential local top may be in here with a pretty convincing reversal daily candle. Expecting quite a bit of choppiness for the next few weeks/month to retrace and build a base for a fifth wave higher towards my $138 target. Patience will be key on this to wait for the right setup to present itself. Worth keeping on your radar if the retracement happens quicker than anticipated.

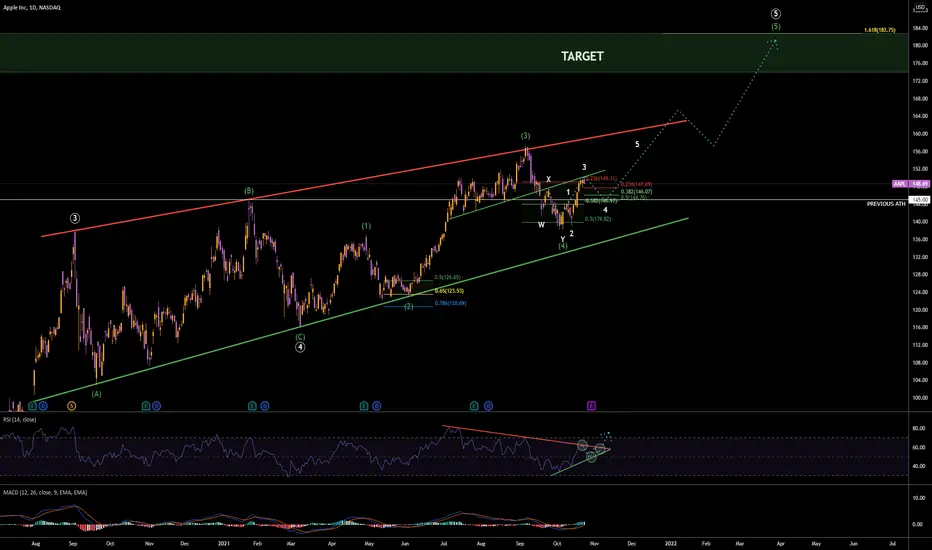
$AAPL | WEEKLY WATCHLIST 11/1After reporting their earnings last week, Apple fell to the $147-147 level and currently trading within that range. I still believe we will see a continued corrective wave to complete either a wave 4 or wave 2. (Hence why the recent peak/following potential low have two number labels) It is currently unclear which is the correct label, however the outcome is still the same. Expecting Apple to come down to the $142-145 range for an optimal buying opportunity to take a long swing. Sitting on the sidelines until then.

Like always IDK MAN, but ENJ gon pomp Sheesh boi if you listened to my mana call you'd be rich and callin' yo ex by now.
Donations would be lovely and for once they would go straight to my spot account whatever you think i should hold Ill make an address and send it to me <3
much love for the follows and likes guys!

S/t NFLX route@wardaK This one is for you. You asked what's my current though on NFLX S/T.
I believe we see NFLX show some sign of consolidation possibly after it goes towards 700 pysc lvl.
Expect Support to be held from 662-672 to be held and bot up for the next rips.
Market leader iMO -- alongside FB , TSLA , COST

Facebook ($MVRS Dec 1st)Have you ever seen Black Mirror?.....Well go watch that Live Zuckerberg dropped today. Imagin playing GTA San Andreas whi......nvm just check it out. On the weekly timeframe, we are oversold and on the bottom part of the histogram. The previous high was broken with a retracement of 61% that looks like it may be completed for the time being. It seems like price is fighting the 20 day ema on the 4 hour and the 200 ema on the daily. I would like to see price retrace the previous high up to 38% minimum. Facebook has been "FACING" a ton of scrutiny.....they switched they name and finessed the game. I respect it......not advice.

WATCHING $AAPL - Key Levels and Analysis WATCHING $AAPL - Key Levels and Analysis
Apple. Apple. Apple… I do love apple… however, Up 184% in a year on falling revenue makes no sense… Technicals don’t like it either.
I would like to see 130 by EOY - I would be comfortable starting a position at 130…
Also... a lot of the charts are looking like this right now... technicals look weak from the long
——————
I am not your financial advisor, but I will happily answer questions and analyze to the best of my ability but ultimately the risk is on you. Check out my ideas, but also do your own due diligence.
If you want me to analyze any stock or ETF just leave me a comment and I’ll do it if I can.
Have fun, y’all!!

SPX, SP500, SPY down.Im not much of a bear... sike, its due to the fact that we are up 590% from bottom to top since the financial crises in 2008. Almost a century ago saw a 500% run up from lows to ATH's
Generally when something goes up on whatever positions you hold its a good thing. Everyone is chasing the same thing and that gains however you acquire that.
With that being said this has been yet another great run up and has been exciting to trade.
Here ladies and gentleman is yet another ascending wedge coupled by a higher RSI on the 4hr than the previous run up to ATH and the same level on the daily charts.
Given the dynamic of earnings happening I think that this one shall be interesting to say the least.
theres some gaps that need to be filled that are on SPX though we will see if those are filled this time around.
Currently we broke trend yesterday and looks ready to drop a little lower before maybe shooting up again to ATH or dropping lower due to some out of left field circumstance or something playing out that was already talked about.
Only time will tell.
That's all folks

Alibaba Group Looks like on the daily timeframe, we are on the top side of the MAcd which entails that we may be at a level to although on the weekly we are oversold, the daily looks like there "may" and i mean "MAY" be a small pullback to the previous low (38%) before it continues to the upside. BABA won't and can't be held back for long before it reaches its previous high up to 38 -61% of that previous high on the weekly time frame. This the Google of China and Munger believes in them heavily. I'll follow! He's my mentor

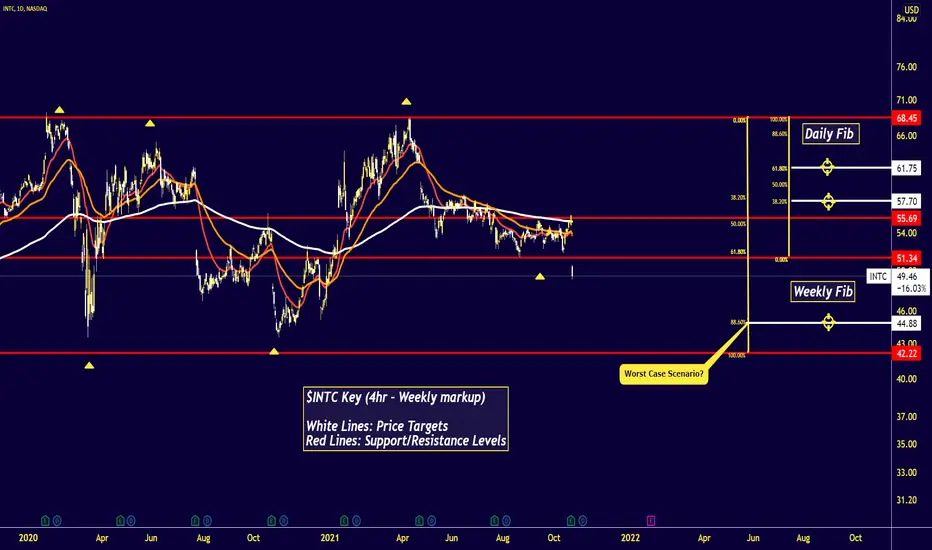
INTC (Update)Looks like an accumulation stage here with a bullish candle breaking out as it's crossing through the 200 ema on the daily time frame. I'm looking for a retracement of the previous high up to 38-61%. Let's see what happens long term. I don't see price reaching the "Worst Case Scenario" area on the chart. The win goes to the longest holder!
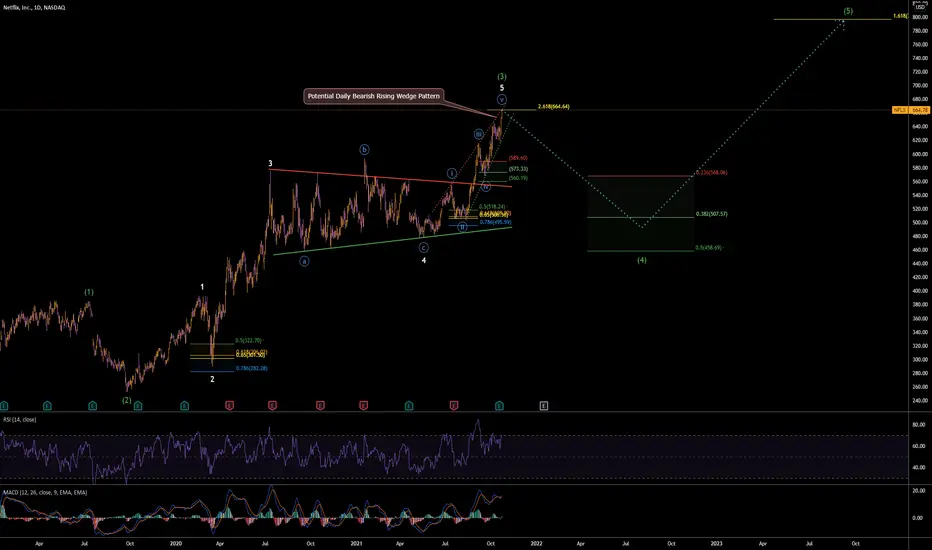
$NFLX | WEEKLY WATCHLIST 10/25If markets show signs of weakness at any point in the near future, I believe Netflix will be one of the most prime short setup out there. Many signs pointing to downside here for the stock.
- Recent run-up due to overall hype and the massive success of Squid Games (believe we need to cool off a bit)
- Concluded all Minute, Minor and Intermediate EWT counts (assuming my count is correct)
- $VIX sitting on major support and is at it's second lowest weekly close since 2/10/20 (market is susceptible to a pullback)
With that being said, I will wait for downside confirmation as well as volume before entering a short position on Netflix. I would also want the indices to be confirming on a downtrend as well as $VIX to be in an uptrend. These factors combined would get me short. All in all, I'm still bullish in the long-term as shown.
$MU | WEEKLY WATCHLIST 10/25Not going to over-complicate this one. A simple cup & handle pattern spanning out for over a couple decades. It is important we keep in mind the timeframe of this chart when analyzing the stock.
We are currently pulling back from the double top at $97, and trading within a tight falling wedge pattern. With the bottom of the wedge intersecting with MAJOR demand zone between $62-65, this will be my most ideal buy zone.
At $62-65, I will start averaging into a long term bullish position on MU. I believe with time and patience, this one will pay off big time and inevitably see $100+. Much like it's counterpart $AMD did.

$AAPL | WEEKLY WATCHLIST 10/25Looking for a local top rejection here to cap off the wave 3 move. Ideally, we see a pullback and bounce into my buy zone between $139.82-149.11. I will look to start averaging into a swing position from there.
Daily close above $150 is crucial for taking Apple up on it's next leg upwards.