TECH

China tech back to regular growth?CQQQ just broke through year long up trend line and looks to revert back to long-term (slower paced) trend channel.

TSLA | Will History Repeat Itself?TSLA reports earnings on Monday, 7/26 after hours. I am making a bold prediction that they will knock it out of the park and gap up 8-10%. Looking from a technical standpoint, the chart is nearly ready to explode upwards and waiting for a catalyst to propel the stock upwards... If we dip, still an amazing buying opportunity in my opinion. Only time will tell...

ROKU (BULLISH)Looking to buy the dip on ROKU rather than chase up here at these levels approaching previous ATH region. Still bullish none-the-less in the bigger picture.

PYPL (BULLISH)Looking for $340 target if we can break and hold over $310, confirming my bullish thesis. A great short-term opportunity!

NIO (BULLISH)Nio looking great after holding my fibonacci buy box region. Looking for a move over $47.5 to confirm my short-term bullish thesis. Long term mega bull thesis untouched.

NQ - Hyper Bubble Targets into August 25, 2021NQ is behaving differently and remains the most overcrowded
trade of all Instruments.
The higher Targets, as absurd as they may seem, have an
increased probability of completing the Blow Off in Tech.
As improbable as this may seem, it has a higher probability
at this moment in time.
There is immense Risk into TECH EPS next week. The decline
in overall demand will begin to appear in Q2 EPS, but will
not begin to show up in force until Q3. This will be front
run ahead of September Q3 closes. It will be apparent then
Economic Activity has rolled over.
These ranges are extreme, we realize this, but would be remiss
if we did not provide all of the potential Extensions for NQ.
The Blow Off is attempting to begin, Retail is leading the chase.
More Faith Based Investing ahead in our opinions.

Hedge against Stagflation / possible reversalChina has started experiencing the pain of higher input & output costs.
1. this can ease slightly in coming weeks giving respite to chinese stock market overall
2. Ali Baba with its low labour/supply costs, high growth can come out of this with an intact profit margin, even a better one.
After months of gloom Baba stands a chance to go back to new highs.

Intel Corp.I love this companies financials. I understand what's going on in the semiconductor world. However, I'm thinking about consumer durables like laptops, computer gaming, memory and storage data. I'm not big on speculation but I know we are so dependent upon technology and alot of their products attack a wide range of technological factors.
Price is currently at a strong support in my opinion. On the 1 hour time frame, there seems to be to some strong consolidation in this same support area. This could indicate that Intel is currently in its accumulation phase. I've looked at some insider trading as well and noticed that within the last two months, there were purchase on two occasions around this area and a third person sold at $57... I want to see price breakout at some point to the upside as the previous high was broken and the previous support hasn't been reached yet considering a strong consolidation at its current support. Let's see what happens! I'm locked in til 2023.
Not advice
What do you think?

$CLSK vs $BTC*This is not financial advice, so trade at your own risks*
*My team digs deep and finds stocks that are expected to perform well based off multiple confluences*
*Experienced traders understand the uphill battle in timing the market, so instead my team focuses mainly on risk management*
Recap: My team has been analyzing sustainable energy tyrant $CLSK for the past few weeks. $CLSK converts waste materials into SynGas. $CLSK uses its SynGas as clean and renewable fuel for power plants and motor vehicles. My team entered $CLSK on 6/21/21 at $17.19 per share.
My team has been doing some critical thinking on how to approach crypto. Public enemy number one for $BTC is fossil fuel energy consumption for coin mining and transactions. If $BTC were to ever reach previous all time highs $CLSK share price would correlate and perform astronomically well. My team has reallocated previous funds that were used in our $BTC trade earlier this week and are using those funds to double down on $CLSK today.
My team has averaged down on $CLSK today at $15.60 per share.
If you want to see more, please like and follow us @SimplyShowMeTheMoney

$CHPT July Update*This is not financial advice, so trade at your own risks*
*My team digs deep and finds stocks that are expected to perform well based off multiple confluences*
*Experienced traders understand the uphill battle in timing the market, so instead my team focuses mainly on risk management*
Recap: My team has been swing trading EV sector tyrant $chpt for the past couple months. In this time-span it has continued to bounce from its $20 support zone . The potential is undeniable for an established EV company like $chpt. There is also an impressive amount of option calls which suggests bullish momentums. We recognized the bullish price action of $CHPT and averaged up from our original entry of $22 at $24.35 on 5/30/21.
$CHPT currently sits at $28.01 per share.
My team planned to average up one last time on $CHPT if the opportunity presented itself...that time has come
My team bought more $CHPT shares today at $27.80 per share. This is our 3rd and final entry.
We have also raised our initial take profit to $41 per share.
1ST ENTRY: $22
2ND ENTRY: $24.35
3RD ENTRY: $27.80
TAKE PROFIT: $41
STOP PROFIT LOSS: $26
If you want to see more, please like and follow us @SimplyShowMeTheMoney

Fib Levels On AEHR Going WAY BackHad to take the AEHR chart all the way back out to 2017 to find some levels to plot. Took the fib retracement and look what we found: high traffic area around the 236 level. Tested it for the first time since 2017 and failed to break & hold. After pulling back, AEHR came within testing distance of the 382 level. After such a huge extension it will be interesting to see if it ends up consolidating above this level or if it tests (or breaks below) it.
"If we consider that the market for computer chips is extremely in demand right now, we see just why AEHR is getting so much attention. While it is not a producer of these chips, it does work as an ancillary company in the industry. In the past six months, shares of AEHR stock have rocketed higher by around 31%. Over the past twelve months, that number shoots up to over 45%... Only recently, Aehr Test Systems won a $2.9 million follow-on order for its FOX-XP Wafer Level Test and Burn-in system as well as multiple WaferPak Contactors from its lead silicon carbide customers. While this alone is not a be-all-end-all deal, it is a big step for the commercialization of its products. Additionally, large orders tend to help with the notoriety of a product and can lead to more orders in the future... ...While many gains with penny stocks occur without news, AEHR made an exciting announcement in the early morning on Monday. The company stated that it received a $10.8 million order for its silicon carbide test and a burn-in customer regarding its FOX-XP systems its WaferPak product... "
Quote Sources:
7/12: 5 Top Penny Stocks on Robinhood That You Should Check Out in July
7/19: 3 Top Penny Stocks For Your Monday Morning Watchlist

Time to load up Consolidation channel btw 30 usd and 36usd.
if the support doesn't resist we can see the price falling to de 26 usd.
Anyway its a good opportunity for the long run to buy shares

NVDA Buy LevelsThe color coded support levels shown on the chart are the levels I am currently watching on Nvidia should an extended pullback occur.
The levels were found using a simple, multi-fibonacci retracement method based on previous swing highs and swing lows that allowed me to spot local fib levels. I will possibly make a post on this one day as an educational resource.
There is a lot that will go into this so there is no way I can cover everything in this one post. So check for updates in the future.
In the meantime, we will start with the most bearish scenario and that would be below the .236 fib level at around $715.
I personally do not trade below the .236 but there is no rule that exists that you shouldnt. Its simply my personal preference not to.
This is the basement floor where many traders would choose to place limit orders with hopes that they hit. This is the area where the largest potential gains are made.
PLEASE NOTE: Nvidia does not HAVE to reach these exact prices. This is just simply a point of reference for one to borrow. Please apply your own analysis to come to your own, best conclusions.
With that being said, my favorite fib levels to buy are primarily whatever level the current price is closest to. Which means the .786 level near $812 is the level that should get your attention as of right now.
As you can see, the price wasted no time dropping to this level and one should note that this was not random. The first level that price usually pauses at when pulling back is the .786 fib level. And if this level holds on larger time frames, that would be the first signal of a possible bullish reversal/continuation. If this level holds on the weekly, bears will be at risk of losing momentum, and bulls could retest the all time highs again.
On the flipside, if NVDA breaks the .786 fib level ($812) then that would be the first true bearish signal. And although this is a daily chart, we are truly looking for closes below/above the fib levels on the WEEKLY.
The lower range of each fib level are the buy areas. The tops of the fib levels are the expected rejection areas.
You can see the price at each corresponding level as follows:
$838
$812
$791
$777
$762
$744
$715
To the left of the candle sticks on the chart you will see an example of how to ladder buy simply using the fib levels. It is fairly common sense but one should feel free to tweak it and apply their own strategies as long as risk management is being practiced.
Check back in the coming days on this and if you have made it this far reading this please leave a like!!

Couple intraday setups for SE this stock has been hotThe context behind this trade is simple - it has upward momentum every time it reaches demand zones it shoots up.
I found out SE on an options order flow website and it led me to be super bullish on the stock .
Then I realized it’s similar to apple in a way considering it’s a consumer discretionary and tech bundled into one , also Singapore is supposedly the new Mecca of tech in Asia.
Do your own DD but this is why I am taking this trade.
I always read the tape before taking an entry , I exit when price action tells me to head out or after volatility ceases as I primarily scalp options intraday or on higher time frames if the opportunity presents itself , again this isn’t advice I’m just giving you an idea as to why I’m taking this trade .
There are more than one ways to skin a cat and I hope someone else finds something different in this or it sparks a new idea.
Let’s conquer these markets together.
Cheers.

Showing Bullish Divergence looks good above 175Showing Bullish Divergence looks good above 175 for targeted gains of 8-10%

FB short 7/16 Facebook has broken out of the triangle and pushing down under support lvls.
333 Should be a great place to find a bounce off FB and make some quick profit..
If Facebook breaks under 330's we'd see a trip back down to 318.
Let's hope we can find a bounce on the mrkt and keep the forward momentum in favor of the bulls.. if not we're prepared to play both sides!

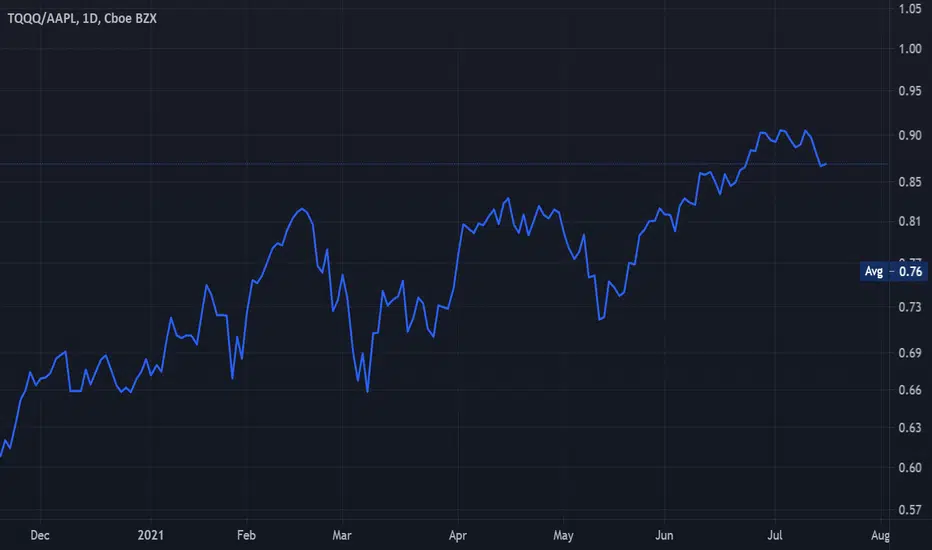
TQQQ : AAPLA clear divergence is forming between AAPL, TQQQ, QQQ
July will be the High for NQ IMHO, it will see a large correction
beginning next week.
Semiconductor Sector has immense issues.
We could see a 20% decline in Tech as shortages will crimp
earnings as Input Prices are being rejected.
The NQ has the potential to make a new high, it must break
the Range posted earlier this morning or failure will occur.
A decline will be rapid, NQ always follows RTY.
NQ - Range for Friday 14976 will be important Level for OPEXWe are Neutral for Today, VX during Roll should continue to come under pressure.
Should the VX break 16.90 we could see a quick flush down to ~16.50s.
Ahead of Jackson Hole, there will be an effort to continue the Trend - which
remains Bullish for now. We anticipate a blow off ahead of VX roll.
The FED has a high probability of announcing tightening in varying forms - even
as the Commodities Complex is coming under duress - Lumber was off 7% yesterday.
Gamma for AAPL will play an important role for the large number of Calls purchased
when AAPL was trading 141s.
Bonds are pulling back ZN/ZB selloffs will provide a tailwind to Equities as will NQ Bank.
Opening Breadth on Friday's usually provides a solid trend, Friday's are generally NOT a
consolidation.
Bias is to Upside for Index Complex.16.68 and then 16.49. The VX is presently
trading -2.57% with the VX Curve in a well defined Contango.
15045.90 is the upper Limit should 14,976 be broken.
14.672.80 is the lower Limit for Today unless it breaks - 14,540.75 would be
lower Support.
NQ may well trade this entire range over the coming week into VX Settlement.
VXN will provide guidance as Support remains 19.15

SWING IDEA #18: PTONWatching PTON today. It may go and test the 114 level, there is still a gap to fill so I am bullish. If your thiniking about entering do it under the 114 level.
Not financial advice just my opinion.

Long TESLA before mini breakout at 700Telsa has been wanting to break 700 again for a while, and the TA is showing that the buyer volume just might have enough to make $TSLA pop.
Why bullish momentum?
RSI new high
MACD cross over + bullish bar (keep an eye on this spot especially particularly to indicate bullish momentum)
Hard VWAP bounce earlier July
700 has a pretty tough resistance, which is our first target R to break at the 128 day MA.
Retesting could indicate that we break through to upper Rs including: 714, 723, 753, 780 (targets). I will 1/2 TP at 715 and see whether we get a wick indicating profit taking or if bullish momentum holds and new buyers firmly enter tesla. S/L roundabout 665.
Note: I do short term holdings, no longer than 2 trading days max.

AMD Buy?Its been a rough go for even the most bullish setups on equities lately due to the rocky nature of the macro with recent news of further inflation fears. Nonetheless we continue to hunt for the setups if not for the gains, then most definitely for the learning lessons that the markets can teach us.
For this asset, we keep things simple by keying in on an uptrend that has been supporting AMD since May.
It is expected that eventually this trend will break, but for now as long the price remains in the trend, buy opportunities exist at the green upward sloping trendline.
Once the green sloping line is broken, this will be our time to begin preparing for an exit.
The yellow line will be the first level of support should the trend be broken, but ultimately the bears will want to break the red line at $87.86 to confirm.
For the bullish case, continue to expect bounces at the green trendline of support until a full body candle closes outside of it on the daily and weekly time frames. A wise profit taking area will be around $93.50. If that level is broken and held as support, a retest of all time highs could be instore for AMD.

DPLS Playing out vs FibsDPLS has played out almost perfectly against the Fibonacci retracement so far. Considering that it was denied around $0.20, retraced the move back to the 786 fib line, which is also around 10/11 cents or about 0.005 shy of where DPLS got denied during the June rally is interesting. If you look at levels, around 4/5 cents in February was a resistance that couldn't be broken through until June. Then after DPLS was denied at nearly 10 cents, where did it pull back to and hold above? The 5 cent area. The volume will be something to pay attention to if DPLS is still on your watch list following the denial at the 618 fib and retracement back to the 786 in my opinion. Now the focus is where does DPLS find its new range? Based on the historical chart, which so far has come through, 13-15 cents was a previous area of traffic the last time DPLS was trading consistently above 10 cents. Will that become the interim pivot point in this latest move?
"Systems can quantify strains and stresses, adding to the safety profile of common industrial components. This includes monitoring structures such as pipelines, perimeters, aircraft components, and mining safety among others. Recently, the company announced the planned acquisition of TerraData Unmanned, PLC. This is a drone company that offers underwater inspection, 3D modeled mapping, and a variety of other services. 'As DarkPulse continues to build best in class technology service offerings to the critical infrastructure/key resources market we look for teams such as TerraData to bring experienced personnel and leading-edge equipment allowing the Company to operate AI-assisted inspection services in all mediums including land, sea, and air. TerraData’s ability to work in difficult marine environments with accuracy, efficiency, and expert results while eliminating risk to humans is a game-changer.' - DarkPulse CEO, Dennis O’Leary"
We'll have to see what happens next based on company news and technicals
Quote Source: 7 Top Penny Stocks to Watch That You Probably Haven’t Heard Of
