Airbnb Inc. (ABNB)Daily chart with ichimoku.
It is necessary to monitor whether the LS intersects the trend line.
Thin cloud on the horizon.
Make up your mind.
TECH

Alphabet Inc (Google) Class ADaily chart with ichimoku.
In short, I don't like the graph very much.
Make up your mind.

Magnificent sevenGood morning,
Daily chart with ichimoku.
Market breathing to break the 1.618 fibo retracement?
Make up your mind.
Have a good week on the markets!

NQ1! - Mini Futures NASDAQGood morning,
Weekly chart with ichimoku.
We notice that the close of the week is above the trend line.
To confirm the movement, the Chikou must break the right.
Make up your mind.

Now would be a good time to short the Nasdaq Index...Short term resistance has been met and the Nasdaq has just recently broken through its short term support. This would indicate to me a correction will follow taking the price of the Nasdaq back down to medium term support.
After this i would exercise caution, any short term bounce may be followed by another breakdown in the medium term support. Then the Nasdaq may head lower into the long term support range which is typical after such a long bull run in tech stocks.
The catalyst for this correction in tech stocks will be for the economy to rollover after the Fed's aggressive rate raising cycle.

NAS100 H4 | Potential bullish reversalNAS100 could fall towards an overlap support and potentially bounce off this level to rise towards our take-profit target.
Entry: 15,809.50
Why we like it:
There is an overlap support level
Stop Loss: 15,638.50
Why we like it:
There is a pullback support level
Take Profit: 16,139.82
Why we like it:
There is a resistance that aligns with the 161.8% Fibonacci extension level
Please be advised that the information presented on TradingView is provided to Vantage (‘Vantage Global Limited’, ‘we’) by a third-party provider (‘Everest Fortune Group’). Please be reminded that you are solely responsible for the trading decisions on your account. There is a very high degree of risk involved in trading. Any information and/or content is intended entirely for research, educational and informational purposes only and does not constitute investment or consultation advice or investment strategy. The information is not tailored to the investment needs of any specific person and therefore does not involve a consideration of any of the investment objectives, financial situation or needs of any viewer that may receive it. Kindly also note that past performance is not a reliable indicator of future results. Actual results may differ materially from those anticipated in forward-looking or past performance statements. We assume no liability as to the accuracy or completeness of any of the information and/or content provided herein and the Company cannot be held responsible for any omission, mistake nor for any loss or damage including without limitation to any loss of profit which may arise from reliance on any information supplied by Everest Fortune Group.

Bullish Wedge pattern breakout in GLENMARKGLENMARK PHARMA LTD
Key highlights: 💡⚡
✅On 1Day Time Frame Stock Showing Breakout of Bullish Wedge Pattern.
✅Strong Bullish Candlestick Form on this timeframe.
✅It can give movement up to the Breakout target of 875+.
✅Can Go Long in this stock by placing a stop loss below 745-.

$NVDA downside gap-fill potential!NASDAQ:NVDA ,1D: Price dipped just below the 50% line and popped back up over the line after coming off the local lows at 403. Given the 'uncertainty' around the level and duration of a 'higher for longer' rate environment along with the market's general preference for 'clarity' over 'uncertainty', it would not be unreasonable to expect the 'increased volatility' that comes with 'uncertainty' until some level of 'clarity' can be established around the duration of the current 'higher rate environment'.
Further adding to the potential for 'market uncertainty' and 'lack of clarity' are the tenuous and ongoing negotiations between the U.S. and China around access to semi-conductor IP. NASDAQ:NVDA utilizes the cost benefits provided to its model from the 'cost efficiency' of both Chinese and greater Asia's manufacturing and production capacities. Were trade relations around semi-conductor IP between China and the U.S. to become 'less amenable', the deterioration of that relationship could adversely impact NASDAQ:NVDA 's margins.
If NASDAQ:NVDA had to re-establish production/manufacturing supply chain relationships elsewhere this could inject 'uncertainty' into the price discovery process. These are 'unknown unknowns' at this point and hard to factor into analysis, but at a minimum, they would increase the potential for 'market uncertainty' and the subsequent 'lack of clarity', which often leads to 'price volatility' until some level of 'certainty' could be re-established.
Looking at our 1 day RSI against price I am seeing a 'bearish divergence' whereby price makes 'higher-highs' and 'higher-lows' while the RSI prints 'lower-highs' and 'lower-lows'. This can be taken as a 'leveling off' of momentum that often precedes a change in price direction or, at a minimum, a significant pull back within a constructive trend. (see light violet curves)
I would expect that a downside 'gap fill' could be a 'necessary evil' at some point in time across the next 6 weeks or so, and before further gains to the upside could probabilistically be portended from a structural standpoint. The bottom of the gap fill is roughly in confluence with the YTD VWAP (peach).
NOT FINANCIAL ADVICE. ALL STOCKS CAN GO TO ZERO.

$ON: The EV downside is already priced in.$ON:1D
With the earnings forecast providing downside price pressure on the longterm trend, NASDAQ:ON hits the lowest level on its1D RSI in over two years.
Needless to say, our trend has been weakened from a Pearson’s R^2 of 0.91 down to a Pearson’s R^2 of 0.88 while losing a little more than 3% of the longterm trend strength in the process.
While there are significant headwinds facing the EV market at current, from supply constraint’s on graphite to scaling EV’s across our shaky electrical grid system, it seems as though NASDAQ:ON has those concerns ‘overly priced in’ and could be poised for a rebound along with the broader semi-conductor market.
I would expect NASDAQ:ON to make an attempt at coming ‘back in line’ with its long term trend and to make a move up to the lower 3rd standard deviation line at 76.49 and possibly higher before year’s end.
Not financial advice. All stocks can go to zero.

NAS100 12/11/23NAS100 ending last week with a career bullish shift to the upside we're looking to follow this even though our range has very little to no structure we see one liquid low within our range in the lower 50% and we're looking for a further extensions to the upside but as always we will look at what price offers us at market open.
Remember to always read order flow and follow what price is showing you instead of trading based on your desired direction. And, as always, stick to your risk and your plan.
We'll be closely monitoring market openings and price action throughout the week. If you find this analysis useful, let us know in the comments below and hit the boost button to show your support. Here's to a successful week of trading!

Shopify: Boom 💥"Boom!" There is no better way to describe the bullish dynamics of SHOP stock. The stock has now confirmed the low of the turquoise wave X with a 33% attack to the upside. The upward wave to the north must now continue to the upside to overcome resistance at $67.60. The high of the turquoise wave Y and thus of the superior wave (B) in green is not expected until around $90.

$ARKK: Another Dip Through 40I'm curious if in the short term ARKK may underperform at the 40 handle. I believe some growth names like DASH, DOCU and SNOW may have gotten ahead of themselves and are worthy of another pullback at least for now..best of luck traders

NAS100 H4 | Potential bearish breakoutNAS100 is falling towards a pullback support and could potentially break below this level to drop lower towards our take profit target.
Entry: 15102.05
Why we like it:
There is a potential breakout level that aligns with the 23.6% Fibonacci retracement
Stop Loss: 15397.35
Why we like it:
There is a pullback resistance level
Take Profit: 14851.70
Why we like it:
There is an overlap support that aligns with the 38.2% Fibonacci retracement level
Please be advised that the information presented on TradingView is provided to Vantage (‘Vantage Global Limited’, ‘we’) by a third-party provider (‘Everest Fortune Group’). Please be reminded that you are solely responsible for the trading decisions on your account. There is a very high degree of risk involved in trading. Any information and/or content is intended entirely for research, educational and informational purposes only and does not constitute investment or consultation advice or investment strategy. The information is not tailored to the investment needs of any specific person and therefore does not involve a consideration of any of the investment objectives, financial situation or needs of any viewer that may receive it. Kindly also note that past performance is not a reliable indicator of future results. Actual results may differ materially from those anticipated in forward-looking or past performance statements. We assume no liability as to the accuracy or completeness of any of the information and/or content provided herein and the Company cannot be held responsible for any omission, mistake nor for any loss or damage including without limitation to any loss of profit which may arise from reliance on any information supplied by Everest Fortune Group.

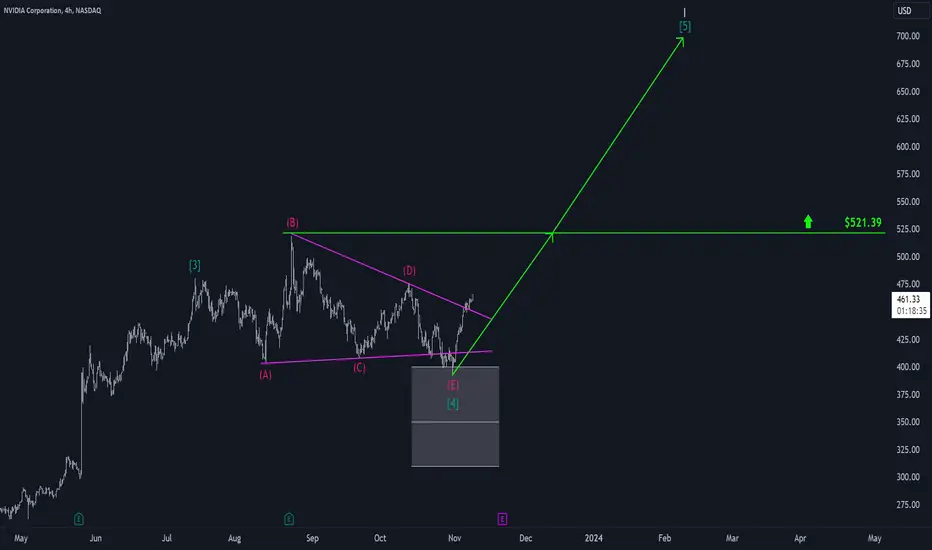
Nvidia: Checked out🏨✅NVDA stock did not miss the opportunity to head for our last relevant target zone in line with our primary assumption. As soon as the minimum requirement was reached, the stock immediately launched a 17% surge, confirming the anchoring of the low of the green wave within this zone. Those who used this zone to enter the long side can now tighten the stop to the entry level. From here, the price should rise significantly and soon break through the resistance at USD 521.39.
$ON: EV headwinds are priced in.$ON:1D
With the earnings forecast providing downside price pressure on the longterm trend, NASDAQ:ON hits the lowest level on its1D RSI in over two years.
Needless to say, our trend has been weakened from a Pearson’s R^2 of 0.91 down to a Pearson’s R^2 of 0.88 while losing a little more than 3% of the longterm trend strength in the process.
While there are significant headwinds facing the EV market at current, from supply constraint’s on graphite to scaling EV’s across our shaky electrical grid system, it seems as though NASDAQ:ON has those concerns ‘overly priced in’ and could be poised for a rebound along with the broader semi-conductor market.
I would expect NASDAQ:ON to make an attempt at coming ‘back in line’ with its long term trend and to make a move up to the lower 3rd standard deviation line at 76.49 and possibly higher before year’s end.
Not financial advice. All stocks can go to zero.

AirBNB: Arriving 🛬 🌴Due to the recent sell-off, the price of AirBNB has now reached our magenta target zone between $116.53 and $96.73. This means that the minimum requirements of the magenta wave (2) have been met, implying that the price could theoretically complete its reversal. However, we still expect a drop to the 61.80% retracement first, in order to make the low there. Wave (3) should then take the price clearly higher.

NVIDIA - Head and Shoulders, trading below the Neckline!This stock is going to lose it's 1 trillion dollar mcap.
At $500 The Shillers in suits on CNBC were talking about total addressable market for this company
Major RED flag LOLOL
Technically coming back to test the previous highs is perfectly reasonable
but unfortunate for ppl buying the tops ofc.

#AMZN Head and shoulder's ? Quite Possibly!In this environment
I would say this is a distinct possibility
1.3 Trillion Market Cap
107.6 P/E
SPX PE @ 20
Yes very plausible.

Apple: Trend-setting battle 🔥📈📉The bears have once again pushed Apple down to the lower border of the green target zone between $170.89 and $185. We continue to believe that the stock is in an overriding uptrend, but for that to be the case, it now needs to climb higher. In this scenario, the white wave (III) is expected to end well above the resistance at $198.23. However, it is important to note that our alternative now has a relatively high probability of 41%. If the price were to fall below $167.62, the first task would be the grey wave (IV).

TSLA - time to ripTesla has had a massive selloff into support.
A potential large bullish pattern is developing on the weekly chart!
if this plays out we could see new all time highs in Tesla in the next 1-2 years.

Spotify looking extremely bearish and ready for a shortSpotify has put in a confirmation of an existing level as resistance once again. Along with this it is showing clear bearish divergence and and two clear bearish candlestick patterns. This is exactly what we look for when we try and take a trade.
So the trade is easy, we enter at the price today after a small retrace up, then our stop is above the level and the recent high. Why would we want to be shorting Spotify if it broke through that level anyways??

BTC - Critical Zone / Period ❗️📹Hello TradingView Family / Fellow Traders. This is Richard, also known as theSignalyst.
📈 Here is a detailed update top-down analysis for #BTC.
Which scenario do you think is more likely to happen? and Why?
📚 Always follow your trading plan regarding entry, risk management, and trade management.
Good Luck!.
All Strategies Are Good; If Managed Properly!
~Rich

Potential double-top ahead of earningsMeta Platforms posted a new 52-week high last week, hitting $330.54. After that, it retreated lower, creating a potential setup for a double-top pattern. As a result, we are carefully watching the developments on the daily chart, with the main focus on RSI, which seems to have topped slightly below 70 points last week. In many instances, such behavior is associated with bear markets. Therefore, in the next few days, we will observe whether it will be able to break into the overbought territory; if not, it will act as a warning sign. One thing to consider, however, is that Meta Platforms is scheduled to report earnings next week. Within the past two years, all except for one earnings release were accompanied by a volatile price action and an opening gap the next day. Consequently, we would not be surprised to see a similar occurrence take place this time again. That brings us to the conclusion that staying on the sidelines would be the best alternative until the company releases its earnings.
Illustration 1.01
Illustration 1.01 displays the daily chart of Meta Platforms. Yellow arrows indicate four major opening gaps within the past twelve months. Interestingly, every one of them coincided with the release of the quarterly earnings report.
Technical analysis gauge
Daily time frame = Bullish
Weekly time frame = Bullish
*The gauge does not necessarily indicate where the market will head. Instead, it reflects the constellation of RSI, MACD, Stochastic, DM+-, ADX, and moving averages.
Please feel free to express your ideas and thoughts in the comment section.
DISCLAIMER: This analysis is not intended to encourage any buying or selling of any particular securities. Furthermore, it should not be a basis for taking any trade action by an individual investor. Therefore, your own due diligence is highly advised before entering a trade.
