NG1! BUYERS WILL DOMINATE THE MARKET|LONG
NG1! SIGNAL
Trade Direction: long
Entry Level: 3.247
Target Level: 3.717
Stop Loss: 2.932
RISK PROFILE
Risk level: medium
Suggested risk: 1%
Timeframe: 1D
Disclosure: I am part of Trade Nation's Influencer program and receive a monthly fee for using their TradingView charts in my analysis.
✅LIKE AND COMMENT MY IDEAS✅
Techincalanalysis

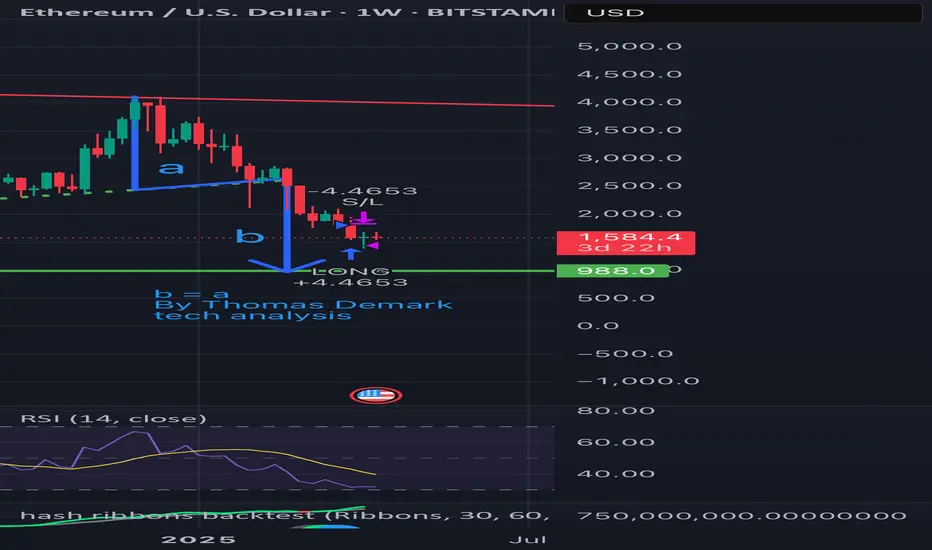
ETH is falling per Demark’s technical analysis: Target at $988?According to Thomas Demark’s method — when b = a, the next target for ETH is around $988.
📉 Price broke the ascending support
🔻 Wave “a” from $4000 to $2500 has already played out
📏 Wave “b” is projected downward — target aligns with a strong historical support zone
📊 Weekly RSI is nearing oversold territory
Conclusion: The $988 area is critical. A reversal may occur there if selling pressure weakens.
Stay sharp.
#ETH #Demark #CryptoAnalysis #TechnicalAnalysis #Ethereum
TradeCityPro | MANAUSDT Fake Breakout Trigger Activated!👋 Welcome to TradeCityPro Channel!
Let’s dive into the analysis of one of the metaverse coins and quickly check the trigger and the action unfolding on its chart together!
🌐 Overview Bitcoin
Before starting the analysis, I want to remind you again that we moved the Bitcoin analysis section from the analysis section to a separate analysis at your request, so that we can discuss the status of Bitcoin in more detail every day and analyze its charts and dominances together.
This is the general analysis of Bitcoin dominance, which we promised you in the analysis to analyze separately and analyze it for you in longer time frames.
📊 Weekly Timeframe
On the weekly timeframe, MANA is one of those coins still oscillating within its range box. After a rejection from the key ceiling at 0.7679, we moved back toward the lower end and continued to fluctuate within our range box.
The candle from two weeks ago attempted to close below the critical support at 0.2484—and it did close below this box’s floor. However, this didn’t trigger a sharp drop; instead, we saw a fake breakout!
A fake breakout occurs when a support or resistance level is breached, but the next candle reverses back above the support or below the resistance. This is often called a fake breakout, and it typically signals a trend reversal or the start of a new trend.
That’s exactly what happened here. After the break, the next candle closed as a strong green candle, returning MANA to its box. This could mark the start of a new trend. You can take this trigger with a stop loss at 0.1722 and capitalize on the potential move!
📉 Daily Timeframe
In the daily timeframe, MANA has continued to show the aftermath of the fake breakout. After the failed attempt to break below 0.2484, the price quickly recovered, with buyers stepping in to push it back into the range box.
The strong green candle that followed the fake breakout confirms the buying pressure, and the price is now testing the upper boundaries of the box. If we see a break above 0.7679, it could signal a strong bullish move. However, caution is needed—failure to break this resistance could lead to another rejection.
For buying, the fake breakout trigger at 0.2484 is active, and you can enter with a stop loss at 0.1722. Confirmation would come from sustained volume and a push above the 50-day moving average. For selling, if we break below 0.1722, it’s a sign to exit, as the downtrend could resume.
✍️ Final Thoughts
Stay level-headed, trade with precision, and let’s capitalize on the market’s top opportunities!
This is our analysis, not financial advice always do your own research.
What do you think? Share your ideas below and pass this along to friends! ❤️

"Gold Demand Zone Bounce – High R:R Long Setup!"📈 This is a bullish setup using a demand zone bounce strategy on the 15-minute timeframe.
Key Zones & Levels
🔵 Demand Zone:
The blue box is where price previously bounced strongly.
Buyers are likely to step in again here.
✳️ Entry Point:
3,292.38
Just above the demand zone – a safe place to catch the next bounce.
⛔ Stop Loss:
3,280.93
Below the demand zone to protect against a breakdown.
🎯 Target Point:
3,345.09
Near a previous resistance area.
Potential gain: +51.94 pts / 1.58%
Indicators
🟡 EMA (7):
Current value: 3,303.63
Price hovering around EMA = consolidation or setup for a bounce.
Risk-Reward Calculation
⚠️ Risk: 11.45 points
✅ Reward: 52.71 points
⭐ Risk-Reward Ratio: ~4.6:1
Very favorable!
Price Action Summary
📊 Strong uptrend into demand zone
🔁 Minor pullback = potential setup
✅ Ideal entry after bullish confirmation (e.g., bullish candle pattern)
Conclusion
This setup looks solid:
✅ Clear demand zone support
✅ High R:R ratio
✅ Clean target above
Just wait for a bullish signal inside the zone and ride it up!

UltraTech Cement Ltd is testing a strong resistance level aroundA breakout above this zone with volume confirmation may trigger a bullish move, making it a buy recommendation if it closes above ₹11,850. The next target would be ₹12,050, with a stop loss at ₹11,690. However, if the price gets rejected at resistance, it could lead to consolidation—so wait for a decisive breakout before entry.
for educational purposes only

Sudarshan Chemical Industries📊 Chart Highlights:
Current Price: ₹1,023
Fibonacci Resistance: Price is approaching the 0.618 Fib level at ₹1,027.60, which is a key resistance.
Box Range: Trading within a consolidation box (approx. ₹940–₹1,030) — currently testing the upper end of the range.
Volume: Volume is moderate; not a strong breakout candle yet.
RSI: Trending upwards, nearing overbought (above 60), positive momentum.
Heikin Ashi Candles: Showing bullish strength.
✅ Recommendation: BUY (on confirmation)
📌 Buy Entry:
Buy above ₹1,035 only on breakout confirmation with volume (i.e., daily close above ₹1,035).
🎯 Targets:
Target 1: ₹1,090 (Fib 0.786 level)
Target 2: ₹1,170 (Fib 1.0 level)
Target 3: ₹1,270 (Fib 1.272 extension)
❌ Stop Loss:
Place SL around ₹980 (just below the Fib 0.5 level and EMA cluster)
⚠️ If Rejected at ₹1,030:
Consider range trading: Sell near ₹1,030 with target ₹940–₹950 and SL ₹1,040.
Wait for a clean breakout or breakdown before taking large positions.

USD/CAD BULLS ARE STRONG HERE|LONG
Hello, Friends!
USD/CAD pair is in the downtrend because previous week’s candle is red, while the price is evidently falling on the 1D timeframe. And after the retest of the support line below I believe we will see a move up towards the target above at 1.418 because the pair oversold due to its proximity to the lower BB band and a bullish correction is likely.
Disclosure: I am part of Trade Nation's Influencer program and receive a monthly fee for using their TradingView charts in my analysis.
✅LIKE AND COMMENT MY IDEAS✅

GBPCAD Technical Analysis! SELL!
My dear subscribers,
GBPCAD looks like it will make a good move, and here are the details:
The market is trading on 1.8356 pivot level.
Bias - Bearish
Technical Indicators: Both Super Trend & Pivot HL indicate a highly probable Bearish continuation.
Target - 1.8184
About Used Indicators:
The average true range (ATR) plays an important role in 'Supertrend' as the indicator uses ATR to calculate its value. The ATR indicator signals the degree of price volatility.
Disclosure: I am part of Trade Nation's Influencer program and receive a monthly fee for using their TradingView charts in my analysis.
———————————
WISH YOU ALL LUCK

"USD/CHF Bearish Reversal Setup – SBR + DBD Zone in Play"🔵 Entry Zone: 0.81698
📍 Located in a SBR + DBD zone
🛑 Acts as resistance where price previously dropped
🔴 Stop Loss: 0.82617
🚫 Above the supply zone for safety
🛡️ Protects against fake breakouts
🟢 Target: 0.78500
🎯 Based on previous support/demand
🧲 High reward potential
Risk/Reward
📉 Risk (SL to Entry): ~91.9 pips
📈 Reward (Entry to Target): ~319.8 pips
⚖️ R:R Ratio: ~3.48 : 1
✅ High potential trade
Indicators
🟡 EMA (7) shows downward trend
📉 Price is moving below EMA – bearish pressure
Trade Plan
🕵️♂️ Wait for price to retest the zone
📉 Look for bearish confirmation (e.g., bearish engulfing)
🔽 Enter short
✅ Secure profits at target or trail stop if price moves in favor

XAU/USD15-Min Chart –Bullish Setup with RBR Zone & Breakout TRG🔷 Chart Structure
* 📊 Ascending Channel
↗️ Price is moving within an upward-sloping channel
• Higher Highs
• Higher Lows
* 🔍 Short-Term Trend: Bullish momentum is intact
🟦 Key Zones
* 🟦 RBR Zone (Rally-Base-Rally)
📌 Support area where buyers stepped in
🔄 Price bounced from this zone
* 🟥 Resistance Zone
🚫 Around 3,250 – sellers previously active here
👀 Watch for breakout confirmation
✅ Trade Setup
* 🎯 Entry Point: 3,226.38
* ⛔ Stop Loss: 3,216.30
* 🥅 Target: 3,267.00
* 💰 Potential Gain: 38.67 points (1.20%)
📊 Risk-Reward Ratio: ~1:3 — very favorable!
📍 Indicators
* 📉 EMA (7) — acts as short-term support
🟡 Price is consolidating near EMA — possible setup for next move.
📌 Outlook
* 🟢 Bullish Bias – As long as price stays above RBR zone
* 🔔 Breakout Alert – A break above resistance may lead to sharp upside move toward the target.

BTCUSD 2024/04/14Scenario BTCUSD TF H4 - Stick to your stop loss to protect your trades - Manage your positions patiently until you hit the target - Profit always in risk, take the risk or lose the chance

"Bitcoin Bearish Reversal Setup: Supply Zone Short Strategy"🔵 SUPPLY ZONE (Resistance Area)
💥 Strong selling area around 85,800 - 87,800 USD
Historically, price got rejected here
Expect sellers to step in again
✍️ ENTRY POINT
📍 Just below the supply zone (~85,889.89)
Ideal for short position setup
Watch for bearish candlestick patterns for confirmation
🛑 STOP LOSS
❌ Placed above the supply zone at 87,796.97
Keeps risk under control if breakout happens
🎯 TARGET POINT (Support Area)
📉 Around 78,000 USD
Marked by previous support and structure
Great Risk-to-Reward ratio
📐 PATTERN WATCH
Looks like a harmonic pattern (maybe Gartley or Bat) 🦇
Suggests reversal from point D
Also resembles a rising wedge, which is bearish
📊 EMA (9-period)
🧭 Price hovering above the 9 EMA (84,704)
A break below it = bearish confirmation
Summary
🔻 Bearish bias
🛒 Short near supply zone
❌ SL above 87,800
🎯 TP around 78,000

$SOL Weekly Bounce from Dynamic Support – Watch for BreakoutCRYPTOCAP:SOL is holding above a key rising trendline that has acted as strong support since 2021. After a successful retest near $95–$100, SOL bounced sharply and is now trading above $120.
This move also confirms a reclaim of a previous resistance-turned-support zone. As long as it holds, SOL could aim for $145 and above.
DYOR, NFA

USD/JPY Bearish Trade Setup – SBR + DBD Zone Rejection📉 Trend Analysis:
🔴 Downtrend confirmed by lower highs and lower lows.
📉 Descending trendline indicates continuous bearish pressure.
🔹 Key Levels & Zones:
🔵 Resistance Zone (SBR + DBD) – 144.123 📍 (Sell Entry Point)
🟠 Stop Loss – 145.209 🚫 (Above resistance to avoid fake breakouts)
🟢 Target Point – 139.694 🎯 (Strong support area)
🏹 Expected Price Action:
🔸 Scenario:
🔺 Price moves up toward the resistance zone (🔵 SBR + DBD Zone)
🔻 Bears take control (Rejection expected)
⚡ Drop towards target at 139.694
📊 Trade Plan:
✅ Entry – Wait for rejection at 144.123 (🔵)
✅ Stop Loss – Keep at 145.209 (🛑🔺)
✅ Take Profit – Aim for 139.694 (✅🎯)
💡 Risk-Reward Ratio: Good (More reward than risk)

"Gold on Fire: Demand Zone Bounce with Bullish Target Ahead! "Key Zones & Levels:
Demand Zone 🔵
Area: 3099.36 – 3110
This is where buyers stepped in strongly before – price bounced up from here twice!
Strong support zone!
Resistance / Mini Consolidation ⚠️
Around 3125 – 3135
Price is hesitating here – needs to break this box for continuation.
Target Point 🎯
Level: 3168.17
Based on previous highs – this is the bullish target zone!
Stop Loss ❌
Level: 3099.36
Placed just below the demand zone to limit losses if price breaks down.
Trade Idea Summary:
Entry Zone: ✍️ 3110–3125
Stop Loss: ❌ 3099.36
Target: 🎯 3168.17
Risk-Reward Ratio: 5:1 ⭐️ (Great setup!)
What to Watch For:
✅ If price holds above demand and breaks the mini consolidation, expect bullish continuation.
❌ If price drops below the demand zone, setup is invalid – risk of further decline.

#NIFTY Intraday Support and Resistance Levels - 11/04/2025Gap up opening near 23000 level expected in nifty. After opening if nifty starts trading above 23050 level then expected further upside rally upto 23250+ level in opening session. Downside 22800 level will act as a strong support for today's session. Any major downside rally only expected if nifty not sustain above level and starts trading below 22750 level.

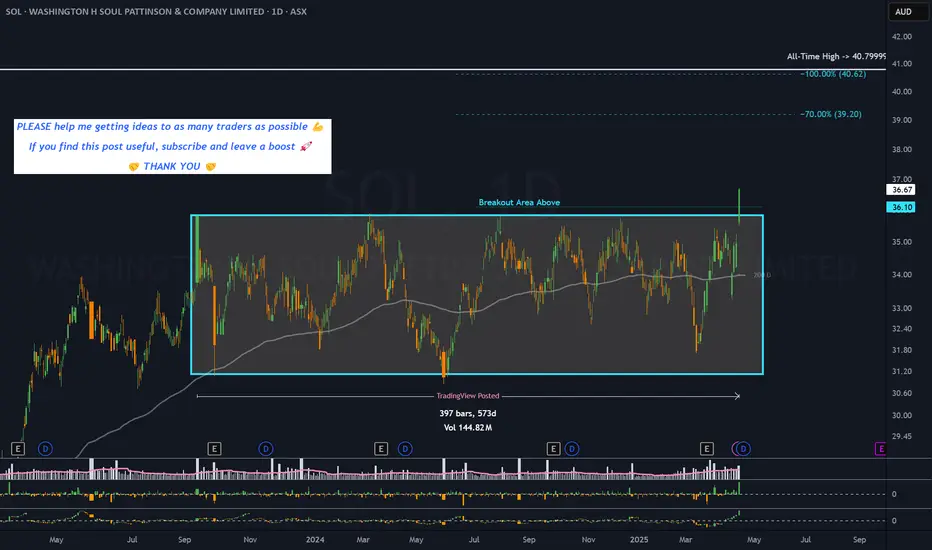
SOL - 19 months RECTANGLE══════════════════════════════
Since 2014, my markets approach is to spot
trading opportunities based solely on the
development of
CLASSICAL CHART PATTERNS
🤝Let’s learn and grow together 🤝
══════════════════════════════
Hello Traders ✌
After a careful consideration I came to the conclusion that:
- it is crucial to be quick in alerting you with all the opportunities I spot and often I don't post a good pattern because I don't have the opportunity to write down a proper didactical comment;
- since my parameters to identify a Classical Pattern and its scenario are very well defined, many of my comments were and would be redundant;
- the information that I think is important is very simple and can easily be understood just by looking at charts;
For these reasons and hoping to give you a better help, I decided to write comments only when something very specific or interesting shows up, otherwise all the information is shown on the chart.
Thank you all for your support
🔎🔎🔎 ALWAYS REMEMBER
"A pattern IS NOT a Pattern until the breakout is completed. Before that moment it is just a bunch of colorful candlesticks on a chart of your watchlist"
═════════════════════════════
⚠ DISCLAIMER ⚠
Breakout Area, Target, Levels, each line drawn on this chart and any other content represent just The Art Of Charting’s personal opinion and it is posted purely for educational purposes. Therefore it must not be taken as a direct or indirect investing recommendations or advices. Entry Point, Initial Stop Loss and Targets depend on your personal and unique Trading Plan Tactics and Money Management rules, Any action taken upon these information is at your own risk.
═════════════════════════════
NZDUSD Long✅ NZD/USD Long Setup
Entry: 0.5520
Stop Loss (SL): 0.5375 (below historical multi-decade support and spike lows — gives room for volatility)
Take Profits (TPs):
TP1: 0.6000 (psychological + historical S/R level)
TP2: 0.6200 (structural supply level)
TP3: 0.6400 (historical resistance zone + cycle high area)

EURUSD: Expecting Bearish Continuation! Here is Why:
Balance of buyers and sellers on the EURUSD pair, that is best felt when all the timeframes are analyzed properly is shifting in favor of the sellers, therefore is it only natural that we go short on the pair.
Disclosure: I am part of Trade Nation's Influencer program and receive a monthly fee for using their TradingView charts in my analysis.
❤️ Please, support our work with like & comment! ❤️

GBPUSD Technical Analysis! SELL!
My dear friends,
Please, find my technical outlook for GBPUSD below:
The instrument tests an important psychological level 1.2924
Bias - Bearish
Technical Indicators: Supper Trend gives a precise Bearish signal, while Pivot Point HL predicts price changes and potential reversals in the market.
Target - 1.2858
About Used Indicators:
Super-trend indicator is more useful in trending markets where there are clear uptrends and downtrends in price.
Disclosure: I am part of Trade Nation's Influencer program and receive a monthly fee for using their TradingView charts in my analysis.
———————————
WISH YOU ALL LUCK

"WTI Crude Oil – Bullish Bounce from Demand Zone? "🔵 . Demand Zone:
⬇️ 60.53 – 59.71
This is the buy zone where bulls are likely to step in!
Price is currently testing this area. Watch closely!
🛑 . Stop Loss (Risk Zone):
📉 Below 59.66
If price falls below here, exit the trade – demand has failed.
🎯 . Target Point:
🚀 63.85
This is the take profit zone. A successful bounce could reach this level!
🟠 . EMA (9-period DEMA):
📉 Currently around 60.86
Price is slightly below EMA, showing short-term bearish pressure.
🟢 . Trade Idea Summary:
• Enter near the blue demand zone
• SL below 🔴 59.66
• TP at 🎯 63.85
• R:R ratio looks favorable (low risk, high reward)
Outlook:
As long as price holds above the demand zone, this setup remains bullish 📈
Let’s see if the bulls can push it to that 63.85 target! 🚀💰


"EUR/JPY Trendline Break & RBR Zone Setup"🔹 Trendline Breakout
* ✍️ A descending trendline was clearly broken
* 📉 This signals a shift from bearish to bullish sentiment
* 🚀 Potential for a strong move upward
🔵 RBR Zone (Rally-Base-Rally)
* 📦 Marked as a demand zone
* 🧲 Price dipped into this zone and bounced — bullish sign!
* ✅ Ideal entry area for long trades
🎯 Target Point: 164.208
* 📈 This aligns with a previous swing high
* 🎯 Potential move: +309.8 pips / +1.92%
* 🥅 Clear bullish target if the momentum holds
🛑 Stop Loss: 160.455
* 🧱 Placed just below the demand zone
* 💡 Gives the trade breathing room
* 🔐 Risk-managed setup
📊 Indicators & Price Action
* 📍 Current Price: 161.443
* 📈 Above the DEMA (9) = Short-term bullish
* 🟢 Price action supports long entry
Summary
* 📌 Bias: Bullish
* 🎯 Target: 164.208
* 🛑 Stop: 160.455
* ⚖️ Risk-Reward: Excellent (R:R ≈ 1:3+)
