ABFRL at Best Support !!This is the Weekly Chart Of ABFRL .
ABFRL having good Law of Polarity at 70 range.
ABFRL having EMA support at 72 range
If this level is sustain , we may see higher price in ABFRL ||
Based on time-wise analysis, our initial expected return is 40–42%, which the stock consistently forms beyond the Law of Polarity (LOP).
Thank You !!
Techincalanalysis

BTCUSD Breakdown Alert | Bearish Momentum Setup in PlayHello traders!
After a strong uptrend, BTCUSD has now broken below the ascending trendline and is retesting from the underside — a classic bearish continuation signal. This could mark a key shift in market structure.
🔍 Key Observations:
Initial consolidation acted as a launchpad for the prior move.
Clean uptrend with higher highs and higher lows.
Recent trendline break suggests weakening bullish momentum.
Price is currently retesting the trendline from below — often a signal of incoming downside if confirmed.
📉 Bearish Scenario:
If this retest holds, BTCUSD may drop toward $105,000, with the next major support around $102,400. A break below that zone could accelerate the downtrend.
Targets / Support levels
Short-term: $105,000
Major support: $102,400
⚠ Risk Management:
Stick to your trading plan — use stop-losses and size positions carefully. No setup is guaranteed. Follow price action, not the hype.
📊 What’s your bias? Bullish or Bearish?
👍 Like & 🔔 Follow for more technical setups!
#CryptoAnalysis #BTCUSD #TrendlineBreak #TechnicalAnalysis #BearishSetup #TradingView #SupportAndResistance #PriceAction

GOLD (XAUUSD) 1H Chart | Bullish Breakout Idea With Key Zones > "Gold is showing strong bullish structure on the 1H timeframe. Price is approaching key breakout zones with momentum building. This idea highlights critical support/resistance levels and potential breakout targets. Watch for confirmation before entry."
This is just idea not a financial advice !

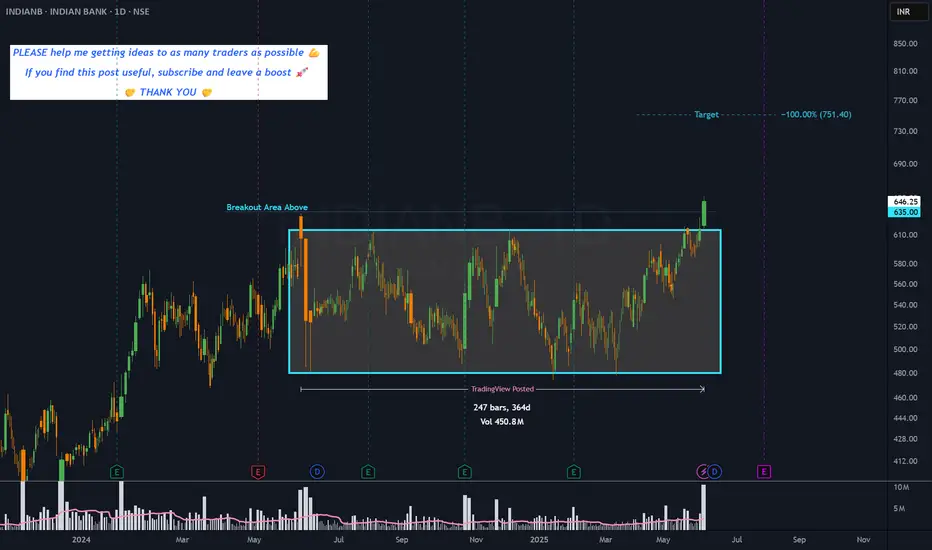
INDIANB - 1 year RECTANGLE══════════════════════════════
Since 2014, my markets approach is to spot
trading opportunities based solely on the
development of
CLASSICAL CHART PATTERNS
🤝Let’s learn and grow together 🤝
══════════════════════════════
Hello Traders ✌
After a careful consideration I came to the conclusion that:
- it is crucial to be quick in alerting you with all the opportunities I spot and often I don't post a good pattern because I don't have the opportunity to write down a proper didactical comment;
- since my parameters to identify a Classical Pattern and its scenario are very well defined, many of my comments were and would be redundant;
- the information that I think is important is very simple and can easily be understood just by looking at charts;
For these reasons and hoping to give you a better help, I decided to write comments only when something very specific or interesting shows up, otherwise all the information is shown on the chart.
Thank you all for your support
🔎🔎🔎 ALWAYS REMEMBER
"A pattern IS NOT a Pattern until the breakout is completed. Before that moment it is just a bunch of colorful candlesticks on a chart of your watchlist"
═════════════════════════════
⚠ DISCLAIMER ⚠
Breakout Area, Target, Levels, each line drawn on this chart and any other content represent just The Art Of Charting’s personal opinion and it is posted purely for educational purposes. Therefore it must not be taken as a direct or indirect investing recommendations or advices. Entry Point, Initial Stop Loss and Targets depend on your personal and unique Trading Plan Tactics and Money Management rules, Any action taken upon these information is at your own risk.
═════════════════════════════
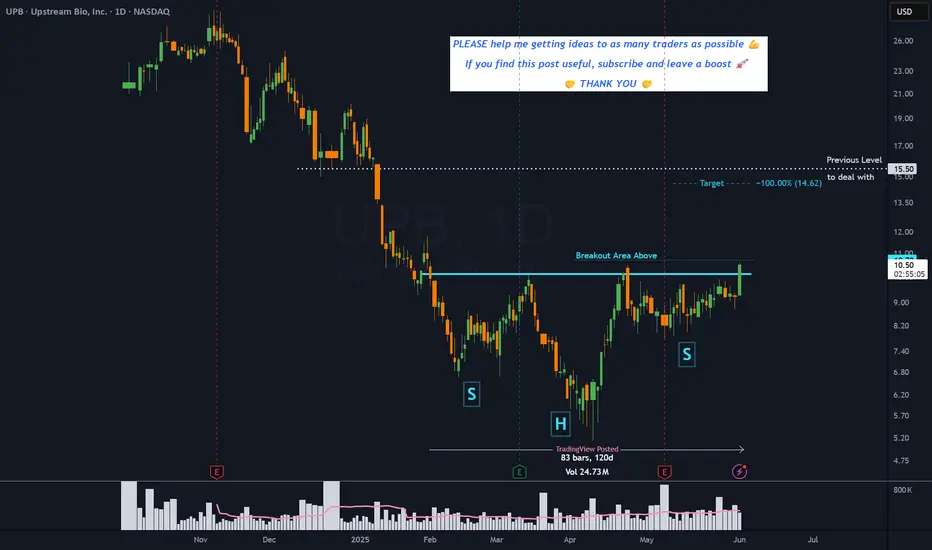
UPB - 4 months HEAD & SHOULDERS══════════════════════════════
Since 2014, my markets approach is to spot
trading opportunities based solely on the
development of
CLASSICAL CHART PATTERNS
🤝Let’s learn and grow together 🤝
══════════════════════════════
Hello Traders ✌
After a careful consideration I came to the conclusion that:
- it is crucial to be quick in alerting you with all the opportunities I spot and often I don't post a good pattern because I don't have the opportunity to write down a proper didactical comment;
- since my parameters to identify a Classical Pattern and its scenario are very well defined, many of my comments were and would be redundant;
- the information that I think is important is very simple and can easily be understood just by looking at charts;
For these reasons and hoping to give you a better help, I decided to write comments only when something very specific or interesting shows up, otherwise all the information is shown on the chart.
Thank you all for your support
🔎🔎🔎 ALWAYS REMEMBER
"A pattern IS NOT a Pattern until the breakout is completed. Before that moment it is just a bunch of colorful candlesticks on a chart of your watchlist"
═════════════════════════════
⚠ DISCLAIMER ⚠
Breakout Area, Target, Levels, each line drawn on this chart and any other content represent just The Art Of Charting’s personal opinion and it is posted purely for educational purposes. Therefore it must not be taken as a direct or indirect investing recommendations or advices. Entry Point, Initial Stop Loss and Targets depend on your personal and unique Trading Plan Tactics and Money Management rules, Any action taken upon these information is at your own risk.
═════════════════════════════
GBP/CAD BEST PLACE TO BUY FROM|LONG
Hello, Friends!
We are now examining the GBP/CAD pair and we can see that the pair is going down locally while also being in a downtrend on the 1W TF. But there is also a powerful signal from the BB lower band being nearby indicating that the pair is oversold so we can go long from the support line below and a target at 1.866 level.
Disclosure: I am part of Trade Nation's Influencer program and receive a monthly fee for using their TradingView charts in my analysis.
✅LIKE AND COMMENT MY IDEAS✅

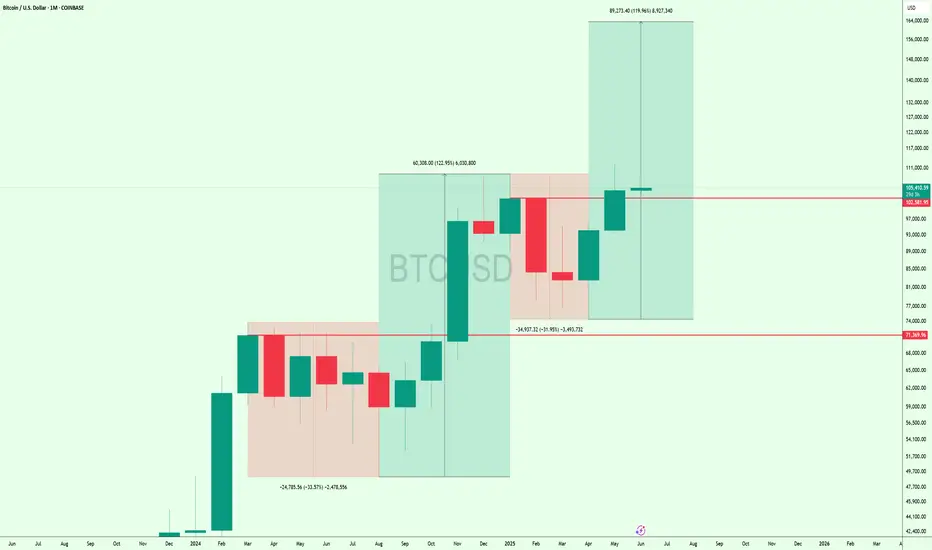
This Is Not a Top – It’s the Beginning of the Mega Bull RunThis is the monthly #Bitcoin chart, and honestly, how can anyone be bearish here?
CRYPTOCAP:BTC just bounced after a -31.95% correction and is now holding strong above the $101K breakout zone.
Last time, a similar setup led to a 122% pump... and this time, we could be looking at a move toward $160K that's 120% upside from here.
We’re likely entering the biggest bull market ever.
Get ready. 🚀
Gold Holding Pattern – Key Resistance AheadHey, friends
On the 4-hour time frame, TVC:XAU is forming a symmetrical triangle pattern, but we haven’t seen any breakout yet, we’re still trading inside the triangle.
If we look at the LTF, we’re currently at the 0.236 FIB level, which isn’t a very strong buying zone, but technically, we’ve broken out of a falling wedge and are now retesting it.
That looks pretty good, and if this setup plays out well, we could see an upward move toward $3,470.
However, there’s a strong resistance around $3,350 to $3,370 that we need to break first. If we break that, it will also confirm the breakout of the symmetrical triangle from the 4-hour chart.
So keep an eye on those areas!
#GOLD #forextrading

SILVER (XAGUSD): Bullish Momentum Continues Silver (XAGUSD) has been showing strong resilience and upward momentum, reinforcing a generally bullish outlook for the near to medium term. Despite recent minor fluctuations, the underlying fundamentals and technical indicators suggest continued potential for price appreciation.
Technical Observations:
Consolidation & Breakout Potential: Silver has been consolidating, forming a base that could lead to a significant breakout.
Support Levels : Monthly Key support around the $28.00 - $29.00 zone has proven robust, suggesting strong buying interest on dips.
One-Month Chart Perspective: On a one-month chart, you would typically observe the broader trend and significant long-term support/resistance zones. Given the bullish outlook, the one-month chart would likely show a series of higher lows and potentially higher highs, indicating sustained upward momentum. Look for strong monthly closing candles above key psychological levels, which would reinforce the bullish sentiment and suggest continued strength into the next month. Any pullbacks on this timeframe would ideally find support at previous resistance levels, which then act as new support.
Key Price Targets and Predictions (as of late May/early June 2025):
Based on various analyst forecasts and market models, here are some notable price targets for silver:
Short-Term (Q2 2025): Expectation around $33.79 - $34.00 per troy ounce.
Mid-Term (Next 12 months / End of 2025):
Analysts generally forecast targets ranging from $36.00 to $40.00 per ounce.
Some more optimistic predictions reach towards $48.00 - $50.00 per ounce.
Longer-Term (2026-2030): Some projections see silver potentially reaching $75.00 - $80.00 per ounce.
Driving Factors:
Industrial Demand: The increasing adoption of green technologies (solar panels, EVs) continues to drive significant industrial demand for silver.
Safe-Haven Appeal: Ongoing global economic uncertainties and geopolitical tensions enhance silver's role as a safe-haven asset.
Supply Deficits: Persistent supply shortfalls in the silver market are expected to provide upward price pressure.
Monetary Policy: Potential interest rate cuts could make non-yielding assets like silver more attractive.
Strategy:
Maintain a bullish bias while closely monitoring key support and resistance levels. A decisive break above current resistance could confirm further upside.
Disclaimer: This is not financial advice. Trading involves risk, and past performance is not indicative of future results. Always do your own research and consult with a financial professional before making any investment decisions.

BITCOIN BULLS WILL DOMINATE THE MARKET|LONG
BITCOIN SIGNAL
Trade Direction: long
Entry Level: 104,686.94
Target Level: 111,091.02
Stop Loss: 100,407.14
RISK PROFILE
Risk level: medium
Suggested risk: 1%
Timeframe: 9h
Disclosure: I am part of Trade Nation's Influencer program and receive a monthly fee for using their TradingView charts in my analysis.
✅LIKE AND COMMENT MY IDEAS✅

GBP/AUD SENDS CLEAR BEARISH SIGNALS|SHORT
Hello, Friends!
Previous week’s green candle means that for us the GBP/AUD pair is in the uptrend. And the current movement leg was also up but the resistance line will be hit soon and upper BB band proximity will signal an overbought condition so we will go for a counter-trend short trade with the target being at 2.041.
Disclosure: I am part of Trade Nation's Influencer program and receive a monthly fee for using their TradingView charts in my analysis.
✅LIKE AND COMMENT MY IDEAS✅

Understanding Market StructureIn this video, I break down market structure in a simple and easy-to-digest way, helping you understand how to identify whether the market is in an uptrend or downtrend.
Recognizing market direction is a key skill for any trader, it allows you to trade in alignment with price action and make more confident, higher-probability decisions.
✅ If you're new to trading or want to sharpen your edge, this video will give you the insights needed to read market trends more clearly.
📈 Hope you find value in this breakdown!
👉 Don’t forget to like, comment, and subscribe to support the channel and stay tuned for more educational content.

GBPUSD Bearish Setup | Trend Reversal Setup in Progress...📉 Technical Outlook _
After a strong bullish rally within a parallel ascending channel, GBP/USD is now showing signs of potential reversal. Price action recently broke out of the channel and is failing to reclaim upward momentum, indicating that buyers may be losing control.
🔍 Key Observations:
🟪 Previous Consolidation led to the breakout
📈 Strong bullish structure inside the parallel channel
❌ Price has now exited the channel, with clear signs of rejection near 1.347x
📉 Bearish pattern projecting a potential drop to the support zone at 1.31521
⚠ Watch for This Bearish Scenario:
1. Liquidity grab or false breakout above short-term highs
2. Strong sell-off as momentum fades
3. Clean bearish continuation pattern toward 1.3150 support
✅ Bearish Confluences:
Breakdown from parallel channel
Series of lower highs forming
Weak recovery attempts
Clear downside target with prior support zone structure
🔷 Note: Keep an eye on macro news and USD strength before executing. This is a technical setup with potential, not a guarantee.
📊 What’s your bias? Bullish or Bearish? 👍 Like & 🔔 Follow for more technical setups!

Breakdown Alert: Crypto Market Cap Tests Major Demand ZoneThe total crypto market cap is testing a key support zone around $3.23T. This area has acted as a demand zone in the past, and now price is hovering right above it.
The current structure suggests a possible breakdown–retest–continuation setup. If price retests this zone from below and fails to reclaim it, further downside toward $3.0T could be likely.
This idea is based on price action and structure only — no indicators used.
❗ This is a personal analysis for educational purposes only. Not financial advice.
Feel free to share your thoughts or technical perspective in the comments

NZDUSD Trading Opportunity! BUY!
My dear friends,
NZDUSD looks like it will make a good move, and here are the details:
The market is trading on 0.5954 pivot level.
Bias - Bullish
Technical Indicators: Supper Trend generates a clear long signal while Pivot Point HL is currently determining the overall Bullish trend of the market.
Goal - 0.5969
About Used Indicators:
Pivot points are a great way to identify areas of support and resistance, but they work best when combined with other kinds of technical analysis
Disclosure: I am part of Trade Nation's Influencer program and receive a monthly fee for using their TradingView charts in my analysis.
———————————
WISH YOU ALL LUCK

SOL/USDT"Solana, like the other two coins, is also poised for growth and is currently in the best possible position. What do you think, my friend? Do you think Solana can go up?

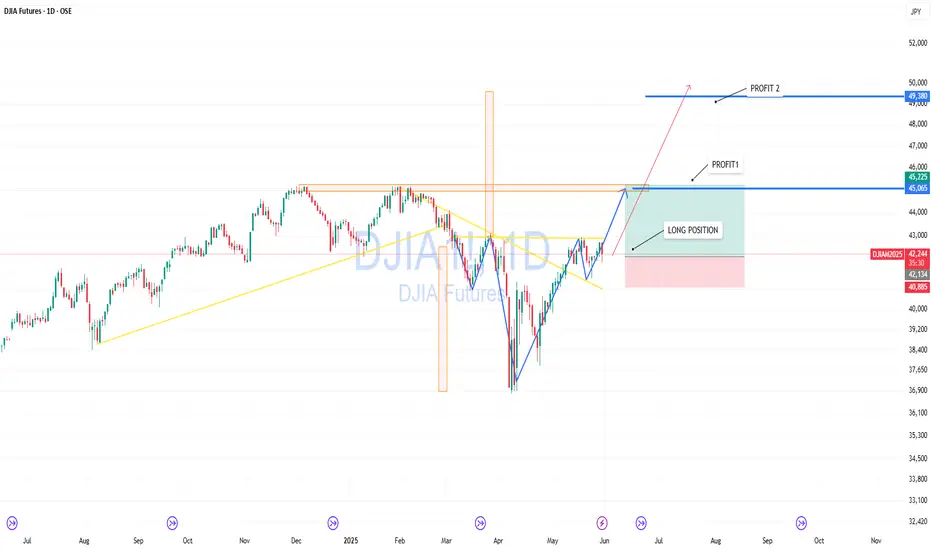
DJIA — Setting Up for Breakout and New ImpulseThe Dow Jones Index is approaching a critical resistance zone. After a deep V-shaped recovery and clear bullish structure, price is preparing for a breakout.
Chart shows a clean long entry with a stop below the recent consolidation. A break and hold above 45,000 could lead to a move toward 46,000, and if momentum holds — up to 49,300.
Partial profit-taking levels:
— Target 1: 45,225
— Target 2: 49,380
Fundamentally, US equity markets remain strong, and DJIA may play catch-up after lagging during the last correction.
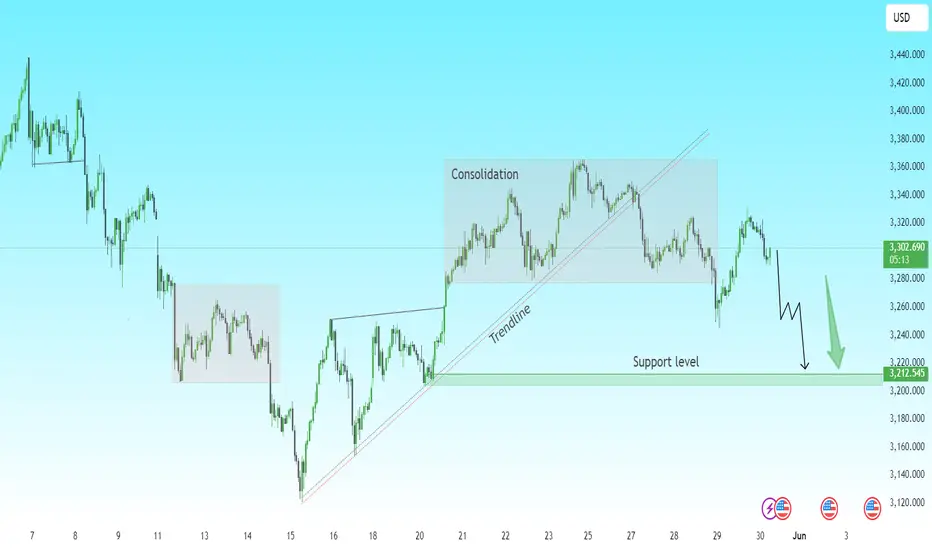
Gold Breakdown Setup | Key Support Test IncomingThe market recently broke below a rising trendline and exited a consolidation zone, signaling potential weakness.
📉 After the breakdown, price formed a lower high and is now retesting the 3,290–3,300 zone. If this minor resistance holds, we could see further bearish continuation.
🔷 Key Level to Watch:
Support around 3,212 — this is a major area where price previously reacted.
📉 Scenario:
Expecting a rejection from current levels, leading to a potential move toward the support zone. If 3,212 breaks, it may open doors to even lower targets.
💡 Trade Idea:
Wait for a confirmation (bearish structure) near the retest area. If confirmed, consider short setups with target around the support level.
✅ Always use proper risk management and confirm with your own analysis
$BUSDT Ready to Explode? Breakout Could Send It Flying#BUSDT is demonstrating strong potential for a pennant breakout.
A successful breakout could trigger a +60% bullish rally in the coming days. 🚀
#Altseason2025

#XRP MARKET STRUCTURE | DAILY OUTLOOK | MAY 2025📊 *XRP - Strong Support & Breakout Watch | Daily Timeframe*
XRP is currently holding above a major support zone around the 102B market cap level. Price has shown multiple rejections from this zone, indicating strong buying interest.
🔹 *Key Levels:*
- *Support Zone:* 102B (Strong Demand Area)
- *Resistance Zone:* 147B (Breakout Level)
📈 *Market Structure:*
Price is forming a potential accumulation pattern. If this structure holds, we might see a bullish reversal towards the resistance, followed by a possible breakout.
📌 *Bullish Scenario:*
- Bounce from support
- Retest of previous high
- Breakout above resistance
📌 *Invalidation:*
- If price closes below 102B support zone, setup may fail and a deeper drop could follow.
🧠 *Note:* This is not financial advice. Always do your own analysis before trading.
#XRP #CryptoAnalysis #TechnicalAnalysis #Breakout #SupportResistance

WATCH OUT FOR VERITASKAPFrom around 0.83, VERITASKAP created an all-time high of around 1.81. This happened between August 2024 and September 2024. Then, price dropped into the discount level where is currently. The current price action shows that price is in a discount level, at a demand zone and within a falling wedge.
From a chart pattern perspective, falling wedge can be seen on the chart and a break out of the downtrend and resistance level around 1.06 with a bullish candle closing above these levels will serve as a strong indication that the stock is ready to rally up as much as the all-time high.
From a technical indicator perspective, awesome oscillator is below 0, showing that the stock is oversold. In addition, there is a bullish indication on the awesome oscillator as shown by its colour and upward movement. This is pointing to the fact that the value of the awesome oscillator is moving towards 0 and can cross over it which can be a good indication for a rise in price as well.
From a smart money concept perspective, a break of the last high (around 1.27) that led to the last bearish internal break of structure will as serve as indication of a bullish trend. Hence, the target will the all-time high.
Either way, the stock has a good potential. An aggressive trader or investor may buy at the current market price. While a conservative trader or investor may wait for a breakout.
Watch out for the confluences indicating potential rise in price so as to not miss out on the benefit.

ETHUSD - Consolidation Zone Analysis | Watch $2700 Breakout📊 Ethereum (ETHUSD) is currently trading within a consolidation zone between key support at $2458 and resistance near $2720 on the 1H timeframe.
🔹 Breakout above $2700 could indicate potential bullish momentum continuation.
🔻 Breakdown below $2450 may suggest bearish sentiment gaining control.
The price has been moving sideways, showing indecision and reduced volatility. Traders often monitor such range-bound phases for potential breakout opportunities in either direction.
⚠ This chart is for educational and analytical purposes only. It is not financial advice. Always do your own research and risk management.
---
🔖 Key Levels:
• Resistance: $2720
• Support: $2458
• Bearish zone under: $2500
#ETHUSD #Ethereum #CryptoAnalysis #TechnicalAnalysis #TradingView #PriceAction

MAXHEALTHCARE - Could Breakout from DTHMAXHEALTHCARE has resistance weakening on the Daily charts and may give a breakout with good volume in coming days.
The target of this pattern signals an upside potential of 15% from the current price level in the medium term.
The stock is trading above its 50- and 100-day exponential moving averages (EMAS) recently. Look for the range to more than 1.5X, and the Volume 1.5X the average.
CMP- Rs. 1149
Entry Price- 1200
Target Price- Rs1380 (15% upside)
SL- 1142
Need to wait for the entry to get triggered.
Disclaimer: This is not a buy/sell
recommendation. For educational purpose only. Kindly consult your financial advisor before entering a trade.
