$RDAR - Massive Weekly Slingshot, 1000x Potential RunnerWeekend scan continues to find the best candidates into this 8 year cycle - OTC:RDAR , wow is all I can say, this has massive potential once it breaks into sub territory with volume. The hype is in the AI buzz and the constant awareness for their product in the media.
Raadr Inc. (OTC: RDAR), also known as Telvantis Inc., is a U.S.-based technology company specializing in AI-driven software solutions aimed at combating cyberbullying and online harassment. The company offers tools for real-time monitoring of social media and digital platforms, targeting parents, schools, and law enforcement agencies.
If we learned anything about share structures with bloated OS/AS, it won't mean a damn thing once this sling gets going to the upside - remember how HMBL/ENZC/SNPW, had massive floats and still ran from trips to dollars... I got that itchin' feelin' again, taking a starter Monday and will add on momentum into the sling.
Techincalanalysis

DXY OUTLOOK BEFORE FOMC | Will the Dollar Break Trend DXY OUTLOOK BEFORE FOMC | Will the Dollar Break Trend or Just Retrace?
The US Dollar Index (DXY) has rebounded after weeks of relentless selling pressure, but this bounce is now approaching key decision zones just ahead of two critical events: the April PCE report and the next FOMC meeting. With macro data and sentiment diverging, traders should closely monitor how the dollar reacts to upcoming catalysts.
🌍 MACRO & FUNDAMENTAL CONTEXT
Core PCE Price Index (Apr) – due Friday – is the Fed’s preferred inflation gauge. A higher-than-expected print may reinforce the “higher for longer” stance on rates.
FOMC Minutes revealed a growing divide within the committee: some members remain open to further tightening if inflation stalls.
Bond market stress is emerging again, as 10Y yields hover near 4.5%. Fiscal concerns and treasury auctions are weighing on investor sentiment.
Political noise – particularly from former President Trump’s shifting tariff threats – adds short-term volatility to USD expectations.
🧠 Bottom line: While the dollar has regained ground, macro risks remain asymmetric. A hot PCE may spark short-term demand for USD, but structural credibility risks are still on the table.
📊 TECHNICAL INSIGHT – H1 STRUCTURE
Price Channel: DXY broke slightly above a well-respected descending channel that started mid-May.
EMA Confluence: EMA 13, 34, and 89 are beginning to align upward but haven’t fully confirmed a bullish trend yet.
Key Retest Zone: 99.08 is a critical zone — a Fibonacci 38.2% level of the recent breakout. A hold here may support another test higher.
🔑 KEY TECHNICAL LEVELS
Immediate Support: 99.08 (Fib 38.2% + channel retest)
Mid Resistance: 100.02 (round number + previous structure high + near 200 EMA)
Major Target Zone: 100.48 (Fib 61.8% + multi-day pivot)
📈 POTENTIAL PRICE SCENARIOS
If DXY respects 99.08, a continuation toward 100.02 and even 100.48 is plausible as a technical correction.
If DXY fails to hold 99.08, the breakout above the trend channel may turn into a false break, opening the door for a re-test of lower channel support near 98.30.
Watch for price behavior around 100.02 — aggressive sellers may re-enter at this level, especially if macro data disappoints.
⚠️ STRATEGIC REMINDER
Avoid chasing mid-range price action.
Let the market reveal its hand post-PCE.
Volatility is expected to spike — be patient and let key levels define directional conviction.

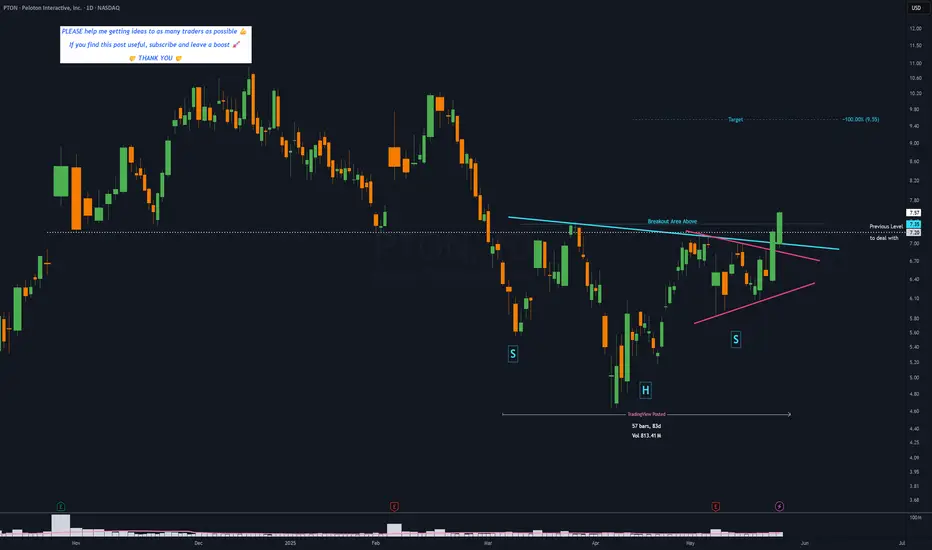
PTON - 3 months HEAD & SHOULDERS══════════════════════════════
Since 2014, my markets approach is to spot
trading opportunities based solely on the
development of
CLASSICAL CHART PATTERNS
🤝Let’s learn and grow together 🤝
══════════════════════════════
Hello Traders ✌
After a careful consideration I came to the conclusion that:
- it is crucial to be quick in alerting you with all the opportunities I spot and often I don't post a good pattern because I don't have the opportunity to write down a proper didactical comment;
- since my parameters to identify a Classical Pattern and its scenario are very well defined, many of my comments were and would be redundant;
- the information that I think is important is very simple and can easily be understood just by looking at charts;
For these reasons and hoping to give you a better help, I decided to write comments only when something very specific or interesting shows up, otherwise all the information is shown on the chart.
Thank you all for your support
🔎🔎🔎 ALWAYS REMEMBER
"A pattern IS NOT a Pattern until the breakout is completed. Before that moment it is just a bunch of colorful candlesticks on a chart of your watchlist"
═════════════════════════════
⚠ DISCLAIMER ⚠
Breakout Area, Target, Levels, each line drawn on this chart and any other content represent just The Art Of Charting’s personal opinion and it is posted purely for educational purposes. Therefore it must not be taken as a direct or indirect investing recommendations or advices. Entry Point, Initial Stop Loss and Targets depend on your personal and unique Trading Plan Tactics and Money Management rules, Any action taken upon these information is at your own risk.
═════════════════════════════
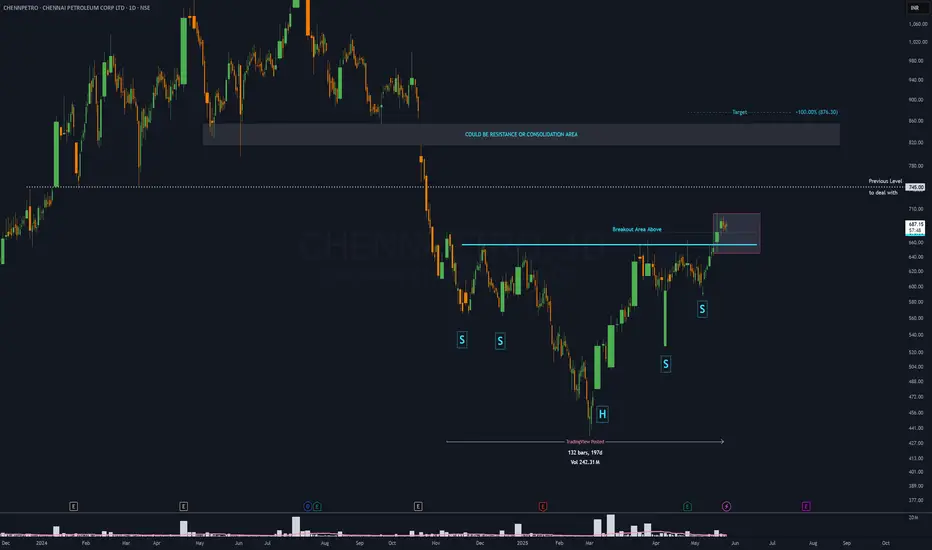
CHENNPETRO - 7 months DOUBLE HEAD & SHOULDERS══════════════════════════════
Since 2014, my markets approach is to spot
trading opportunities based solely on the
development of
CLASSICAL CHART PATTERNS
🤝Let’s learn and grow together 🤝
══════════════════════════════
Hello Traders ✌
After a careful consideration I came to the conclusion that:
- it is crucial to be quick in alerting you with all the opportunities I spot and often I don't post a good pattern because I don't have the opportunity to write down a proper didactical comment;
- since my parameters to identify a Classical Pattern and its scenario are very well defined, many of my comments were and would be redundant;
- the information that I think is important is very simple and can easily be understood just by looking at charts;
For these reasons and hoping to give you a better help, I decided to write comments only when something very specific or interesting shows up, otherwise all the information is shown on the chart.
Thank you all for your support
🔎🔎🔎 ALWAYS REMEMBER
"A pattern IS NOT a Pattern until the breakout is completed. Before that moment it is just a bunch of colorful candlesticks on a chart of your watchlist"
═════════════════════════════
⚠ DISCLAIMER ⚠
Breakout Area, Target, Levels, each line drawn on this chart and any other content represent just The Art Of Charting’s personal opinion and it is posted purely for educational purposes. Therefore it must not be taken as a direct or indirect investing recommendations or advices. Entry Point, Initial Stop Loss and Targets depend on your personal and unique Trading Plan Tactics and Money Management rules, Any action taken upon these information is at your own risk.
═════════════════════════════
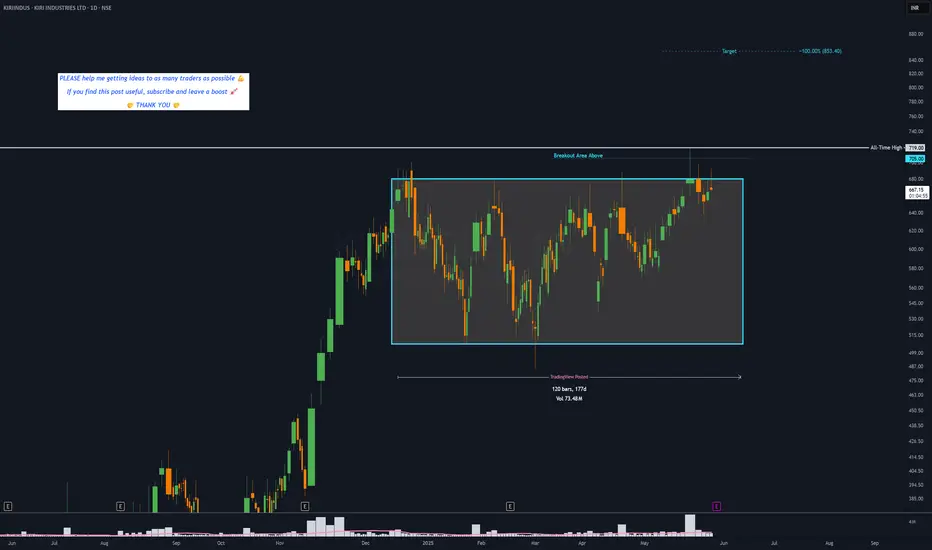
KIRIINDUS - 4 months RECTANGLE══════════════════════════════
Since 2014, my markets approach is to spot
trading opportunities based solely on the
development of
CLASSICAL CHART PATTERNS
🤝Let’s learn and grow together 🤝
══════════════════════════════
Hello Traders ✌
After a careful consideration I came to the conclusion that:
- it is crucial to be quick in alerting you with all the opportunities I spot and often I don't post a good pattern because I don't have the opportunity to write down a proper didactical comment;
- since my parameters to identify a Classical Pattern and its scenario are very well defined, many of my comments were and would be redundant;
- the information that I think is important is very simple and can easily be understood just by looking at charts;
For these reasons and hoping to give you a better help, I decided to write comments only when something very specific or interesting shows up, otherwise all the information is shown on the chart.
Thank you all for your support
🔎🔎🔎 ALWAYS REMEMBER
"A pattern IS NOT a Pattern until the breakout is completed. Before that moment it is just a bunch of colorful candlesticks on a chart of your watchlist"
═════════════════════════════
⚠ DISCLAIMER ⚠
Breakout Area, Target, Levels, each line drawn on this chart and any other content represent just The Art Of Charting’s personal opinion and it is posted purely for educational purposes. Therefore it must not be taken as a direct or indirect investing recommendations or advices. Entry Point, Initial Stop Loss and Targets depend on your personal and unique Trading Plan Tactics and Money Management rules, Any action taken upon these information is at your own risk.
═════════════════════════════
SMCI LONG IDEASMCI broke out of a downtrend and support level with a strong weekly bullish candle. This is a signal that the stock is ready for appreciating in value. The first signal was in November 2024 when there was a divergence on awesome oscillator. This was followed by a breakout of down trend line in February 2025, which made price to move from around 36 to around 66.
Currently, price is showing a strong momentum to rally up again. With a pullback to the key level, the best time to buy the stock is at current price or between 38 and 40. An aggressive trader/investor could have when the previous weekly candle closed bullish, while a conservative trader/investor would have waited for the pullback to the key level which is what's happening at the moment.
The entry is around 38 and 40 while the stop could be 25 and the target can be 66 and 119.
Confluences for the signal:
1. Price broke out of a down trend line and closed with a strong weekly bullish candle.
2. Price also closed above a support level.
3. Price was coming from a strong support level.
4. Awesome oscillator is still below 0 and it's just resuming bullish region.
Disclaimer: this is not a financial advice. The outcome maybe different from the projection. If you can't accept the risk, don't take the signal.

GME LONG IDEA GME has been in a downtrend for a while. The first signal for long was in April 2024 when price was in an oversold region and there was a divergence on the awesome oscillator. This was followed by a breakout of downtrend. From around 16, price went up to 64.
The current price action shows that price is about to rally up again. A weekly bullish candle closing above 30 is a good signal for a long. Price has broken out of a downtrend and support level, closing above these key levels is a good signal to target the high. An aggressive trader or investor may buy at a current price. While a conservative trader may wait for price to close and buy the following week or wait for price to retrace to the support level before placing the buy. To spread risk, one can buy at the current price, add more positions when price retraces to the key level. This will save from missing out and also balance the risk.
Entry could be at current price or 30 while the target can be 48 or 65.
The confluences for the buy are as follows:
1. Downtrend breakout with a weekly bullish candle closing above it.
2. Price respecting uptrend
3. Awesome oscillator resuming bullish momentum
4. Price breaking out of support level.
Disclaimer: this is not a financial advice. The outcome maybe different from the projection. If you can't accept the risk, don't take the signal.

Equity Research Flash – BEML Ltd.CMP: ₹3,242.10 | Breakout From Falling Trendline
BEML has decisively broken out of a falling trendline and is now sustaining above a key consolidation zone. With strong bullish candles, a rising RSI, and healthy volume spike, the stock signals bullish momentum. Immediate resistance lies at ₹3,420–₹3,480. Sustained move above could target ₹3,750+. 20/50 EMA crossover supports the upward trend. Traders may consider entries on dips with SL near ₹3,080.
For educational purposes only

Apple losing $3Trillion clubNASDAQ:AAPL lost a fair amount of market share this week.
Coming under pressure from comments by Trump and tarrif news.
Apple seems to be a target for the president despite him answering a call on live TV today using an Iphone...kinda ironic.
Apple could easily chop in this 9% range before it makes a definitive move.
I lean more bullish since we're testing the lows of the trade range.
If Apple holds here it could be forming a right shoulder for a very bul,ish inverse head and shoulder pattern.

BITCOIN 5 lines and 3 indicators to watch now we in new ground
I will be presenting a number of charts here and each has a different story to tell right now.
The 5 lines are All valid trend lines.
The Vertical lines are January year markers
The white line at the bottom is th e long term support line from 2013
The Dotted line is a threshold line
The Blue Arc is a line that has rejected EVERY ATH since 2013
The orange line is a marker that, once crossed has Always led to a New cycle ATH
The upper dashed line is the line of rejection of all ATH since 2017
The Weekly Bitcoin PA chart
Here we can clearly see how that Blue Arc has rejected PA previously. We can see how PA has reached a point of intersection and once it crosses that blue Arc, there is a line of rejection just above.
This Blue line needs to be crossed and held as support.
The Daily version of this chart shows ua how we have just crossed that blue Arc.
It also shows us how FRAGILE this is right now. PA is currently testing that Blue line as support
This needs to Hold. If we manage to hold this line and bounce, Stiff resistance is found around 120K
The following charts are showing the following indicators
The 3 indicators used are
RSI - Relative Strength Index. used to measure the speed and change of price movements
TSI - True Strength Index, used to indicate trend direction and overbought/oversold conditions.
ADX - The Average Directional Index (ADX) is used to measure the strength of a trend, not its direction
The 4 hour chart - short term expectations for the weekend
Bitcoin PA the Yellow line at the Top, the indicators are in the order listed above,
First thing to see here is how BTC PA is retesting that Blue Arc - this really needs to hold
RSI (blue) - OVER BOUGHT, It has fallen below its own MA ( average) and could easily drop further today. Looking back along this, we can see how the 4 hour RSI likes to range along the Neutral line, so we may see it drop back to that level today, tomorrow
TSI is also OVER BOUGHT. We can see when TSI is up here, PA ranges while it cools off. But there is room for one little push here if required
ADX ( yellow ) is high showing trend could be getting near exhausted, The orange line is the DI+. This shows positive prince direction, the Red one is DI- and shows that negative price direction is climbing slightly.
In the short term, we need to see PA hold above the Blue line but the likelihood is to possibly back below. There is support below.
The WEEKLY shows us that PA has the ability to continue for a while longer but we are getting near a point where PA needs to recover
Here we can see how the RSI and TSI are both up high, on the edge of OVER BOUGHT but with the ability to rise further.
What is VERY important to take note of here is that ADX.
It is Low, this is indicating that the weekly Trend has lost strength now. It could continue lower.
Remember, ADX DOES NOT SHOW TREND DIRECTION, JUST STRENGTH
So, the thing to see here is that we are in an area where we could see a New Trend begin. This trend could be either Bullish or bearish
On a weekly chart, this change can take a long time to appear in PA
And for the Longer Term, The Monthly Chart gives us hope for a fuhrer push higher for the rest of the year but one little warning bell
WE See Both RSI and TSI up high again, where they have been since 2024. But neither of them are up in OVER BOUGHT as much as they have been in previous cucle Tops.... So we can assume room to move higher.
But what does ring a bell is that ADX again. It is once again, in a place of Change and on this chart, showing that the current trend can start becoming weaker. However, DI+ has plenty of room to move higher
So, in conclusion, we see that BITCOIN has the ability to continue higher but in the short term, we may see a pause and possinle Volatility
Trends are about to change, This could take Weeks and PA can continue higher while a trend weakens.
For me. we are in the last few months of this cycle and at a point of Decision.
PA MUST get over that Blue Arc that has rejected Every ATH since 2013.
If PA fails this, we go back to sub 90K but this is unlikely,
There are numerous projections that see BTC PA in price discovery reaching the 120K before serious resistance.
On this chart, if PA follows pattern and trends, we could see 378K by year end
Getting over that irange line is KEY
Stay safe everyone.

EUR/CAD SENDS CLEAR BEARISH SIGNALS|SHORT
EUR/CAD SIGNAL
Trade Direction: short
Entry Level: 1.567
Target Level: 1.549
Stop Loss: 1.579
RISK PROFILE
Risk level: medium
Suggested risk: 1%
Timeframe: 12h
Disclosure: I am part of Trade Nation's Influencer program and receive a monthly fee for using their TradingView charts in my analysis.
✅LIKE AND COMMENT MY IDEAS✅

[INTRADAY] #BANKNIFTY PE & CE Levels(22/05/2025)Today, a flat opening is expected in Bank Nifty. After opening, if Bank Nifty starts trading below the 54950 level, a further downside movement is possible towards the 54750, 54650, and 54550 levels during the session.
On the upside, if Bank Nifty begins to trade and sustain above the 55050–55100 zone, it could trigger a bullish move toward 55250, 55350, and potentially 55450+.
However, 55450 will act as a strong resistance for today’s session — any upside rally may face rejection or reversal from this level.
Trade with strict stop loss and keep trailing profits as market can remain range-bound with spikes.

NZD/USD TRADING PLAN – MAY 21 | RETEST OR CONTINUATION?NZD/USD TRADING PLAN – MAY 21 | RETEST OR CONTINUATION? 🔍
After several steady bullish sessions, NZD/USD is pulling back slightly from the 0.5961 resistance zone. The pair remains within a well-defined ascending channel on the H1 chart and is approaching a key support area around 0.5910 — a zone that could trigger a technical bounce and continuation of the current bullish trend.
🌍 MACRO CONTEXT:
The US Dollar Index (DXY) is showing signs of weakness following disappointing CPI and PPI data. This opens up room for commodity currencies like NZD to recover further.
Meanwhile, New Zealand's domestic consumption data has exceeded expectations, and the RBNZ continues to maintain a stable policy outlook — a medium-term bullish sign for NZD.
Market sentiment is leaning cautiously against the USD, especially as the Fed holds its “no cut but no hike” stance — boosting interest in alternative currencies.
📊 TECHNICAL OUTLOOK (H1):
NZD/USD is trading within an ascending price channel.
EMA 13 is above EMA 34 and EMA 200 — a positive short-term trend signal.
Two important zones to watch today are 0.5910 (key support) and 0.5961 (key resistance).
🎯 TRADE SETUPS FOR TODAY:
✅ SCENARIO A – BUY THE RETEST:
If price tests the 0.5910 zone and shows strong reaction:
BUY ZONE: 0.5910 – 0.5915
SL: 0.5890
TP: 0.5960 → 0.5980 → 0.6000 → 0.6006
→ This zone aligns with ascending channel support + prior FVG → strong rebound probability.
✅ SCENARIO B – BREAKOUT & CONTINUATION:
If price breaks and holds above 0.5961:
BUY SCALP: 0.5965 – 0.5970
SL: 0.5950
TP: 0.5980 → 0.6000 → 0.6006
❌ SCENARIO C – BEARISH BREAKDOWN:
If price fails to hold above 0.5910 and closes H1 candle below it:
SELL SCALP: 0.5900 – 0.5895
SL: 0.5915
TP: 0.5870 → 0.5850 → 0.5820
📌 FINAL THOUGHTS:
NZD/USD is at a critical decision point — this could be a retest before continuation to 0.6000 or the beginning of a deeper drop.
Watch the 0.5910 level closely to determine market direction.
⚠️ Risk management is key — high volatility expected as U.S. PMI data is set for release during today’s NY session.
🧠 Be patient. Let price come to your zone. React, don’t predict.

US30 May 21 If athletes get athlete's foot, what do elves get? Mistle-toes.
Now let's get to it. Before heading into the trade, I am definitely bullish. Price seems to be making a retracement before it pushes back up. I have given myself 3 potential entry points. But I am only going to enter them if:
Price makes market structure
Price breaks and retests through a key level/ entry point
If it bounces off of the trend line
Or a break of structure
And all of this, for me has to happen around 12pm est because I like to trade the afternoon session. But like a stallion price is going to do whatever it wants.
Stay safe and be patient
Rising wedge on SPY - Melt up? or Next leg down? Immediate Bias (Tomorrow):
Scenario 1 – Bullish Continuation (Low Probability unless there's a macro catalyst):
Breaks above ~$596–$598 cleanly
Retests that zone as support (watch 595.50 intraday)
Then targets:
600 psychological
604–608 upper resistance channel
Possible end-of-month blow-off top: 612–618
Scenario 2 – Pullback / Rejection (More Probable Setup):
Rejected at ~596–597 zone (which aligns with upper wedge resistance)
Breakdown below $590 intraday
Then targets:
587.80 EMA cluster (20/50)
If lost → 576.44 next EMA + demand level
Followed by major support at 565.87 / 563.43
🔥 Week Ahead Trade Plan (May 20–24)
✅ Bullish Possibility:
If NVDA earnings, FOMC minutes, or macro data surprise to the upside
Watch for breakout above the red wedge and hold above 600
Target range: 604 → 612 max upside
🚨 Bearish Scenario:
Wedge breakdown below ~$590
Momentum cracks down to:
587
576 (watch for bounce)
If panic selling → 565–563 (larger time frame buying zone)
Volume divergence and overbought EMAs support a potential cool-off.
📅 Monthly Projection (End of May):
If wedge breaks down → consolidation range between 563 – 587
If wedge breaks out → blow-off rally up to 612–620, but likely to fade quickly
Fed commentary and NVDA earnings on May 22 will be major catalysts
📌 Key Levels
Type Price Notes
Resistance (R3) 612–618 Final upside blow-off zone (channel top)
Resistance (R2) 604 Overhead channel line
Resistance (R1) 595–598 Wedge top + major resistance
Support (S1) 587 EMA cluster + strong local demand
Support (S2) 576 Clean structure + prior breakout
Support (S3) 565–563 Confluence of long-term EMAs + trendline
🎯 Trade Setups
📉 Bearish (Favored if no breakout tomorrow):
Short 595–597 with stop above 600
Targets: 587 → 576
Optional: Add below wedge break (~590)
📈 Bullish (Confirmation-based):
Break + retest of 597–600
Target: 604, then scale out at 612
Avoid front-running long unless you see volume + price close outside wedge

Cup and Handle Breakout | Strong Trend Reversal in PlayNSE:PREMEXPLN
Analysis:
This chart showcases a classic "Cup and Handle" breakout pattern — a powerful bullish reversal setup. After a prolonged downtrend, the stock formed a rounded base, retested the neckline zone near ₹500, and broke out with strong momentum and volume.
Trendline Breakout: A long-term descending trendline has been broken, signaling a trend reversal.
Cup Formation: A smooth, rounded bottom formed over several months indicates accumulation and base-building.
Breakout Confirmation: A sharp breakout above the neckline resistance (around ₹500–₹510) with volume confirms the breakout.
Target Levels: Price has already moved toward ₹606 and is now approaching ₹678 — the measured move target from the depth of the cup.
Trade Setup:
Entry: Ideal entry was near breakout of ₹510.
Targets: ₹606 (hit), ₹678 (approaching).
Stop-loss: Below ₹500 or trailing below recent swing lows for momentum trades.
Outlook:
The chart signals a strong reversal and momentum continuation. If ₹678 is broken, further upside potential opens up.
HAPPY TRADING !!

USOIL Weekly Analysis – Major Breakdown and Retest in PlayAfter several months of holding firm, USOIL has finally broken below its key support zone around $67–$70, which had acted as a floor since mid-2021 . This is a significant technical development, and the current price action is showing a classic bearish retest of that broken structure.
Technical Breakdown:
Support Broken:
The $67–$70 zone was tested multiple times over the past 2 years. Price has now cleanly broken through it and is struggling to reclaim it.
Retest in Progress:
Price is currently hovering around $62.36 and failing to push back above the broken support. This retest is textbook and could confirm further downside.
Market Structure:
Lower highs and lower lows dominate the weekly chart = clear bearish trend.
Bearish Targets:
Target 1: $53.50 – Previous minor demand zone from 2021.
Target 2: $41.50 – Strong historical support and potential major bounce area.
Invalidation Zone:
If price closes above $70 on the weekly chart, the breakdown would be invalidated and we’ll reconsider our bias.
Confluence:
Broken multi-year support
Bearish retest on weekly timeframe
Clear downside liquidity below
Summary:
Bias: Bearish
Setup: Short on confirmation of rejection below $67
Timeframe: Weekly / Daily
This is a high-probability setup if the rejection continues. Look for further bearish price action on the daily or 4H chart for refined entries. As always, manage risk carefully .
Like & Follow for more clean, high-timeframe breakdowns!

If Trend Reverses, We'll Most likely See 106-109k FirstTrading Fam,
We'll bring our knowledge of liquidity to the chart here today. You guys know that my new indicator utilizes liquidity as a prime factor in helping to alert us when to buy and sell any given asset. In our chart here today, I have also brought over the liquidation map from Glassnode, which will help us gain further insight into what Bitcoin's next move might be.
First, let me explain a few of the drawing here.
For those who may be new, those liquidity blocks are printed by LuxAlgo's "Liquidity Swings" indicator. I have incorporated them into my indicator and have combined it with another to alert me as to exactly when it might become a good time to buy or sell. Typically, I set the blocks to have a 15 day life cycle. When we are overbought and enter into a sell-side liquidity block, my indicator will flash a red dot. When we are oversold and enter into a buy-side liquidity block, my indicator will flash a green dot. These are typically super-accurate signals and are, at least, a good time to start your exits and/or entries but unfortunately, these DOTS DO NOT APPEAR in this chart due to this being a private indicator distributed by invite only.
I use additional indicators for confirmation and to support what my indicator is showing me, such as the VRVP. You can see the VRVP Point of Control (PoC) is at 96,425 in this chart, meaning that most of our recent traded volume is to the underside of us right now. This is positive. However, it is important to recognize that sometimes that PoC can act as sort of a magnet to pull price back to that area before further directional price trend movement. Keep this in mind as we continue to consider price movement here.
Back to the liquidity blocks. I've extended our last big liquidity block from Jan-Feb of this year out past the normal 15 day life cycle that I usually set. I think this is important as it appears to align with the data that I've brought over from Glassnode's Liquidation Map. Notice that on the map you see large liquidity pools both below the current price and also, above it. But the larger liquidity pool remains above us at the time of this post. This aligns with the resistance levels I have drawn on the chart in white which remain above us. And currently, we are also forming a bull flag pattern. So, are greatest probability of price movement right now remains to the upside. I am targeting that 106-108k area. Once hit, trend reversal could occur.
Here's what I expect.
We hit 106-108k. Then, at this point, the market must make a critical decision; do we continue up, beating previous highs, or do we first drop down and liquidate all those late longs from 93-104k?
Now, since we know that big money is in this game and wants as much as they can get at the best price possible, it is easier to determine what might occur. I suggest that once liquidation occurs up to 106-108k, sell-side pressure will be placed on the market in hopes of driving price back down to clean out all of those late long entries. That PoC level at around 96k is a good target here. Once this price has been hit, freeing up hundreds of millions in liquidated Bitcoin, the big buyers (smart money) will step back in to swoop up the loot and Bitcoin will be free to trend back up again.
Now, as always, I could be wrong. Let's talk about what happens if we beat our 106-108k overhead resistance levels. In this case, we could see Bitcoin pump as high as 125k before any local trend reversal begins to occur. I will re-assess at this point.
BLUF: 106-108k is key resistance. Mark your charts and keep your eye on what price does there. It will be key to what happens next.
✌️Stew

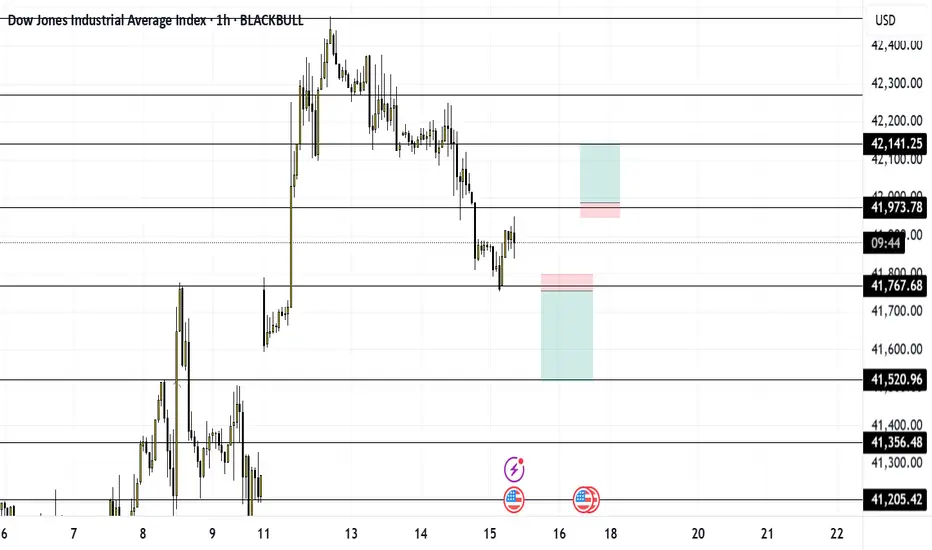
US30 MAY 15What kind of birds stick together? Velcrows! And we shall stick together as we conquer this market. Today price is stuck between 2 key areas (41,973 and 41797).
I am going to wait for price to break and retest one of those areas before I get into a buy or sell respectfully. on the 1m timeframe.
And I'm trading level to level. If it goes for the sell, it is evident that price will try to fill in the price gap that it left behind and few days ago. 41,527 level
And if price decides that it wants to go for the buy, I'll buy up to the next level where price last stopped on the hourly, 42,139 level.
But, like a 21-year-old girl, 5 shots in off of Tequilla, price will do whatever it wants, so trade responsibly. And have fun!!!
NAS100 POssible Sell - Trade ideiaNAS100 POssible Sell - Trade ideia. I see a Switch of structure in 1H and 15min. Not happy that this is not confirmed on 4H but still expect this sell move to come. Lets see

#NIFTY Intraday Support and Resistance Levels - 15/05/2025Gap up opening expected in nifty near 24750 level. After opening if nifty starts trading and sustain above this level then expected upside movement upto 24950 level. Below 24700 level there will be downside expected upto 24550. 24550 level will act as a strong and important support for nifty. Any major downside only expected below this support level.

Thu 15th May 2025 BTC/USD Daily Forex Chart Sell SetupGood morning fellow traders. On my Daily Forex charts using the High Probability & Divergence trading methods from my books, I have identified a new trade setup this morning, and this is a BTC/USD Sell trade. As usual, you can see the details of the trade/s on the chart. Keep in mind that I am generally looking to buy when the MACD is below the zero level & sell when it is above the zero level. The red/blue QMP Filter dots on the price chart produce the actual trade signal. I am also considering things like divergence, support/resistance, round numbers etc, and these will be marked up on the chart. Enjoy the day all. Cheers. Jim

GBPUSD LONG Risky trade- 1-6RRGBPUSD LONG - 1-6RR - Lets see if this Long holds. But its too risky because we might week falling.
