#MtarTech #MINDTREE #LTI #LTTS #INFY #TCS #CNXIT #WIPRO #COFORGE#MTARTECH
NSE: MTARTECH
CMP: 1737.80
TARGET: 2200
SL: 1550
RR: >2.5 times
Return > 26%
Timeframe: <6M
CAN BREAK ALL-TIME HIGH IN FUTURE
Factors:
BULLISH WEDGE BREAKOUT
Trend Following
Rising Volume with rising Prices.
Flag pattern breakout.
Pennant Pattern Breakout with Bullish Candle.
Retest Successful.
Higher Highs & Higher Lows.
Broken above RESISTANCE levels
Trading at SUPPORT levels
Earnings are strong.
Bullish Wedge Breakout
Risk Return Ratio is healthy.
And
Rising from Double Bottom Pattern to Flag Pattern forming.
If you like my work KINDLY LIKE SHARE & FOLLOW this page for free Stock Recommendations.
With 💚 from Rachit Sethia
TECHM

TECHM - Demand Emerged near 900 in Jun'22This was after a 48% drop from 1750 to 900
Plan ahead => could consider to Buy above 1150
- and/ or Rejections near 700
PB 3x
PE 17x
ROCE 24%
DivYld 4%

TECHMNSE:TECHM
One Can Enter Now ! Or Wait for Retest of the Trendline (BO).
Note :
1.One Can Go long with a Strict SL below the Trendline or Swing Low of Daily Candle.
2. Close, should be good and Clean.
3. R:R ratio should be 1 :2 minimum
4. Plan as per your RISK appetite
Disclaimer : You are responsible for your Profits and loss, Shared for Educational purpose!

Tech MahindraAt weekly timeframe, Tech Mahindra is standing at strong support around 1000 which is also a round number.
Also, 0.618 fib level, 200 EMA & POC Level present at same area.
If we look towards RSI, it's also showing techm is at oversold levels.
We can go long and add some long position in portfolio with a SL of 940.
Follow rules for profitability.
Thanks,
Sumit Thakur

#ANGELONE #ZERODHA #EDELWEISS #ANANDRATHI #ISEC #MOTILALOFS #IT#ANGELONE
NSE:ANGELONE
NSE:ANGELONE
CMP: 1452.50
Entry Price 1440
Target: 1900+
SL: 1170
RR Ratio > 3
Return > 45%
Time Frame < 6 months.
Factors:
BULLISH WEDGE BREAKOUT
Trend Following
Rising Volume with rising Prices.
Flag pattern breakout.
Pennant Pattern Breakout with Bullish Candle.
Retest Successful.
Higher Highs & Higher Lows.
Broken above RESISTANCE levels
Trading at SUPPORT levels
Earnings are strong.
Bullish Wedge Breakout
Risk Return Ratio is healthy.
And
Rising from Double Bottom Pattern to Flag Pattern forming.
If you like my work KINDLY LIKE SHARE & FOLLOW this page for free Stock Recommendations.
With 💚 from Rachit Sethia

Tech Mahindra in Bearish Mode
Head & Shoulder Pattern forming in Weekly Chart, so Strong bearish signal.
It may reach the marked levels in the Chart.

TECHM - Tech mahindra LONGTECHM LONG
At good support levels, And at a medium term support levels. Can bounce and give good return.
Old idea gave great returns.
No recommendations.

TECHM - Shark Pattern in PlaceThere is a formation of a shark pattern on the daily chart of the stock.
Currently stock is trading in the PRZ of the pattern.
We might see some pullback in the stock.
Short-term trade
Resistance: 1386- 1410
Support: 1290-1300

TECHM LONGCurrently at a very crucial support zone. If it bounces back from this level, it will be a good stock for the upcoming weeks.
If it completes the double bottom formation, we can also see it going above 1570 levels.
Trade safe. Manage risk. Be profitable.
Please follow us for more simple trading analysis and setups. Also let me know in the comment in case you have any queries.
Disclaimer :- This is just my view. Please analyze charts yourself and then decide to take any trades.

Redington #Redington 166.75 to 230 #INFY #TCS #WIPRO #NIITLTD #Q#REDINGTON
NSE:REDINGTON
NSE:REDINGTON
NSE:REDINGTON
REDINGTON CMP 166.75
TARGET 220+
SL 155
TF < 6 months
RR > 3
Return > 40%
Factors:
BULLISH WEDGE BREAKOUT
Trend Following
Rising Volume with rising Prices.
Flag pattern breakout.
Pennant Pattern Breakout with Bullish Candle.
Retest Successful.
Higher Highs & Higher Lows.
Broken above RESISTANCE levels
Trading at SUPPORT levels
Earnings are strong.
Bullish Wedge Breakout
Risk Return Ratio is healthy.
And
Rising from Double Bottom Pattern to Flag Pattern forming.
If you like my work KINDLY LIKE SHARE & FOLLOW this page for free Stock Recommendations.
With 💚 from Rachit Sethia

TECHM SHORTTECHM SHORT
Breakdown expected in short term.
Till line crossing levels.
No recommendations.

TECHM broke short term supportThe stock broke its short term support in today's session with the Big Bear candle having good volume.
Now, sustaining below 1695, the stock could move towards 1550-1530 in the coming trading sessions.
Disclaimer : not a recommendation to trade

TECHM on the verge of confirming the breakoutTech Mahindra trying to come out of almost 2 month long consolidation and has already given a breakout only a good healthy candle is required for proper confirmation

TECHM looks good for upside momentumHey guys!
The few last stocks I gave have all the target except ICICI bank which is still consolidating.
This TECHM was bought to us on right time today by one of our member of the small group of traders and I also analysed it & it definitely looks good to me too.
All the info for buying has been provided in the chart above along with the targets, this can also be done in Intraday tomorrow.
BUY ABOVE: 1555
Target:1575 and above as in charts, one can also aim for ATH(all time high)
RSI supporting
MACD showing bears retreating
Please LIKE, COMMENT and SHARE to motivate and support me. I'll keep on posting new ideas on Indices & Stocks. Be sure to follow so that you don't miss any good trades that might have been rewarding.
Any comments and critiques will be appreciated even if it's of opposite view as a trader can also be right so many times.

Tech Mahindra (TECHM)Disclaimer: All Videos/Information on this channel are for Education purpose only .They are not buy/Sell Recommendations . Please consult your financial Advisor before taking any trade or investment decisions.

TechMahindra: Consolidating since a monthAfter 30% rally in early August, Now consolidating within a small range since 23rd August.. Once it break the upper range of consolidation, it may give 15-20% returns within a month or so.

Buy above TechmIT sector moves very positively towards upside. Techm also looks bullish, if it break previous high upside move will be very quick and nice return for swing traders. Take a chance and keep looking.


TECHM Long - A Beautiful structureOne can go long in TECHM with reference levels mention in the chart.


TECHM LONG INTRADAY 10 JUN,2021Dear trader,
If u look at the chart of TECHM (analysis based intraday only) the TECHM Buy at 1070 and Target at 1080
Best Buy at 1068.
Our Best Buy is based on high quality research and when the instrument reaches this level , it’s a jackpot trade.
Best Buy level might be executed or might not be executed.
The chart clearly indicates Bullish Trend you can also see the candle stick patters for more indepth analysis.
In Intraday most important thing is to enter and exit points.
Our signals are based on analytics, algorithms, mathematical derivatives.
Always be a responsible trader, kindly trade only when you have maximum opportunity in the market with minimum risk and with keynotes like data, analysis and proper strategies.
Kindly message us for strategies and analysis.

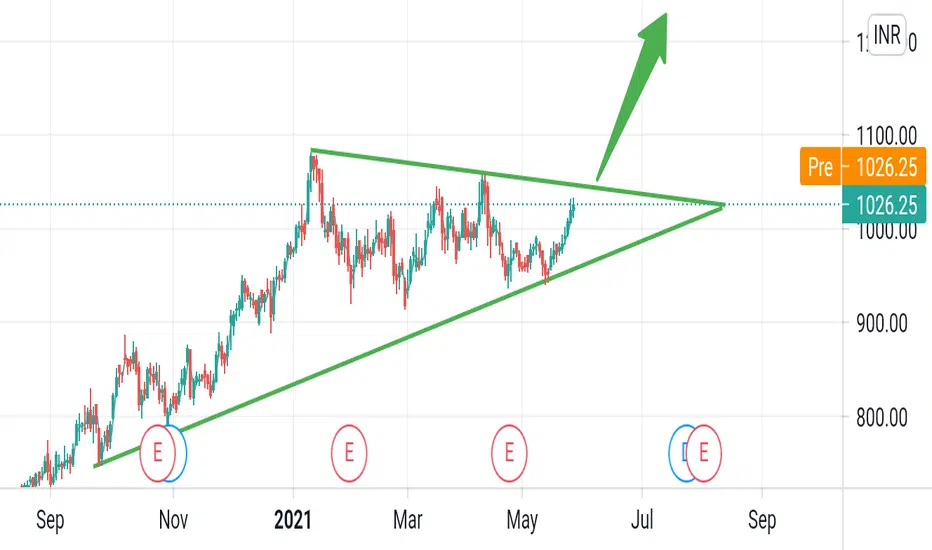
TECHM... BULLISH Triangle pattern breakout.BUY @ 1055-1075
SL :- 1000
TGT1 :- 1145
TGT2 :- 1200
Disclaimer:- It is just for educational purpose. Trade consciously on your own.

Tech Mahindra trading ideasBig opportunity for long term investor buy above 1050 stock will headed up to 1500 big moment to come over IT sector very bullish future I see.