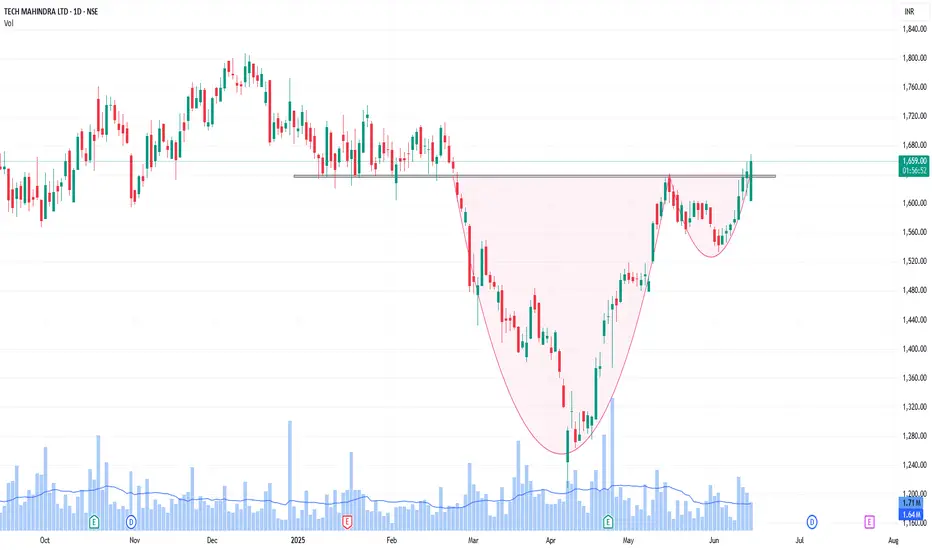
Techm - cup and holder breakoutNSE:TECHM
Cup and handle breakout in TechM
Also it breaking the long resistance 1630-1650
Techmahindra
GOLD PAY ATTENTION TO BULISHXAUUSD (Gold) Technical Signal ⚠️ | Price action is forming a classic bull flag pattern, showing consolidation after a strong upward move. The flag is starting to 'blush' — early signs of momentum building for a potential breakout. If price breaks above the upper trendline with volume confirmation, we could see a continuation toward higher resistance levels. Traders, keep a close eye – gold may be preparing for its next leg up. #XAUUSD #GoldSignal #BullFlag #TechnicalAnalysis #ForexSignals #GoldBreakout #PriceAction"

TECHM: Ride the Wave to New Highs
Overview:
The 1-hour chart for Tech Mahindra Ltd. (TECHM) showcases a corrective Elliott Wave pattern (b, (B), (C) ) and highlights potential price movements, key levels, and target zones. Let's dive in! 🚀
Key Levels and Zones:
Wave Analysis:
The chart depicts a corrective wave pattern labeled as b, (B), and (C) .
Wave b is currently in progress and expected to complete in the zone of ₹1,645–₹1,658 . 📉
Target Zones:
First Target Zone: ₹1,785–₹1,795 🎯
Second Target Zone: ₹1,824–₹1,841 🎯
These levels are based on the completion of Wave (C) and represent potential upward targets.
Stop Loss (Day Close):
Suggested stop loss at ₹1,638 to manage risk in case Wave (C) fails to complete as anticipated. 🛑
Volume Analysis:
Volume bars indicate trading activity and can confirm the strength of price movements. 📊
📈 Trading Plan:
Entry:
Consider buying within the Wave (C) completion zone: ₹1,645–₹1,658 .
Expectation: Corrective wave completes in this zone, leading to upward movement.
Targets:
First Target: ₹1,785–₹1,795 🎯
Second Target: ₹1,824–₹1,841 🎯
Stop Loss:
Place a stop loss at ₹1,638 to limit downside risk. 🛑
Short-term Trading Opportunity:
These target zones are ideal for short-term swing trades or futures and options (FN) positions.
Conclusion:
This trading plan offers a strategic entry and potential profit zones based on Elliott Wave Theory. Monitor price action and volume closely for confirmation.
Disclaimer: This analysis is for educational purposes only. Conduct your own research or consult a financial advisor before trading.

TechMahindra 6 Nov 24 Bullish RDMonthly BB Challenge Monthly MCBO
Weekly Bullish Harami
Daily Price above BB Median
Daily Bullish RD

Tech Mahindra - Long Setup (Swing Trade)Tech Mahindra has confirmed a breakout above the entry zone, setting up for a potential swing trade. Here’s the trade setup:
Entry Price: 1654.85 (Confirmed after the 15-minute candle broke above the entry zone at 1640.25 )
Target: 1785.05
Stop Loss: 1567.85 (Stop loss will be triggered if a daily candle closes below this level)
With the entry price confirmed at 1654.85 , the setup offers a favorable risk-to-reward ratio. The stock is targeting a move toward 1785.05 , with a well-defined stop loss at 1567.85 for risk management.
Disclaimer: This post is for educational purposes only and is not financial advice. Always manage your risk and trade responsibly.

perfect time to short Tech Mahindra?
after great rally even when markets were going down, sell signal has come in on AGR3.0. shoudl we take profit off and / take fresh short positions in the stock ?

tech mahindranifty IT also uptrend
Additionally, this stock broke above its resistance.
continued over the breakthrough line
upward tendency, channel pattern, and breakout
Stocks may rise in value.
not advised for purchase and sale

Tech Mahindra Ltd: Strong Fundamentals and Bullish BreakoutFundamental View:
➡️ PE Ratio: 61 | ROCE: 12% | ROE: 8.63% | Market Cap: ₹1,55,031 Cr
➡️ Strong long-term financials with a 96% dividend payout
➡️ Ranked 5th out of 147 in IT Software
➡️ Global presence with diverse services across 90+ countries
Technical View:
➡️ Bullish breakout observed
➡️ Next resistance from Dec 2021 at 1,660
➡️ Ascending trend line providing strong support
➡️ RSI at 67, indicating strong momentum
➡️ Price above key moving averages (50, 100, 200-day)

Tech M : Updated Price Action- We posted the initial analysis of Tech M on March 5th, 2023 which can be accessed below.
- Given that the price action changed with time, we decided to post the updated price action for the ease of our followers
- The chart is pretty self-explanatory
- The Price action is similar to that of NSE:WIPRO . The price consolidated for over a year and finally gave a good breakout.
- Follow the comments below for regular updates on future price action 👇
- The Indian IT sector too is approaching its critical resistance for the third time.
- Looks like we may see some good momentum in the IT Space. What do you think?
- We appreciate your support! If you liked our analysis, Do give us a 🚀
⚠️Disclaimer: We are not registered advisors. The views expressed here are merely personal opinions. Irrespective of the language used, Nothing mentioned here should be considered as advice or recommendation. Please consult with your financial advisors before making any investment decisions. Like everybody else, we too can be wrong at times ✌🏻

TechM Fair chance of Correction
Price has reacted to a Fresh 3 Month Supply also there is a fresh 6 Month Demand formed,
Hence we are expecting a Correction.
After reacting to the Fresh Quarterly Supply, as per Weekly chart we have drawn trend-lines which also show the Support and then we see Price has violated the Support forming a new low, which indicates the sellers are coming in Power,
Considering the previous low violation and the 3 Months Soucre Supply this is the Short position.

TechM 50% - 100 % Upside Potential in CENSE:TECHM #TECHM | 🔥 Buy TechM Apr 1300CE | 🔥 50% - 100 % Upside Potential in CE
✅ Buy Level - Rs1230 - Rs 1250
✅ SL - Rs 1175
✅ Target - Rs 1299/1320/13601390
✅ Trading at the lower end of the Rising Channel
✅ Taking support at 200 Day SMA
Trade :-
✅ Buy Future
✅ Buy TechM Apr 1300CE - Rs 15-20
✅ Apr 1300 CE - CMP 20
Look at the chart for more information
Thanks

TECHM:: Long@Neckline this stock is falling now..
we have a strong support lies at 1200 range...in the form of trendline and neckline both are strong, multiple times price takes the help of trendline support...
Head and shoulders pattern is also detected in this stock price.
a strong breakout is observed from neckline...
so keep looking for long in this stock from neckline for the target of 1500.
we have a strong resistance at 1500 levels.

Tech MahindraTech mahindra may have started iii of 3rd wave.. If this holds right we may see spike till 1600

Am i right? Is techm ready for breakoutHi guys. Please correct me if I'm wrong. Is techm ready for a breakout? There is an important support here that's showing. Par correct me if I'm wrong.
Please note I'm learning and this is not a recommendation as you can see I'll the winner who is asking whether it is correct or not 😬😎😄

TECH Mahindra Daily timeframe analysis for long term
NSE:TECHM about to breakout golden zone 1320 in monthly timeframe.
It has created strong bullish trend over year with LL LH HL structures, recent breakout from 1235 level and given strong bounce with pullback near entry level 1235 .
Buy range 1221 to 1320, SL 1182.
Major targets levels are highlighted in blue lines.

TECHM - **Navigating Opportunities: A Technical Outlook📊 **Analyzing Candlestick and Heikin Ashi Patterns**
Tech Mahindra Ltd is currently under the spotlight for its promising candlestick and Heikin Ashi patterns, showcasing a compelling narrative for traders seeking strategic entry points.
📉📈 **Decoding Tick Strength: Daily and Monthly Insights**
- **Daily Momentum:** The daily chart unravels a Bullish trend, accentuated by a Bullish Continuation Heikin Ashi Pattern. This signals a positive short-term outlook, hinting at potential opportunities for nimble traders.
- **Monthly Fortitude:** The monthly landscape paints an even more robust picture, featuring a Strong Bullish sentiment. A Bullish Heikin Ashi Pattern, coupled with noteworthy trading volume, underlines a sustained and formidable long-term uptrend.
🎯 **Pinpointing the Sweet Spot: Demand Zone 1172.05 - 1177.70**
Within the intricacies of the charts, a strategic buying opportunity emerges within the demand zone, ranging from 1172.05 to 1177.70. This zone acts as a magnet for potential buyers, creating a favorable entry window for astute traders.
📈 **Strategic Move: Buy Within the Range with Stop Below 1171**
To capitalize on the potential ascent, traders are urged to consider entering the market within the specified range of 1172.05 to 1177.70. Risk management is key, and setting a stop-loss just below 1171 serves as a protective measure against unforeseen market shifts.
🚀 **Seizing Opportunities with Tech Mahindra Ltd**
Tech Mahindra Ltd not only showcases favorable technical indicators but also offers a strategic entry point within a defined demand zone. Traders navigating this landscape should remain vigilant, stay abreast of market dynamics, and be ready to adapt their strategies as needed.
📈🚀 Happy Trading! 🚀📈

TECH MAHINDRA -1DTech Mahindra looks good for buy now as it has broken the recent resistance of 1180 and now moving towards next zone of 1311 in a bullish manner, the long term goal can be to hold it till the 1560 levels, as there is a gap near the zone which the price will try to fill out.

TECHM ( SHORT SELLING SETUP)In TECHM stock we can see trendline in Daily Timeframe (1D).
Right now stock is trading at price of 1175 Rs and the support of trendline lies on 1170 Rs.
Also according to the Fibonacci Retracement drawed from bottom to top the stock has broke the support of 0.382 which is at price 1240 Rs and now at trendline support.
One can plan short selling from here at price of 1170 Rs with small STOPLOSS at 1240 Rs(which is zone of 0.382 from Fib Retracemnet) and the 1st TARGET for short selling is 1080-1170 and 2nd TARGET is 990-980 Rs as there is major SUPPORT at 980 level.
There are Q3 rersults are coming of TECHM in upcoming days therefore the STOPLOSS should be little big which can provide space for volatility and SL will be safe thats why we put SL of 70 rs and the TAEGET of 200 Rs againts it. Which gives the RISK REWARD RATIO of 1:3.

TECHM--Bearish view??Price is now at resistance zone, and turned to be bearish side..
On the other side we have a bearish channel,
every trendline on bearish channel tries to push the price upside...
the last trendline is stronger that will take the price again upwards..
wait until price falls below these line and retrace...
if failed to go higher a strong fall will observe.


Buy opportunity for Tech Mahindra Tech Mahindra consolidated and created leading diagonal pattern in it's first wave.
After completing it's first wave of the second wave - it has retraced back to 61.8%.
A good opportunity to buy with stop loss of 1035 and target of 1333

NIFTY IT near crucial breakout level.CNX IT on the verge of breakout above 31,100. It would be worth keeping an eye on the whole IT pack. Many like TECHM have been breaking out.
❤ & follow?

Tech Mahindra : What's Next for the IT Giant?The Tech Mahindra stock price has been consolidating in a range for the past few months. However, the recent price action suggests that the stock is poised to break out to the upside.
