USD/JPY(20250718)Today's AnalysisMarket news:
① Kugler: It is appropriate to keep the interest rate policy stable for "a while".
② Daly: Whether to cut interest rates in July or September is not the most critical.
③ Bostic: It may be difficult to cut interest rates in the short term.
Technical analysis:
Today's buying and selling boundaries:
148.45
Support and resistance levels:
149.80
149.30
148.97
147.93
147.61
147.10
Trading strategy:
If the price breaks through 148.97, consider buying in, the first target price is 149.30
If the price breaks through 148.45, consider selling in, the first target price is 147.93
Technical-analysis

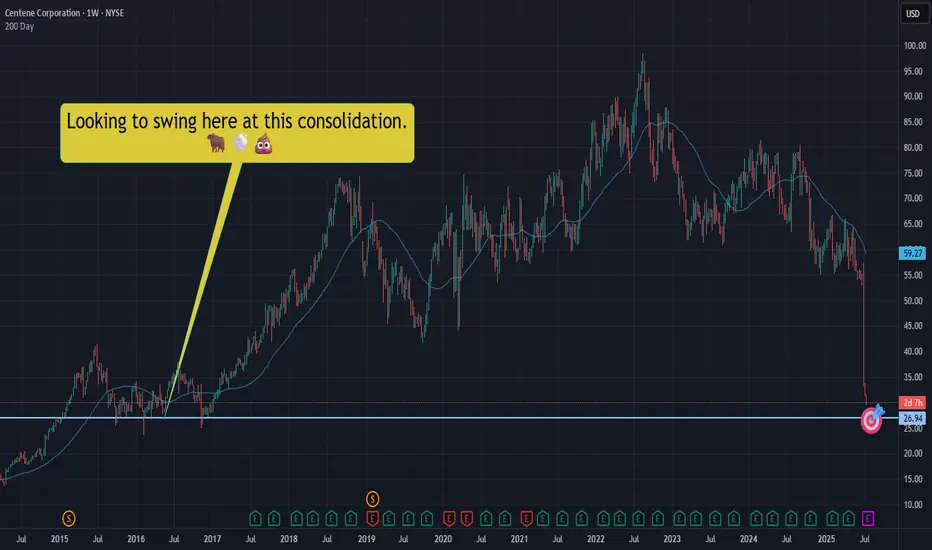
CNC|Let's take a swing at a falling dagger! NYSE:CNC slicing through the void, well.... like a falling dagger through a void.
Not trying to catch this bad boi, but we should expect a bounce at some point. Let's swing for a bounce in that $26.90ish area.
This is NOT a YOLO and I hope it's not an "oh no!" Let's keep our wits about us - starter position only. We can add if we need to, but let's just hope we sell and make some quick Christmas money.
THANK YOU FOR YOUR ATTENTION ON THIS MATTER
USD/JPY(20250714)Today's AnalysisMarket news:
① Fed's Goolsbee: The latest tariff threat may delay rate cuts. ② The Fed responded to the White House's "accusations": The increase in building renovation costs partly reflects unforeseen construction conditions. ③ "Fed's megaphone": The dispute over building renovations has challenged the Fed's independence again, and it is expected that no rate cuts will be made this month. ④ Hassett: Whether Trump fires Powell or not, the Fed's answer to the headquarters renovation is the key.
Technical analysis:
Today's buying and selling boundaries:
147.02
Support and resistance levels:
148.39
147.88
147.55
146.49
146.15
145.64
Trading strategy:
If the price breaks through 147.55, consider buying, and the first target price is 147.88
If the price breaks through 147.02, consider selling, and the first target price is 146.49

GBP/JPY Low Risk BUYS - SWINGLOW RISK TRADE
If you prefer not to swing you can scalp buys on the pullbacks throughout the week ahead.
GBP/JPY - BULLISH ENGULFING CONFIRMED
A+ SETUP since it has touched
and respected our area of interest.
SL - 185.599
TP1 - 190
TP2 - 192.799
TP3 - 194.681

Quick take on the S&P500From the very short-term perspective, the SP:SPX is currently stuck in a tight range. Waiting for a little breakout.
Let us know what you think in the comments below.
Thank you.
75.2% of retail investor accounts lose money when trading CFDs with this provider. You should consider whether you understand how CFDs work and whether you can afford to take the high risk of losing your money. Past performance is not necessarily indicative of future results. The value of investments may fall as well as rise and the investor may not get back the amount initially invested. This content is not intended for nor applicable to residents of the UK. Cryptocurrency CFDs and spread bets are restricted in the UK for all retail clients.

USD/JPY(20250620)Today's AnalysisMarket news:
The Bank of England kept interest rates unchanged at 4.25%, and the voting ratio showed that internal differences were increasing. Traders expect the bank to cut interest rates by another 50 basis points this year.
Technical analysis:
Today's buying and selling boundaries:
145.32
Support and resistance levels:
146.35
145.96
145.72
144.93
144.68
144.30
Trading strategy:
If the price breaks through 145.72, consider buying, and the first target price is 145.96
If the price breaks through 145.32, consider selling, and the first target price is 144.93

Potential Gold LongWith Volatile Markets and constant War Developments
XAU/USD has experienced higher than NORMAL volatility.
Given price can RESPECT this short term trendline, we may have a Target of 3,500 in sight.
2 weeks of Bullish Momentum now followed by a beautiful retracement & Strong Wicks below.
SL - 3,355
TP 1 - 3,440
TP 2 - 3,470
TP 3 - 3,496

EURUSD pushing away from 2025 highsAfter creating a new 2025 high last week, MARKETSCOM:EURUSD is now in a slight correction mode. Will the bears take control from here? Let's have a look.
FX_IDC:EURUSD
Let us know what you think in the comments below.
Thank you.
77.3% of retail investor accounts lose money when trading CFDs with this provider. You should consider whether you understand how CFDs work and whether you can afford to take the high risk of losing your money. Past performance is not necessarily indicative of future results. The value of investments may fall as well as rise and the investor may not get back the amount initially invested. This content is not intended for nor applicable to residents of the UK. Cryptocurrency CFDs and spread bets are restricted in the UK for all retail clients.

USD/JPY(20250616)Today's AnalysisMarket news:
Trump: The United States may still intervene in the Iran-Israel conflict. If Iran launches an attack on the United States, the United States will "fight back with all its strength on an unprecedented scale." Iran and Israel should reach an agreement.
Technical analysis:
Today's buying and selling boundaries:
143.79
Support and resistance levels:
145.47
144.84
144.43
143.15
142.74
142.12
Trading strategy:
If the price breaks through 144.43, consider buying in, the first target price is 144.84
If the price breaks through 143.79, consider selling in, the first target price is 143.15

USD/JPY(20250613)Today's AnalysisMarket news:
The number of initial jobless claims in the United States for the week ending June 7 was 248,000, higher than the expected 240,000, the highest since the week of October 5, 2024. The monthly rate of the core PPI in the United States in May was 0.1%, lower than the expected 0.30%. Traders once again fully priced in the Fed's two interest rate cuts this year.
Technical analysis:
Today's buying and selling boundaries:
143.73
Support and resistance levels:
145.09
144.58
144.25
143.21
142.88
142.37
Trading strategy:
If the price breaks through 143.73, consider buying in, the first target price is 144.25
If the price breaks through 143.21, consider selling in, the first target price is 142.88

This Trendline Refuses To Be OverlookedTrading Fam,
While it is somewhat unclear what Bitcoin's next move will be (though I tend to lean towards more upside bias), one thing has become clear ...that aqua blue trendline I have drawn on our chart is proving its significance. Currently, it holds as support. A break to the downside though, and I expect us to drop all the way to 96k. If it continues to hold, a break above our recent high should be expected and new highs will be formed in a relatively quick timeframe.
Stew

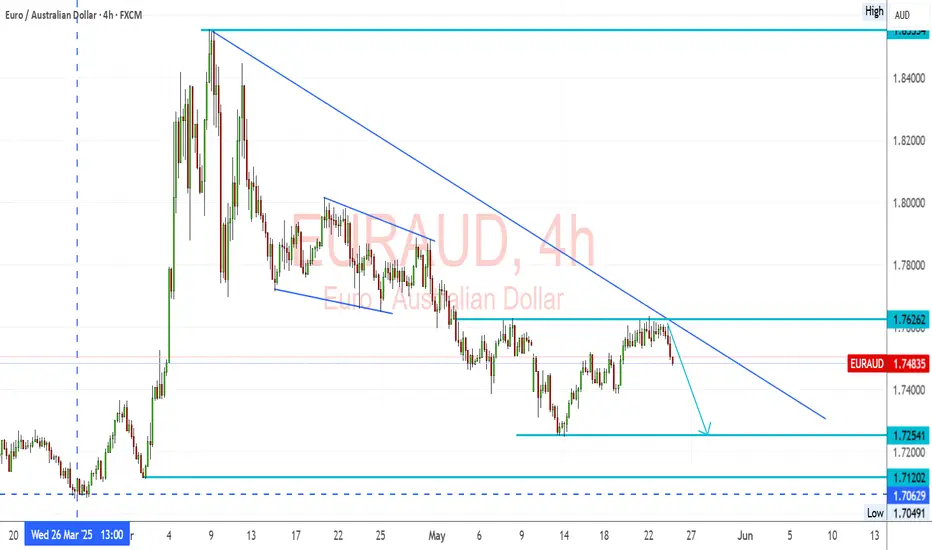
EURAUD – Trendline Holds, Bearish Setup Below 1.7626EURAUD Trend: EURAUD pair remains in a strong downtrend, marked by consistent lower highs and a descending trendline.
Resistance: 1.7626 has been retested and rejected, confirming it as a short-term ceiling.
Structure: The latest rejection from both horizontal resistance and the trendline confirms bearish intent.
🔽 Bearish Targets:
1.7254 – minor support and near-term target
1.7120 – stronger support zone
1.7060 – previous low and potential extended target
A clear break below 1.7400 could confirm continuation of the trend toward those levels.
Fundamental Overview:
🔻 EUR Weakness:
The Eurozone is slowing, particularly in Germany and France.
ECB remains cautious; recent comments show concern about tight financial conditions and sticky inflation.
Political uncertainties and mixed data prints are adding pressure.
🟢 AUD Support:
The RBA remains firm with hawkish language, holding rates while global peers lean dovish.
Commodities remain stable, and Australia benefits from demand out of Asia.
Domestic data (jobs and retail) shows surprising resilience.
Summary:
Bias: Bearish below 1.7626
Break Trigger: 1.7400
Target Range: 1.7250 – 1.7060
Fundamentals: Favor AUD on stronger economic footing and RBA policy tone
📉 EURAUD looks ready for another leg lower unless we see a breakout above 1.7630 with conviction.
XAUUSD - A few pips to the downsideBased on structure and pattern formations, likely to short this trade to the downside before expecting some considerable movement to the upside.

GBPUSD needs a catalyst. Could UK inflation be that?For now, FX_IDC:GBPUSD is struggling to overcome a key resistance barrier, at around 1.3440. Could the UK inflation numbers help move the pair?
Let's dig in...
MARKETSCOM:GBPUSD
Let us know what you think in the comments below.
Thank you.
77.3% of retail investor accounts lose money when trading CFDs with this provider. You should consider whether you understand how CFDs work and whether you can afford to take the high risk of losing your money. Past performance is not necessarily indicative of future results. The value of investments may fall as well as rise and the investor may not get back the amount initially invested. This content is not intended for nor applicable to residents of the UK. Cryptocurrency CFDs and spread bets are restricted in the UK for all retail clients.

USD/JPY(20250516)Today's AnalysisMarket news:
Fed Chairman Powell: The Fed is adjusting its overall policy-making framework. Zero interest rate is no longer a basic situation. The wording of underemployment and average inflation rate needs to be reconsidered. PCE is expected to drop to 2.2% in April.
Technical analysis:
Today's buying and selling boundaries:
145.93
Support and resistance levels:
147.26
146.77
146.44
145.42
145.10
144.61
Trading strategy:
If the price breaks through 145.93, consider buying, the first target price is 146.44
If the price breaks through 145.42, consider selling, the first target price is 145.10

Is DAX ready for a slight correction lower?We are watching the German XETR:DAX as it is currently struggling to go for a new all-time high. Can this be the moment for a deeper correction lower?
Let's dig in...
MARKETSCOM:GERMANY40
Let us know what you think in the comments below.
Thank you.
77.3% of retail investor accounts lose money when trading CFDs with this provider. You should consider whether you understand how CFDs work and whether you can afford to take the high risk of losing your money. Past performance is not necessarily indicative of future results. The value of investments may fall as well as rise and the investor may not get back the amount initially invested. This content is not intended for nor applicable to residents of the UK. Cryptocurrency CFDs and spread bets are restricted in the UK for all retail clients.

TA on WTI Oil - 2025.05.14Quick technical analysis on WTI oil.
Let us know what you think in the comments below.
Thank you.
77.3% of retail investor accounts lose money when trading CFDs with this provider. You should consider whether you understand how CFDs work and whether you can afford to take the high risk of losing your money. Past performance is not necessarily indicative of future results. The value of investments may fall as well as rise and the investor may not get back the amount initially invested. This content is not intended for nor applicable to residents of the UK. Cryptocurrency CFDs and spread bets are restricted in the UK for all retail clients.

USD/JPY(20250514)Today's AnalysisMarket news:
The U.S. unadjusted CPI annual rate unexpectedly dropped to 2.3% in April, the lowest since February 2021.
Technical analysis:
Today's buying and selling boundaries:
147.76
Support and resistance levels:
148.83
148.43
148.17
147.34
147.08
146.68
Trading strategy:
If the price breaks through 147.76, consider buying, the first target price is 148.17
If the price breaks through 147.34, consider selling, the first target price is 147.08

AUD/JPY Short Bearish Trade Plan (Conservative Structure-Based Entry)
Entry: 92.40 (Sell Limit at resistance)
Stop Loss: 94.10 (Above weekly structure and fakeout buffer)
Take Profits:
TP1: 89.00 (initial neckline retest)
TP2: 85.50 (structure base)
TP3: 83.00 (macro extension target)

Watching carefully USDCAD this weekWith the abundance of US & CAN data this week, we may see some interesting action in USDCAD pair.
Let's dig in.
Let us know what you think in the comments below.
Thank you.
77.3% of retail investor accounts lose money when trading CFDs with this provider. You should consider whether you understand how CFDs work and whether you can afford to take the high risk of losing your money. Past performance is not necessarily indicative of future results. The value of investments may fall as well as rise and the investor may not get back the amount initially invested. This content is not intended for nor applicable to residents of the UK. Cryptocurrency CFDs and spread bets are restricted in the UK for all retail clients.

AUDJPY, our risk on/off monitor, is near a key resistance areaAUDJPY has been on a good run lately. The driving force behind it was the improved market sentiment due to the calming moment in the tariff wars. Can this be sustained?
Let's look at the technical picture of AUDJPY.
Let us know what you think in the comments below.
Thank you.
77.3% of retail investor accounts lose money when trading CFDs with this provider. You should consider whether you understand how CFDs work and whether you can afford to take the high risk of losing your money. Past performance is not necessarily indicative of future results. The value of investments may fall as well as rise and the investor may not get back the amount initially invested. This content is not intended for nor applicable to residents of the UK. Cryptocurrency CFDs and spread bets are restricted in the UK for all retail clients.

USD/JPY(20250502)Today's AnalysisToday's buying and selling boundaries:
144.67
Support and resistance levels:
147.49
146.44
145.75
143.58
142.90
141.84
Trading strategy:
If the price breaks through 145.75, consider buying, the first target price is 146.44
If the price breaks through 144.67, consider selling, the first target price is 143.58
USD/JPY(20250430)Today's AnalysisMarket news:
The European Central Bank expects prices to rise 2.9% over the next 12 months, up from 2.6% in February, according to a monthly survey released on Tuesday. This is the highest level since April 2024. The three-year indicator rose slightly to 2.5%. The ECB's first five-year forecast was 2.1%.
Technical analysis:
Today's long-short boundary:
142.32
Support and resistance levels:
143.13
142.83
142.63
142.01
141.81
141.51
Trading strategy:
If the price breaks through 142.32, consider buying, the first target price is 143.00
If the price breaks through 142.01, consider selling, the first target price is 141.81
