EURCAD is feeding us! Running +114The last EURCAD Buy was kind enough to provide us with out TP3 target which is based on 1:3 Risk to Reward.
Our Sell trade is now moving nicely and running +114 pips with hardly any draw down and is now risk free.
Regards
Darren
Blue FX
Technical-analysis

Will the resistance hold - Or will we witness a breakoutGBPUSD reaches a strong resistance, the bulls are losing power.
There's a possibility for breakout on H4 and daily.

GBPUSD | WILL GO UP FOR 100+ PIPS CHECK THIS OUTPLEASE SUPPORT THE IDEA BY SMASHING LIKE AND GIVING A COMMENT <3
Hello Forex Trading Lions! PLEASE ENJOY THE FREE IDEA!
Today we are having a look at GBPUSD broke area of sensitivity, had a pullback now trending upwards.
USD Weak data will help this uptrend continue, might have a bigger pullback, but overall trend is going up.
Its also respecting the moving averages which shows bullish pressure.
Follow & Check Out My Profile! PEACE <3

EURNZD TP1 hit and running +153 pips.Great day for us today, EURNZD continues to drop. the last buy also gained us some profit making it to TP1 offering us 180 pips in total.
Lets see if we can continue down - NZD strength continues and we have seen EUR weakness across most pairs today.
Regards
Darren


GBPCAD - Using lower timeframes on V1 - new tradeFor more information on our strategy please view our 'Scripts' page on our Trading view profile.
Our V2 strategy shows the SL and multiple TPs on the chart too - these are customisable based on the ATR of each pair.
We have set these so that TP1 is 1:1 TP2 is 1:2 TP3 is 1:3 RR.
There are infinite ways to manage your trades to suit your mindset and time.
Works on all instruments
Directly onto your own personal trading view - all devices work
Non repainting
Please follow us to keep up to speed with our trading ideas, live streams (coming soon) and weekly recaps using our strategy.
We are continually marking some tweaks and marginal gain improvements to continue to make this easier for our trades and even more profitable. All updates are given to our members and previous purchasers FOC .
Regards
Darren
Blue FX

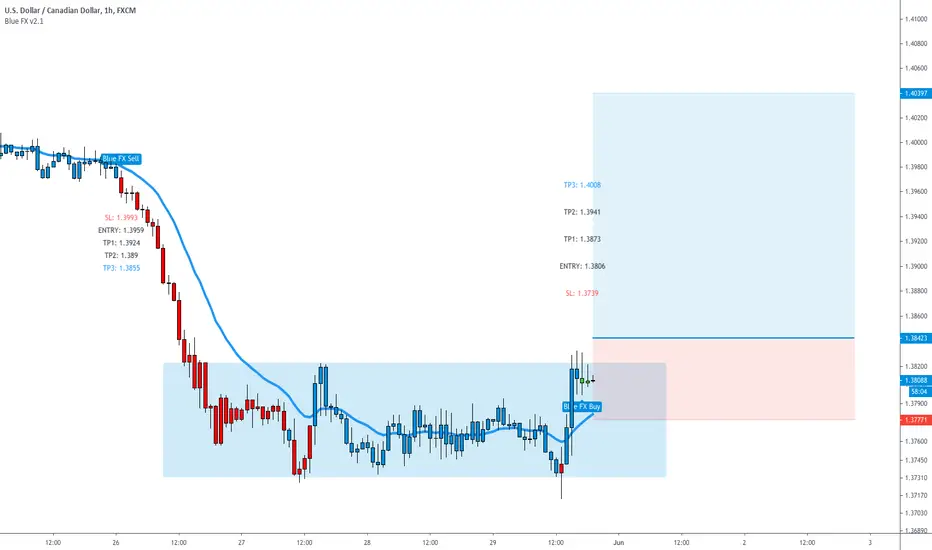
USDCAD - New signal, but we need to break the range first!A good example of some due diligence here - we must be wary of ranging price action, here is a good example - we are showing a buy but as you can see we are stuck in range - a BUY STOP can be used on a new high being formed as shown.
For more information on our strategy please view our 'Scripts' page on our Trading view profile.
Our V2 strategy shows the SL and multiple TPs on the chart too - these are customisable based on the ATR of each pair.
We have set these so that TP1 is 1:1 TP2 is 1:2 TP3 is 1:3 RR.
There are infinite ways to manage your trades to suit your mindset and time.
Works on all instruments
Directly onto your own personal trading view - all devices work
Non repainting
Please follow us to keep up to speed with our trading ideas, live streams (coming soon) and weekly recaps using our strategy.
We are continually marking some tweaks and marginal gain improvements to continue to make this easier for our trades and even more profitable. All updates are given to our members and previous purchasers FOC .
Regards
Darren
Blue FX
DJ30 - new signal, down we come!For more information on our strategy please view our 'Scripts' page on our Trading view profile.
Our V2 strategy shows the SL and multiple TPs on the chart too - these are customisable based on the ATR of each pair.
We have set these so that TP1 is 1:1 TP2 is 1:2 TP3 is 1:3 RR.
There are infinite ways to manage your trades to suit your mindset and time.
Works on all instruments
Directly onto your own personal trading view - all devices work
Non repainting
Please follow us to keep up to speed with our trading ideas, live streams (coming soon) and weekly recaps using our strategy.
We are continually marking some tweaks and marginal gain improvements to continue to make this easier for our trades and even more profitable. All updates are given to our members and previous purchasers FOC .
Regards
Darren
Blue FX

CADCHF TRADE BREAKDOWNGood Evening! Hope you are having a great trading week! Here is a breakdown of how I managed CADCHF this week and my thought process overall. Hope you enjoy!

NZD/USD - Sell Off Incoming?!What Is The Market Telling Us?
We have seen price range between the resistance and support of the channel
Market decived bears with a fakeout of channel on downside, triggering many BUY order for price to re-enter the channel
Previous evel @0.61460 has been broken with over-extended bullish candle, bringing more momentum for price to reach resistance for sell off
Strong bullish rejection has been shown from long upper wicks rejecting horizontal & trendline resistance

USDJPY 25.05.2020Good day everyone!
Rising wedges usually breaks to the downside as we can all see in this USD/JPY pair.
As it stands the US Dollar is getting weaker and I believe that the market could go as low as 107.000 to 106.750 range where we could see a push to the upside again towards the 110 range.
Wish you a great day in trading and be safe!
If this helped you in any way feel free to leave a like.


NZDUSD TP3 hit - only a 19 pip stop loss for a 1:3 RR2 out of 3 winners the last three trades - both winners 1:3 Risk to reward - so if trading with 1% risk - thats a 5% gain in 3 trades.
For more information on our strategy please view our 'Scripts' page on our Trading view profile.
Our V2 strategy shows the SL and multiple TPs on the chart too - these are customisable based on the ATR of each pair.
We have set these so that TP1 is 1:1 TP2 is 1:2 TP3 is 1:3 RR.
There are infinite ways to manage your trades to suit your mindset and time.
Works on all instruments
Directly onto your own personal trading view - all devices work
Non repainting
Please follow us to keep up to speed with our trading ideas, live streams (coming soon) and weekly recaps using our strategy.
We are continually marking some tweaks and marginal gain improvements to continue to make this easier for our trades and even more profitable. All updates are given to our members and previous purchasers FOC .
Regards
Darren
Blue FX


Gold - new signal - a borderline H4 close though - so lets see!We like to see a clean close of our EMA on the h4 timeframe before entering the H1 signal - our close was a little borderline - so this trade is less probable.
Lets see how it pans out.
For more information on our strategy please view our 'Scripts' page on our Trading view profile.
Our V2 strategy shows the SL and multiple TPs on the chart too - these are customisable based on the ATR of each pair.
We have set these so that TP1 is 1:1 TP2 is 1:2 TP3 is 1:3 RR.
There are infinite ways to manage your trades to suit your mindset and time.
Works on all instruments
Directly onto your own personal trading view - all devices work
Non repainting
Please follow us to keep up to speed with our trading ideas, live streams (coming soon) and weekly recaps using our strategy.
We are continually marking some tweaks and marginal gain improvements to continue to make this easier for our trades and even more profitable. All updates are given to our members and previous purchasers FOC .
Regards
Darren
Blue FX

Gold going to grab some liquidity before rising!There has been a breakout in the triangle pattern and finally reaches the previous 9-year high before pulling back below the previous strong resistance @1734 where a lot of reversal and consolidation takes place
Now I believe that there will be more pullback to grab so liquidity at the @1712 level before continue rising!
Please share and like if you agree!
Disclaimer: this is not a trading advice but for informational purpose only ;)

AUDNZD - Running +43 pips and TP1 hitFor more information on our strategy please view our 'Scripts' page on our Trading view profile.
Our V2 strategy shows the SL and multiple TPs on the chart too - these are customisable based on the ATR of each pair.
We have set these so that TP1 is 1:1 TP2 is 1:2 TP3 is 1:3 RR.
There are infinite ways to manage your trades to suit your mindset and time.
Works on all instruments
Directly onto your own personal trading view - all devices work
Non repainting
Please follow us to keep up to speed with our trading ideas, live streams (coming soon) and weekly recaps using our strategy.
We are continually marking some tweaks and marginal gain improvements to continue to make this easier for our trades and even more profitable. All updates are given to our members and previous purchasers FOC .
Regards
Darren
Blue FX

CADJPY - Possible ShortCADJPY seems to be rejecting the top of the Parallel Channel it's been stuck in for the last weeks. Looking at shorting it upon another failed retest. 200EMA also seems to be acting as strong resistance. Looking to take profit at base level as per chart. Stop Loss used in accordance to structure.

USDCAD [SHORT] Double TopAnother Double Top Formation; looking to see this break the neckline and drop to an existing support.

USDCHF LONGWe see the RSI respecting this channel based on the overbought and oversold levels. We wait for price to come back to the demand zone as well as the RSI to be oversold. Once we see a reversal signal on the trendline as well as demand zone . We enter the buy having a RSI signal, ascending trendline and demand zone all aligned.

USDCHF ON SHORT AS WE CAN SEE USDCHF BEEN BOUNCE FROM THE RESISTENCE LEVEL AND IT CAN GO BEARISH TO SUPPORT LEVEL IF ANYONE LIKE MY ANALYSIS .. FOLLOW MY ID AND GIVE LIKE ...HAPPY TRADING

EURAUD LongEURAUD is at a key price level, and also has support from the yearly R1 and an ascending trendline on the daily chart. Targeting the monthly Pivot Point, which is the previous daily swing high, with a stop below the most recent swing low on the hourly chart. Good risk return of 1:8
If you have any ideas supporting or on the contrary to my opinion please feel free to leave a comment and we can trade it together.
Thanks and happy trading.
ÉireTrade CM
