Interesting Gold Penny Stock Potential!Hey Traders! I hope your having a wonderful weekend! I seen this stock while doing some research into gold stocks, and this is a penny stock that seems to have a ton of potential. TRX with a Shs Float of 145.02M and a Market Cap of 115.04M! Looking at the weekly chart we can see clearly the structure in its current uptrend , now for the bulls like myself, will want to set an alert at 1.20 that way we know when to get interested and watch for the re-test and momentum to return to give us that confirmation! Watch out for 0.75 level as a break below there would almost certainly destroy the current uptrend structure and would prob force bearish momentum to push us lower, but a lot of it has to also do with the current gold price. That's what I suggest you set an alert so you can check when its the right time. Hope this helped you, if it did, please be sure to LIKE & FOLLOW to show me support and to stay updated on all of my post's! Tyler Out!
Technical-analysis

Potential Decline (based on S&R, trend lines E waves and strats)Disclaimer: Although I’ve learnt quite a bit of FOREX and am confident in what I’m telling you, I’m just a week in and am using a demo account, so you don’t have to take my word for it.
Here’s why:
Just before September 9th, signs of support have surfaced, since another hit materialised (with resistance appearing just before.) Although this isn’t exactly consitent, it succeeds in somewhat maintaning the pattern, just in an ascending trend (which also seems to be an ascending triangle). Furthermore, there are multiple hits of resistance among the barriers I’ve place; even when the price broke the barrier, it went straight back down. In addition to the recognisable Elliot Wave, I am confident that these signs point to some hesitation, leading to a decline and continuing the pattern in the process
Another important thing, the rate of flunctuation is increasing side by side with little to no price rejection on both sides, indicating that there may be strong buyers (such as the big banks) in action now. These guys need liquidity, and so will take that from us by investing against the majority, ultimately earning off of the loss of many since their investment makes a difference. However, this doesn’t happen all the time and is an educated guess (although it isn’t uncommon phenomenon either).
I hope this is helpful!

GOLD Daily Time-frameIs this likely to stay strong? I expect Gold to make a new Higher leg in the upcoming as long as it stays above my trendline

USDCAD weekly timeframethis pair shows bearish Flag formation on weekly time-frame. Seems like that soon CAD is going to Boom against dollar or Dollar is going to Loose it's strength


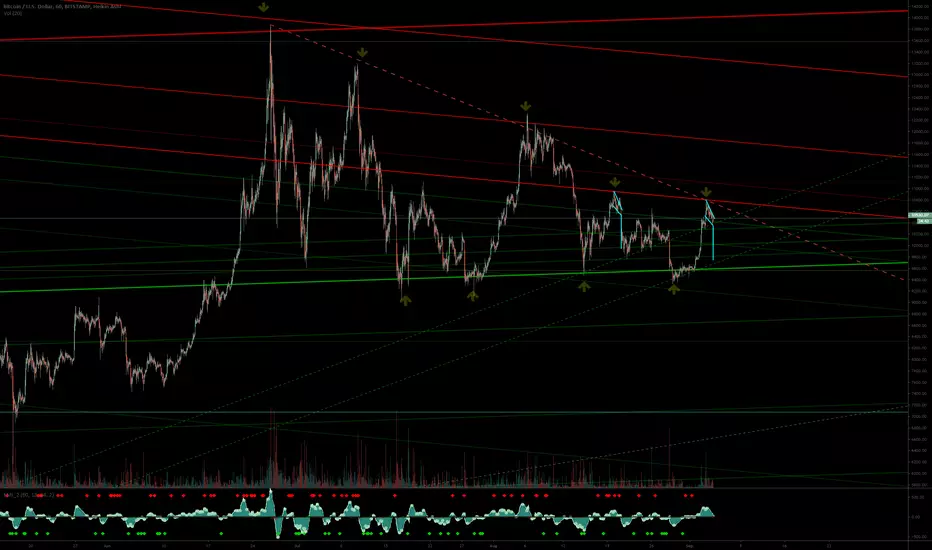
READ CAREFULLY PLEASE! MARKET WILL SHOW YOU WHAT COMES NEXT!HELLO GUYS:
WEEKLY CHART :
- We have many very long wick candles rejecting the 14k resistance!
- Double Top, notice how the bullish volume for the second peak was decreased!
- Rare weekly bearish divergence! very important one.
DAILY CHART:
- We've been consolidating in this descending triangle.
- We've broken and retested the red trendline shown on the chart.
- We've got rejected from the top of the triangle, very likely going to touch the bottom of the triangle 9300-9400 area.
-----------------------------------------------
For the confirmation to the downside we need to see a break of the bottom of the triangle with heavy volume. and wait for the pullback ( in this case a very shallow pullback is expected ) go to lower timeframes 4H - 1H - 15M to make sure the pullback is over and the downward move resumes.
My target is around 7200-7600, that's the zone I'm planning to add to my inventory at. if that never comes then it's fine, there will be many more opportunities.
I try to keep it as simple as possible, LESS IS MORE.
Do yourself a favor and stay away from the lower timeframes if your not day trading or your new to trading. and hey please stop listening to all the moon boys out there who keep changing their positions on the market and have no clue what they're doing. funny how they get all this reputations probably because the market is filled with noobs calling for moon analysis. anyways, NEVER PREDICT THE MARKET, WAIT FOR THE MATKET TO SHOW YOU WHATS COMING NEXT!
PLEASE GIVE IT A LIKE IF YOU FIND ANY VALUE!

BTC big move up or down side?Another big move incoming soon and I reckon a breakout to the downside. I'm sorry for bursting your bubble moonboys, but this unfortunately looking like a blow up top. With the launch of bakkt inc. I'm very bearish short term. Bakkt is bearish, because investments are short term costs. If you invest in something, it will cost you money. This is pretty basic. Besides I'm pretty sure BTC is going towards $7500,- region and worst case bearish scenario; BTC creates a higher low in the $4700 region before the next bull run. Personally I am hoping the next bull run will be at around $7500 region since this is golden retrace region. But I could be wrong, I hope I am wrong then I can finally cash out, but the bullish scenario; BTC creates a lower high at the $11.8k region. But this is less likely to happen. Because this would be quite jinxing. It will get rejected at those regions and if it dips down, it will be dramatic for the moonboys. I predict mass liquidations at these regions. Tip for the moonboys: DO NOT FORGET TO SETUP YOUR STOPP/LOSS.
Always look at both side of the coin. Nothing goes up nor down forever. Only if BTC dies, but I do not think this is even possible anymore. Unless some kind of global EMP burst out and damaging every server, then yeah. But It is becoming more and more apparent that we are living in a digital world. That's why I am very bullish for BTC and even some shitcoins(EOS,LTC,XRP,ETH) long-term.
Don't forget, the trend is your friend. Good luck!
Can This Keep Going?Hey there Trader's! This stock exploded today with huge volatility, and made an impressive 45% gain today . I'll be watching this tomorrow for possible continuation, looking for break and re-test of the important level of 7.90 , I've set my alert! I didn't see any see any news that was released today. If your holding stock, definitely watch 5.71 as a break and re-test off that level going bearish would signal a break in the current structure, good to keep that in mind! Goodluck to everyone! If this information helped you at all, please be sure to LIKE and FOLLOW me here on tradingview for more stock picks! Tyler, Out!

AUD NZD SELLWe look to trend analysis suggesting an AUDNZD short, it may test resistance but eventually, I see a turning point to TP

Gold - BuySetup: Price is testing the edge of the H4 uptrend channel, forming a double bottom, this coincides with a resistance turned support level on the H1. We enter at current price zone, TP set at the high of the week and SL a few pips below the latest rejection.


ZKIN Technical Analysis ZKIN breaking out on Friday and closing at the highs. Broke above its 50-Day MA @ $1.34. Would like to see it continue to form higher lows and break above its 200-Day MA @ $1.53. Pivot @$1.65 and major resistance @ $1.84 we could see move back to $2.00+. China stocks are starting to catch momentum and will continue to watch them going into September as the trade war intensifies.

ADA/USD Chart - Ending Diagonalprice within an ending diagonal triangle -> end phase of a bearish trend (at least temporary)
- 5 wave structure within the ending diagonal seems to be completed.
- Confirmation would be a break of the upper resistance of the ending diagonal. If price rejects form here
price should test the pivotal 0.5er fib level of the Blue range.
-RSI, Stoch and Godmode show bullish divergence on a daily timeframe.
Target would be the 0.382 and 0.5-0.618 fib level which converge with the bigger diagonal resistance.

EURNZD 2nd retest?Seems like that the price is retesting the trendline once again and soon going to give us confirmation whether it's going to bounce off or break above which is going to make the trendline invalid.

SPWR Bull Breakout of Failed Wedge SPWR had a huge bull breakout of a failed wedge bear flag. When a wedge fails there is often a measured move based on the height of the wedge. Prices are also testing above the top of the bear breakout and sell climax of August 2016. However prices are still within a large trading range (always look left!). This increases the likelihood of heavy two sided trading to continue. However the next likely bull target is the middle of the converging triangle and bear breakout around 21.00 which is also around a measured move up based on the wedge.
The buying pressure over the past year or so has been strong enough to make a larger second bull leg up likely. There are quite a few open bull gaps, the most recent being around 12.00 from this bull breakout. If the bulls are able to keep this or the 10.00 gap open it will increase the chances of a strong bull reversal and test of the upper trading range around 35.00.
If you found this helpful please like! Feel free to comment or ask questions.

Scalp Trading, BTC still in a mid-term down-trend, BUT...Longing here is risky due to the mid-term trend is down, not up. Taking a short after a rally will be more in your favor. This trading idea is more for the scalpers and for the public to have an idea what BTC is doing.
I'll keep it simple.
Yellow line - 21 EMA
Pink line - 200 MA
Purple line - 200 EMA
Orange line - 10 SMA
On the 8 HR time-frame, BTC is still holding on to the 200 EMA/200 MA line (purple and pink line.) We closed above the line, and as long as the next 8 HR candle closes above, it'll make for a good bounce on BTC up into the $10,000 area. This number is not exact, but the small bounce should carry between the price range of $10,000 - $10,200. But as I mentioned before, this is just a small bounce. Any rally will be sold into and the overall Mid-term trend will continue.
imgur.com
On the 4 HR, there is bullish divergence forming on the CCI. This will more than likely be an entry signal on the 4 HR as the CCI re-enter the lower band. When I see a bullish divergence, I typically want to see price retest its 21 EMA. On the 4 HR, the 21 EMA happens to be around the $10,100 range. This has nice confluence with our 8 HR.
imgur.com
On the Daily time-frame, you can see the 50 EMA is also hovering around the $10, 100 range. Going forward, this should act as resistance and a good sell point for any scalpers. The Mid-term trend is still down, as we make our way towards the mid-8,000's to meet up with the 21 EMA on the weekly time-frame.
*If anyone can show me how I can post multiple charts without using a link, i'll be grateful.*
If you like my analysis of the market and it helped you learn or made some money, please consider using my referral links.
www.deribit.com
www.bitmex.com

CADJPY Sell SetupOur Free Channel members also taking advantage of this free setup, If you find this double top formation with Daily Trendline bounce Useful then let us know in the comment section.

EURAUD - way down we goTook and given this trade in our premium channel and Going well but we closed before market closure and might enter again next week on retracements.

USDCAD expecting Lower High nextWhat do you think about this analysis? Price need to take a Low high leg from this support region


Bullish pattern formation on AUDNZDBullish pennant formation on AUDNZD. An upside break is favoured on this setup with a target at 1.08500


Long Term EURUSDWill go up taking order in supply zone then drop to demand zone . Long Term EURUSD , take care of your money management , Risk Reward is 1:3
