XAU/USD 1H – Bullish Continuation from Demand Zone?📊 XAU/USD (Gold) 1H Analysis – Bullish Continuation Setup
🔹 Market Structure: Gold has been in a strong uptrend, with price currently consolidating near a key demand zone.
🔹 Key Levels:
🔴 Resistance: $3,050 - $3,060 (Potential target)
🟣 Demand Zone: $3,030 - $3,035 (Support area)
🟠 Deeper Support: $3,025 (Break below weakens bullish bias)
📈 Potential Trade Setup:
1️⃣ A possible pullback into the demand zone could attract buyers.
2️⃣ Price may wick below liquidity before reversing.
3️⃣ If support holds, we anticipate a move toward $3,050+.
✅ Entry Zone: $3,030 - $3,035
🎯 Target: $3,050 - $3,060
🚨 Stop Loss: Below $3,025
⚠️ Watch for price action confirmation before entering. A strong bullish candle from support could signal entry. Let the market show its hand! 🚀✨
Technical-indicators

XAU/USD Bullish Outlook: Wyckoff Accumulation & Breakout PotentXAU/USD (Gold) - 2H Chart Analysis 🏆📈
🔹 Wyckoff Structure Insight
The chart shows signs of a Wyckoff Accumulation phase.
UTAD (Upthrust After Distribution) at the previous highs suggests a liquidity grab.
Test of the resistance level before a strong rejection downward.
SOW (Sign of Weakness) was observed, but buyers regained control.
🔹 Key Technical Levels
Fair Value Range marked below, showing a potential area of demand.
Unfilled Imbalance (EMB unfilled) signals an area where price might revisit before continuing upward.
Gap below indicates a previous liquidity sweep before the bullish reversal.
🔹 Trend & Price Action
The 200 EMA (red line) is holding as dynamic support.
Current price action is showing higher lows and bullish structure development.
Projected bullish move 📈 is expected to test the $2,940+ region.
🔹 Trading Bias: Bullish ✅
A retracement to the EMA or minor pullback could offer re-entry opportunities.
Invalidation level: Below $2,900, where momentum could shift bearish.
🚀 Gold remains strong; watch for breakouts above $2,940!

AUD/USD at Critical Support – Breakout or Breakdown? 🔍 AUD/USD Daily Chart Analysis – March 9, 2025
Key Observations:
Ascending Channel 📈
The price is moving within an upward channel, indicating a short-term bullish trend.
Support & Resistance Zones 🟦🟥
Support: Around 0.6231 - 0.6200 (blue zone). A breakdown below this could push the price lower toward 0.6129 (orange zone).
Resistance: The 0.6460 - 0.6584 level is the next major hurdle for bulls.
200-Day Moving Average (Red Line) 🔴
The price is currently below the 200-MA, indicating a long-term bearish sentiment. However, a breakout above this level could signal a trend reversal.
Potential Scenarios 📊
✅ Bullish Case: If the price sustains above 0.6231, we could see a bounce towards 0.6460 - 0.6584 in the coming weeks.
❌ Bearish Case: A break below 0.6231 could push the price toward the 0.6129 - 0.6100 region before finding support.
Trade Plan 🎯
Buy Zone: Around 0.6231 with a stop-loss below 0.6200.
Sell Zone: If price rejects 0.6460, a short position could be considered with a stop above 0.6584.
📊 Conclusion: AUD/USD is at a key decision point. Bulls need to hold support for further upside. A breakdown could trigger a bearish move.

GBP/USD 4H Analysis – Bullish Momentum & Key Demand Zones📊 GBP/USD 4H Analysis – Smart Money Concepts (SMC) Perspective
Current Market Structure:
📈 Bullish Momentum: The price is currently trending upwards after breaking a short-term high (SH) and liquidity zone.
🔄 Change of Character (CH): Confirmed as the price broke previous resistance, signaling a possible trend continuation.
Key Zones & Levels:
🟣 H4 Block Order (Demand Zone): Marked in purple, this area aligns with a strong order block, indicating potential buying interest if the price retraces.
🟥 Daily Fair Value Gap (FVG): Above the demand zone, acting as a potential area for price rebalancing before resuming the uptrend.
🔴 200 EMA at 1.25179: Serving as dynamic support, aligning with the demand zone for potential buy setups.
Potential Scenarios:
📉 Retracement to Demand Zone (1.2500 - 1.2550)
Buyers may step in at the H4 Block Order & Fair Value Gap.
Price could form a higher low before continuation.
📈 Bullish Expansion to New Highs (1.2750 - 1.2800)
If demand holds, expect a strong push-up towards liquidity areas.
Breakout could trigger momentum buying.
Bias:
✅ Bullish (Higher Highs & Higher Lows Forming)
⚠️ Caution: If price breaks below 1.2500, sentiment may shift bearish.

AUD/JPY 4H: Potential Reversal at Support Zone !!Price Action: The price is trading below the 200-period EMA, indicating that the general trend is bearish. However, there's a price bounce near the orange box (support zone), suggesting that a reversal could occur from this level.
Support and Resistance Zones:
The support zone is the orange box around 95.85–96.10. Price is near the lower bound of this zone, which could provide a buying opportunity if the price holds above it.
Resistance is at the higher level of around 97.55, and there's also a minor resistance around 96.70, which is likely a short-term obstacle.
EMA (200): The 200-period EMA (at 96.69) is acting as a dynamic resistance, contributing to the overall bearish bias. If price closes above it, there could be a shift in sentiment.
Potential Trade Setup: The analysis shows a possible buying opportunity if price holds above the orange box (95.85–96.10). A potential upside target would be around the 97.55 level, which aligns with previous price action resistance.
Overall, this chart is suggesting a bounce off the support zone with a possible move towards resistance. However, the trend remains bearish as long as the price stays below the 200 EMA.

BTC/USD Analysis: Bullish Momentum Faces Resistance at $110,000!Looking at this chart of BTC/USD on the 4-hour timeframe:
Current Price: The price of Bitcoin is currently around $98,468.88, with a slight increase of +0.24% for the session.
Key Levels:
The price is approaching a strong resistance zone near the $110,000 level, which is marked with a shaded area above the current price. This could act as a psychological barrier or a sell-off zone if the price reaches this level.
On the downside, there is support near the $94,000 level, indicated by a box in the lower part of the chart. The market has shown a tendency to bounce from this zone in the past.
200 EMA: The 200-period Exponential Moving Average (EMA) is currently around $98,193, and the price is trading slightly above it, which indicates that the trend may be leaning bullish, but a pullback to this level could be expected.
Price Action: The chart shows a series of upward movements after consolidation in the lower range, which suggests bullish momentum. However, the proximity to resistance means the price might face some challenges breaking through the $110,000 zone.
Overall, there’s potential for Bitcoin to test higher levels, especially if it can clear the resistance near $110,000. But a pullback or consolidation around the $94,000 region could also be on the cards. Keep an eye on volume and price behavior around these levels to confirm the next move.

BTC/USD: Key Levels and Breakout Watch!!Market Overview:
The BTC/USD pair is currently in a consolidation phase, with price action contained between two key levels. This analysis aims to evaluate the market structure, potential breakout points, and the most likely directional move based on technical indicators. 📈
Price Structure & Key Zones:
Resistance Levels:
97,900 USD: This key resistance level has been tested multiple times. The market has recently interacted with it, showing signs of rejection. 🚧 Breaking above this zone would be a bullish sign. A sustained break would confirm a potential uptrend. 🚀
100,258 USD: The next critical resistance lies just above the previous level. A breakthrough here could confirm the market is ready to rally higher! 🎯
109,546 USD: The ultimate target zone, with further resistance likely. 🌌 A break through this area would confirm a significant bullish move.
Support Levels:
94,000-95,000 USD: Strong support in this range, where price has bounced higher before. 📉 A failure to hold this level could signal a bearish reversal. ⚠️
Trend Analysis:
200 EMA: The price is above the 200 EMA, showing a bullish short-term trend. 📊 A positive sign of upward momentum, confirming the current market sentiment is more inclined toward the upside. 🚀
Rising Wedge Formation: This is a continuation pattern, suggesting that the market could break higher if resistance is overcome. 🔼 The potential move toward 100,258 USD could be the next phase if the breakout occurs.
Volume & Momentum:
Volume has been relatively low, indicating consolidation. 💡 A breakout with higher volume would confirm the strength of any directional move. 💥
Potential Scenarios:
Bullish Scenario:
If the price breaks above 97,900 USD, we can expect a bullish move toward 100,258 USD, with the 109,546 USD zone as the next target. 🚀📈
Bearish Scenario:
A failure to break resistance could lead to a pullback to 94,000-95,000 USD, or even lower if support breaks down. ⚠️ A downside move may signal a deeper correction.
Conclusion:
The market is at a crucial point. If Bitcoin can break through 97,900 USD, we may see a bullish rally toward 100,258 USD and 109,546 USD. 🚀 If resistance holds, expect a possible move toward lower support levels. 🛑 Keep an eye on volume and key levels! 🎯
Let’s stay alert and react accordingly! 📊📈

XAU/USD Technical Analysis: Testing Key Resistance at 2,935 - !!XAU/USD (Gold vs US Dollar) – 30-Minute Timeframe Analysis
Current Market Context:
The XAU/USD pair has been in an overall bullish trend, evidenced by the price being positioned above the 200-period Exponential Moving Average (EMA), indicating the dominance of buyers in the market. However, the price action currently suggests a potential reversal or consolidation at key resistance.
Key Levels:
Resistance Zone: The price has approached a significant resistance area near 2,935, which has historically served as a reversal zone. The market is currently struggling to maintain bullish momentum at this level, with a recent rejection visible.
Support Zone: A clear support level can be identified around 2,920, where price has previously found buying interest. A break below this could indicate a deeper retracement towards lower levels.
Technical Indicators:
200 EMA: The price is trading above the 200 EMA, which traditionally signals an uptrend. However, the recent pullback suggests the market could be testing this level for support.
Price Action: The formation of lower wicks and the rejection at the resistance zone may suggest waning bullish momentum, which could trigger a pullback or consolidation in the short term.
Potential Scenarios:
Bullish Continuation: If the price successfully breaks above the resistance zone (around 2,935), we could expect a continuation towards higher levels, targeting 2,940 or beyond. Confirmation of this move would require a strong close above the resistance with increased volume.
Bearish Reversal: Should the price fail to break above the resistance and begin to show signs of rejection (as seen with the current price action), a potential short-term bearish move could occur. The first target would likely be the support around 2,920, with a deeper retracement towards 2,915 if the market sentiment turns more risk-averse.
Conclusion:
At present, XAU/USD is at a crucial juncture. The key resistance zone at 2,935 is critical for determining the next directional move. A failure to break above this level could lead to a short-term bearish retracement, while a successful breakout would reaffirm the bullish trend. Traders should monitor for price action confirmation near these levels to assess the most probable market direction.

EUR/GBP Technical Analysis: Bullish Rebound from Key Support!!Key Observations:
1. Support Zone & Trendline:
A support zone (marked in red) is visible, which aligns with a rising trendline. The price has tested this area and bounced upwards, suggesting demand at this level.
2. Bullish Rejection & Confirmation:
The recent price action shows rejection of lower prices within the support zone.
A bullish candle has emerged after the price tested this zone, hinting at potential upside momentum.
3. Moving Average Resistance:
The 200-day EMA (Exponential Moving Average) at 0.84058 acts as a significant resistance level.
If the price sustains above the trendline and support zone, a potential retest of the 200 EMA is likely.
4. Price Target & Direction:
The blue arrow suggests an expected bullish move.
The immediate target is around 0.8400 - 0.8450, where the 200 EMA and previous price action resistance exist.
Conclusion & Trading Plan:
Bullish Bias: As long as the price holds above the trendline and support zone, further upside is favored.
Breakout Confirmation: A daily close above 0.8350 could further confirm bullish momentum.
Bearish Scenario: If the price breaks below the trendline and support zone, it could trigger a bearish move toward 0.8250.

Crypto Total Market Cap Consolidation: Imminent Breakout Ahead?Key Observations:
1. Symmetrical Triangle Pattern:
The price is consolidating inside a symmetrical triangle, with lower highs and higher lows.
A breakout in either direction is imminent.
2. Exponential Moving Average (EMA 200):
The 200-period EMA is at 3.26T, currently acting as resistance.
A breakout above this level could indicate a bullish trend continuation.
3. Relative Strength Index (RSI 14):
Current RSI: 49.34, slightly below the neutral 50 level.
This suggests neutral momentum, with no clear overbought/oversold signals.
A move above 55-60 could indicate increasing bullish momentum.
Potential Scenarios:
1. Bullish Breakout:
If TOTAL breaks above the triangle resistance and EMA 200, the next targets could be 3.3T - 3.5T.
Confirmation requires high volume and RSI above 55.
2. Bearish Breakdown:
A break below the triangle support could push TOTAL toward 3.0T or lower.
RSI dropping below 40 would confirm bearish momentum.
Conclusion:
The market is in a consolidation phase, awaiting a breakout. Watch for volume confirmation and EMA 200 reaction to determine the next move.

Silver (XAG/USD) Gaining Momentum – Next Target $32-$33?Silver is showing strong bullish momentum, currently trading around $31.53, with a +1.25% gain. The price has broken above key resistance levels and is now trading above the 200 EMA (currently at $30.48), which signals a potential continuation of the uptrend.
There's a fair volume range above, along with an internal liquidity level (Int. LQ), which could act as the next target. The market has already filled a previous market block (MB), suggesting that the structure is clean for further upside.
If this bullish momentum holds, the price could push toward $32 - $33 in the short term. A retest of support near $30.50 (200 EMA) would still keep the uptrend intact.

USDCAD Bearish Breakdown: Retest & Drop Incoming? USDCAD Daily Chart Analysis 📉🔥
1️⃣ Trend Breakdown:
The pair was in an uptrend but has now broken below the ascending trendline, signaling a potential bearish shift.
2️⃣ Resistance Zone (Supply Area) 🟦:
The 1.4350 - 1.4450 region acted as resistance, rejecting price strongly.
Multiple rejections in this area indicate strong selling pressure.
3️⃣ Bearish Confirmation 📉:
Price is now trading below the broken trendline.
The recent daily candle closed bearish, confirming sellers are in control.
4️⃣ Key Support Areas 🔍:
1.3957 (200 EMA) → A crucial dynamic support level.
1.3916 → Previous key level that may act as strong demand.
5️⃣ Projected Move ⬇️:
Price may retest the broken trendline (pullback).
If rejection occurs, further drop towards 1.3950 - 1.3910 is likely.
📌 Final Thought:
A bearish move is in play! Watch for a pullback to retest the broken structure before considering further shorts. If price breaks below 1.3950, expect further declines.
💭 What’s your bias? Bulls 🐂 or Bears 🐻?

EUR/USD Breakout Imminent? Key Resistance in Focus!📊 EUR/USD Daily Chart Analysis – Bullish Breakout Incoming? 🚀
🔹 Key Levels:
Resistance Zone (Blue Box): Around 1.0450 - 1.0500
Support Zone (Red Box): Around 1.0250 - 1.0300
200 EMA (Red Line): Acting as a dynamic resistance near 1.0663
🔹 Price Action & Structure:
Price is testing a strong resistance zone (blue box) after multiple failed attempts.
A clean breakout above this level could trigger a bullish rally towards 1.0600 - 1.0700 (next resistance).
If rejected, a pullback towards 1.0300 before another attempt is possible.
🔹 Market Sentiment & Bias: ✅ Higher lows forming = bullish pressure building. ✅ Break and retest scenario likely, as indicated by the projection. ✅ 200 EMA remains a key target for bulls.
📈 Potential Trade Setup:
Breakout above 1.0500 → Buy opportunity
Rejection → Short-term pullback before another attempt
🎯 Bullish Confirmation Above 1.0500 📊💹

XAU/USD 30-Min Analysis – Bullish Reversal & Breakout SetupGold (XAU/USD) - 30-Minute Chart Analysis 🏆📊
Key Observations:
Market Structure Shift (CHOCH - Change of Character) 🔄
The chart marks a CHOCH, signaling a potential shift from bearish to bullish momentum.
This suggests that the recent downtrend may have concluded, and buyers are stepping in.
Liquidity Grab & Stop Hunt 🎯
The price dipped below the SELL STOP level, likely triggering stop-loss orders.
A sharp rejection followed, indicating strong buying interest at lower levels.
200 EMA (Exponential Moving Average) as Dynamic Support 📈
The price tested the 200 EMA (2,885.011) and bounced off, reinforcing the bullish case.
This suggests that institutional traders might be accumulating positions near this zone.
Bullish Breakout Potential 🚀
The highlighted grey box represents a potential order block or accumulation zone.
A breakout above this area could confirm the bullish continuation towards the target level (2,942.963).
Trade Setup:
Entry Zone: Retest of the grey accumulation zone (around 2,894 - 2,899).
Stop-Loss: Below the recent low (around 2,880).
Target: 2,942.963 (previous resistance & psychological level).
Risk-Reward Ratio: ~2.5:1 (optimal for a trade execution).
Final Thoughts:
🔸 If price holds above the breakout zone, we could see a strong rally towards 2,942.
🔸 If it fails to hold and falls below 2,880, expect further downside retracement.
🔸 Bullish sentiment is favored, but confirmation is key! ✅

XAU/USD Breakout – Targeting $2,950?XAU/USD (Gold) 1H Chart Analysis 🏆📊
🔹 Current Price: $2,926.285
🔹 Recent High: $2,927.305
🔹 Recent Low: $2,923.840
🔹 200 EMA Support: $2,870.242 (far below current price)
Key Observations & Setup
✅ Breakout Confirmed: The price has broken out of a descending trendline, signaling bullish momentum.
✅ Target Zone: The red resistance zone near $2,945 - $2,950 is the next potential target.
✅ Potential Move: Price is expected to climb toward this resistance area before facing rejection or continuation.
✅ Support Levels: If the breakout fails, the previous resistance (now support) around $2,915 - $2,920 could be tested.
Trading Plan 📈💡
Bullish Play: If price holds above the breakout level, targeting $2,945 - $2,950 could be a solid setup.
Bearish Rejection: Watch for rejection at the resistance zone for possible short opportunities.
EMA Support: The 200 EMA remains far below, reinforcing overall bullish sentiment unless a major pullback occurs.
📢 Final Thoughts: This is a classic breakout & retest scenario. If momentum sustains, we could see a push into the resistance zone. Stay cautious for any rejection signals! 🚀🔥

Gold Analysis – Potential Pullback Within Ascending ChannelKey Observations:
Current Price: $2,900.48
Recent High: $2,907.29
200 EMA (Red Line): $2,758.59 (Strong support level)
Projection: Price may correct lower towards the channel’s lower boundary (~$2,875)
Analysis:
📊 Short-Term Bearish: A pullback could happen before further upside if the trend holds. If price breaks below the channel, a deeper correction towards the 200 EMA might follow.
🔍 Trading Idea: Traders might look for buying opportunities at the lower trendline (~$2,875-$2,880) if price shows support.

XAU/USD Bullish Breakout – Gold Eyes $2,928 & Beyond!🔥 XAU/USD Analysis – February 4, 2025 🔥
📈 Current Price: $2,842.18 (+0.98%)
📊 Trend: Bullish momentum inside an ascending channel
🔍 Key Levels to Watch:
🔵 Resistance: $2,928.75 – If this level breaks, expect further upside movement! 🚀
🔵 Support: $2,729.13 – Strong demand zone; watch for pullbacks.
🔴 EMA 200: $2,534.85 – Long-term bullish confirmation above this level! ✅
📉 Possible Scenarios:
✅ Bullish Case: Price continues the uptrend, targeting $2,928.75 next. If broken, gold could see $3,000+ soon! 🎯🔥
⚠️ Bearish Case: A rejection from resistance could lead to a pullback towards $2,800-$2,730.
💡 Final Thoughts:
The bullish momentum is still strong, and dips could be buying opportunities! 📊👑 Watch for price action near key levels.
📢 Gold bulls, are you ready for new highs? 🚀💰

Gold (XAU/USD) 4H: Bullish with Possible Pullback?Gold (XAU/USD) 4H Chart Analysis: Bullish Trend with Possible Pullback
Key Observations:
1. Price Action & Trend:
The price is currently trading around $2,817.685.
The trend appears bullish, with a strong upward move.
There is a marked internal liquidity (Int. LQ) taken, indicating that liquidity has been absorbed, which could lead to further upside.
A market structure break (MB filled) suggests past resistance turned into support.
2. Technical Indicators:
Exponential Moving Average (EMA 200, red line) is at $2,709.123, which is significantly below the current price. This suggests that gold is in a strong uptrend.
Relative Strength Index (RSI, 14 close) is at 68.56, nearing the overbought zone (70) but still has room for potential upside.
3. Projected Movement:
The chart suggests a potential pullback (small consolidation) before further upward movement.
Fair volume ranges (marked in red) indicate levels where price may slow down or consolidate before continuation.
Price is above key liquidity levels, which may act as support.
Conclusion:
The trend remains bullish, and the price could continue rising after a minor consolidation.
Key levels to watch:
Support: Around $2,800 (former liquidity level).
Resistance: Next potential target is $2,840 - $2,860.
Risk Consideration: RSI is approaching overbought levels, so a short-term correction could occur before another push higher.

Bitcoin (BTC/USDT) 4H Analysis: Critical Support Test –(caption)🚀 Bitcoin (BTC/USDT) 4H Chart Analysis (Feb 2, 2025) 📊
🔍 Key Observations:
1️⃣ Strong Support Zone (Red Box) 🛑
BTC is currently testing the $98,000 - $99,000 support zone.
This level has previously acted as a demand area, meaning buyers might step in.
2️⃣ 200 EMA (Exponential Moving Average) Resistance (Red Line) 📉
The 200 EMA at $100,718 is acting as dynamic resistance.
A break and close above this level would indicate bullish strength.
3️⃣ Key Resistance Levels 🚧
$100,718 (200 EMA Resistance)
$102,884 (Major Horizontal Resistance)
If price breaks these levels, next targets: $104,000 - $106,000.
4️⃣ Key Support Levels 🛠️
$98,000 - $99,000 (Current Demand Zone)
$90,000 - $89,184 (Next Major Support Below)
📈 Possible BTC Price Scenarios:
✅ Bullish Case (Price Bounces from Support) 🟢
If BTC holds above $98,000 - $99,000, a move toward $102,884 and higher is possible.
Breaking above $102,884 could trigger a rally toward $104,000 - $106,000.
Watch for volume increase & bullish candlestick confirmation.
❌ Bearish Case (Break Below Support) 🔴
If BTC breaks below $98,000, we could see a drop to $90,000 - $89,184.
A break below $90,000 could lead to further downside toward $88,000.
Watch for strong selling pressure & breakdown candle.
📊 Final Thoughts: BTC at a Critical Level!
🚨 Decision Point: BTC is at a key support level—will bulls step in, or will bears take control?
🔹 For Bulls: Need to reclaim $100,700+ for bullish continuation.
🔹 For Bears: Losing $98,000 could open the door for a drop toward $90,000.
👀 Keep an eye on price action & volume for the next big move!
🔥 What’s your bias? Bullish 🚀 or Bearish 📉? Let’s discuss!

BTC/USDT 4H Analysis: Bearish Breakdown or Rebound?📉 Bitcoin (BTC/USDT) 4H Chart Analysis
🔴 Overview:
Bitcoin is trading at $101,847 (-0.22%) on the 4-hour timeframe.
The price is moving within a descending wedge/pennant pattern.
Key EMA (200): Currently at $100,781, acting as dynamic support.
📌 Key Levels & Analysis:
Resistance Zone (~$102,000 - $103,000): Price is struggling to break above this level.
Support Zone (~$97,500 - $98,500): A key demand zone where buyers may step in.
⚠️ Potential Scenarios:
Bearish Breakdown ⬇️
If BTC loses the $100,800 EMA support, a drop towards $98,000-$97,500 is likely.
The marked arrow suggests this bearish move.
Bullish Rebound ⬆️
If BTC holds above EMA 200 and reclaims $102,000, a breakout towards $104,000-$106,000 could follow.
🧐 Final Thoughts:
Short-term trend: Bearish bias unless price reclaims resistance.
Watch for a break below $100,800 for further downside.
RSI & Volume Confirmation Needed for stronger signals.

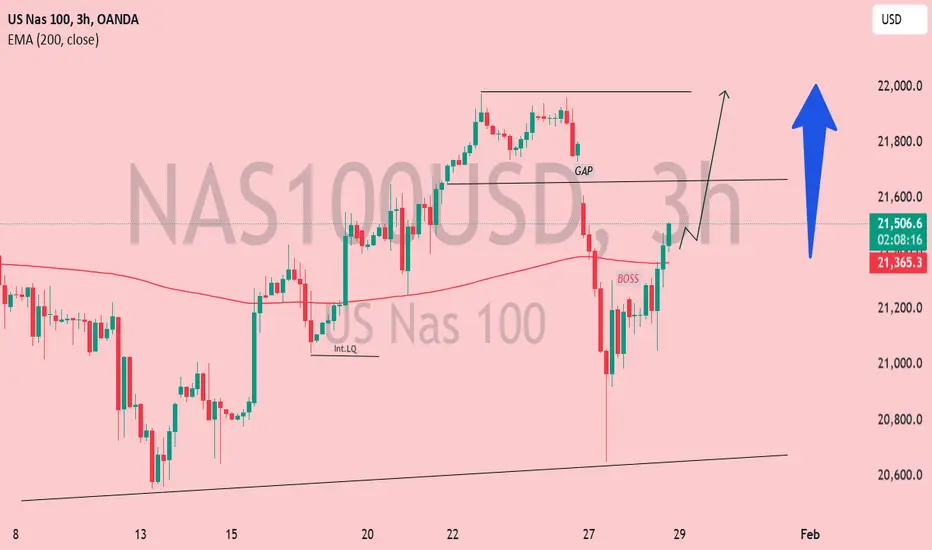
NAS100USD Bullish Reversal: Gap Fill & Upside Target in Focus📢 Title: NAS100USD Bullish Reversal: Gap Fill & Upside Target in Focus 🚀
📊 Current Price Action:
The latest price is 21,490.1 📈, showing a +0.29% gain (+62.3 points) ✅.
The 200 EMA (Exponential Moving Average) 📊 is at 21,365.2, suggesting the price is slightly above this key moving average.
📌 Key Levels & Market Structure:
🔻 BOS (Break of Structure): Indicates a bearish structure break before the current recovery.
📉 GAP: There is a visible gap in the price action, which often acts as a magnet for price movements.
💰 Liquidity & Internal Liquidity (Int. LQ): Suggests areas where institutional interest may have been present.
📈 Trend & Potential Direction:
The price recently bounced off the 200 EMA 🔄, indicating possible bullish momentum 📈.
The ⬆️ arrow projection suggests a bullish outlook, targeting the gap fill and potentially moving higher towards 21,800 - 22,000.
If price holds above 21,365, the bullish thesis remains valid ✅.
🏆 Conclusion:
🐂 Bullish Bias:
Price is recovering from a break of structure (BOS) and pushing higher towards unfilled gaps 📊.
📍 Key Levels to Watch:
🛑 Support: 21,365 (200 EMA) – If it breaks below, downside risk increases ⚠️.
🚧 Resistance: 21,600 (gap area) – Price might struggle before breaking through 🚀.
💡 Trade Idea:
A 📈 long position targeting 21,800+, with a stop loss below 21,365 🔥.
EUR/GBP Bearish Momentum – Eyes on Support Zone!📊 EUR/GBP Daily Chart Analysis (28th Jan 2025)
🔹 Overview:
Pair: EUR/GBP
Current Price: 0.83855 📉 (-0.10%)
Key Indicators:
200 EMA (Red Line): 0.84129 (Price is below the EMA, indicating bearish sentiment)
Resistance Zone (🟠 Orange Box): ~0.84200 - 0.84400
Support Zone (🟢 Green Box): ~0.83200 - 0.83400
🔻 Bearish Outlook:
Price recently rejected the resistance zone and started declining.
It is now trading below the 200 EMA, suggesting potential further downside.
Next Target: The support zone (~0.83200 - 0.83400) is likely the next major level.
📉 Possible Scenarios:
1️⃣ Bearish Continuation ⬇️
If the price maintains momentum, it may head toward the support zone (~0.83200).
A break below support could trigger further downside.
2️⃣ Bullish Rebound 🔄
If the price finds strong buying interest at support, a rebound toward the resistance (~0.84200) is possible.
A breakout above 200 EMA could shift momentum back to bullish.
🎯 Trading Considerations:
Short Opportunity: Below 0.83800, targeting 0.83400.
Long Opportunity: If support holds around 0.83200, aiming for a move back to resistance.
Breakout Watch: A move above 0.84200 could trigger bullish momentum.
🔥 Conclusion: Currently, the trend is bearish, and price action suggests further downside toward the support zone. Keep an eye on price behavior around 0.83400 for potential reactions.

Gold (XAU/USD) Reverses from Resistance – Is a Sell-Off UnderwayGold (XAU/USD) Hits Resistance and Faces Reversal – Is the Sell-Off Beginning?
Gold surged to test the upper boundary of its ascending channel, touching key resistance. However, bullish momentum seems to be fading as sellers step in, pushing prices lower. This could signal the start of a pullback, potentially targeting mid-channel support or even the 200 EMA.
If buyers fail to reclaim control, we may see a deeper correction. Eyes are now on the next key support levels—will gold find strength, or is a larger sell-off underway?
