Harmony is within a huge correctionAs you see the chart above, Harmony (due to wave 2) wants to form a huge correction. I think wave A of the correction is completed and now it's within wave B. Then wave C will be started and collapsing continuation. After that wave 5 which is a upward one will be started. So pay attention to it!
Technical-indicators

EURGBP [LONG] Institutional TradingLooking at the chart, we have seen within the blue box 4 touches of this level. This is filling the retail traders with confidence that a breakout below which is what's just occurred will continue that trend.
Nice long candle this morning clearing the liquidity on buys and now that people are putting on sells they will push the price back up to clear those stops for further liquidity then onto reaching equal highs.
The pink box I've drawn indicates the money they will need to get back at some point so could see this as a long term trade up to that point.
TP#1 is the first green line
TP#2 is the second

Probing the Indicator Rabbit Hole. Bullish Divergence.This is a stock trend trading strategy that is heavily reliant on indicators. I was seeing if I could use this same strategy for futures, and surprising no one, it does translate.
You need at least 2 of the indicators to be giving you exactly what you want, and the other indicators to be at least not working aggressively against you.
This is a super crisp example, literally everything came out right. That's why I chose this example. Not an accident. If you really want to test the metal of this strategy, by all means, don't let me stop you.
The ending conclusion, if you've got your head right should be the following : "If I had been able to notice everything going on here I could have had a lot of confidence using a high probability order placement."

GBPUSD Signal GBP Markit Construction - 7 Jan 2021GBPUSD has sold off now giving us a chance to enter long prior to the GBP Markit Construction Data release, which shows business conditions in the UK construction sector. Technically the pair is above the 1.3565 pivot but below the 1h 50 moving average. We anticipate further upside on the cable into the 1.3670 level.

$NIO looking for a parabolic move here.$NIO looking for a parabolic move here. $NIO already established support above the 50 Simple Moving Average. With the news that came out over the weekend this might create a parabolic move to the upside.
Short Term Target Area: 64
Short Term Target Area 2: 75

OMG - Gearing up for a breakout? Over 200% Potential Long Term.Looking at OMG on the daily Chart, there's some interesting things potentially shaping up.
Most obvious is the descending triangle we've been trading in. OMG trades on a bullflag historically; which is characterized by a long period of sideways or slightly descending movement followed by a massive pump.
We see a fairly recent retest of bottom support in late september which held strong.
We have steadily increasing volume, however the biggest spike was on a retest of the upper channel boundary that was rejected, marking a decent red day.
RSI is very middling at the moment; could go either way with current priority being up.
Bottom line: good indicators for a breakout coming at some point in the next few weeks, however the heavy sell volume on the upper boundary retest makes me think we might see a lower support retest like in September before things really start cooking.
Wait to see if we retest or if we can break through that upper boundary without a swift rejection.
Short term TP's are green fibs, potential for ATH or more when the bull flag pops.
Thanks to everyone for the support over the last while, let's keep this going :)
--
I'm a guy that you don't know posting his ideas on the internet for the sake of improving as a human being. If you take this as financial advice, that's on you.
If you like my analysis, then leave a like and feel free to follow for more free content. If you don't like it, then leave like but do it with anger; I'll be able to tell the difference. Feedback, criticism and crude humor are welcome 🤙😁


USDCAD SHORTLooking for the TDI cross which has confirmed on M30 and shorter term MA Cross also confirmed. High market baseline suggesting an overbought currency pair - looking for bearish reversal throughout today

EURUSD - ShortChart patterns on all time frames suggest that the pair in bearish mode. The price broke thorugh significant resistane level but regained to an extent however, technical indicators and price action suggest that the price of EUR will be in bearish mode.
Take position around 1.08250 with 1st TP @ 1.07650

USDCHF SHORTBreaking through the support (confirmation needed on candle close), we look to the downside - as confirmed by the tdi and moving averages.

GBPUSD | CONTINUES TO MOVE UPWARDS! (UP)PLEASE SUPPORT THE IDEA BY SMASHING LIKE AND GIVING A COMMENT!
Hello Forex Trading Lions,
Today we are trading GBPUSD, its on a nice uptrend as well as the moving averages are shooting to the upside, it also has recently broken a important level of sensitivity.

Time to close BAT trade. Good work on your %50 gains traders!Ok guys. You can see I called the .30 cents hit spot on. If you have been hanging with me on this one since the .20 cents mark, you should have nailed %50 gains. That's remarkable!
Time to take those profits. Do not get greedy on this one. BTC (which the market follows) could still drop to 6k one more time before we're finally 100% bullish

BAT target .30 Cents IF we do this!BLUF: Neutral until we break above the blue trendline.
Hi traders. Just a quick heads-up. BAT could be headed for %50 gains if we break above that BLUE downtrend line in my chart. Currently it is getting squeezed. A decision must be made soon. Wait for the break above the blue trendline and confirmation on the daily before trading this.
I'll try to keep you posted.

Supports held! .30 cents within weeks once this happens...Our supports are holding tight traders. This is excellent. We still need to poke through that overhead as I mentioned in my last post (below). Other than this, all signs are looking good.

Pressing Top of Channel ...AgainBLUF: If we are going to go up the move by the bears must be extremely powerful! Do we they still have enough in them?
Once again we find ourselves pressing the underside of the top of our longtime channel (since July). This is now the 5th time we've hit this top. I expect us to break out and to the upside sometime within the next few days to weeks, but if we are going to do so soon, then we will find some major resistance ahead. Not only must we break through the top of our channel but we are also facing the 200MA. Just above that? A few more levels of resistance from way back at $9300 and $9800.
On the RSI chart, you can see that the bulls have already broken out of our down channel. This is a great sign! However, once again we are finding resistance at the 70.0 mark.
I remain neutral for now. The next few days will tell.

THE LONG OF YOUR LIFEGuys, this is the long of your life : BCH just broke a big resistance(in yellow) and retested it with success, it will go up to 0,236 of fibonacci, so to around 0,0667 btc.
THIS IS NOT A FINANCIAL ADVICE !

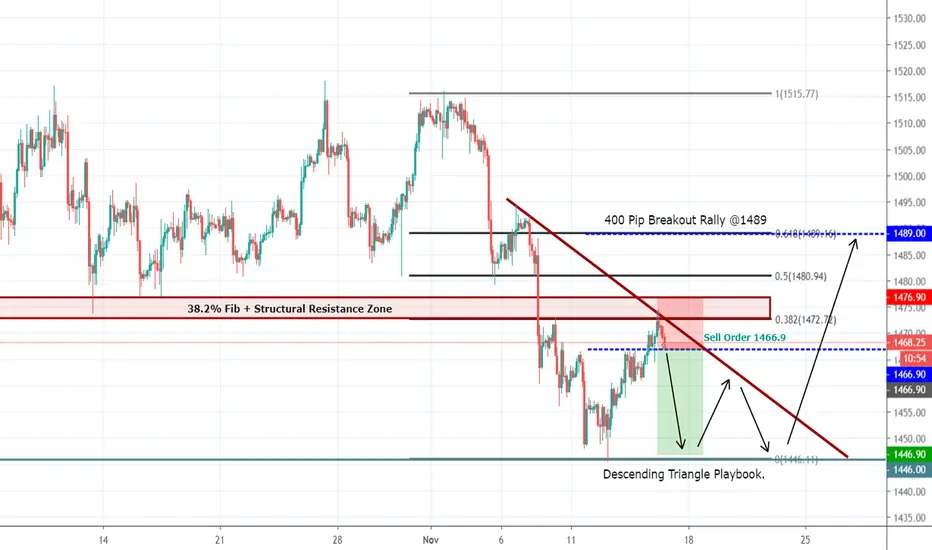
XAUUSD - Descending Triangle on the 2 hour - PLAYBOOKAfter initially buying at 1448 I took profit 200 pips up now at the 38.2% fib resistance plus our price structure resistance.
I now see a Descending Triangle in play - go to babypips.com website to learn about it....
I have a sell order at the previous lows in anticipation for a double bottom ... if i see support again at 1446 i will buy again and await the breakout of the triangle
A breakout above would offer 400 pip movement to 1489 as part of the descending triangle playbook. If we can reach 1489 - 1500 may be on the horizon.
Bitcoin - Descending Triangle - Bulls ReadyBitcoin once again is forming a very strong appearing descending triangle.
This pattern is one of the most frequent and best performing patterns for bitcoin in my opinion.
Once the break either upwards of trend line or downwards of next support line will trigger entry signals.
This information is general and never should be taken as financial advise.
Seek advice from a qualified financial adviser before acting on any investment.

GBP/AUD BUY - 15mStrong support on this pair intraday, looking for another buy opportunity around the support. Short term trade, ahead of AUSTRALIAN data release.
t.me follow for early release signals.
