GER40 Short The trend on this trade has finally started to turn so we can expect the start of the short season
H4, H1, and M15 are overbought
There are 2 clear patterns on H1 and M30
There is a head and shoulders present in M15 with massive divergence
Stoploss above 150 pips
First target at 23300
Technical

USD/JPY(20250620)Today's AnalysisMarket news:
The Bank of England kept interest rates unchanged at 4.25%, and the voting ratio showed that internal differences were increasing. Traders expect the bank to cut interest rates by another 50 basis points this year.
Technical analysis:
Today's buying and selling boundaries:
145.32
Support and resistance levels:
146.35
145.96
145.72
144.93
144.68
144.30
Trading strategy:
If the price breaks through 145.72, consider buying, and the first target price is 145.96
If the price breaks through 145.32, consider selling, and the first target price is 144.93

Potential Gold LongWith Volatile Markets and constant War Developments
XAU/USD has experienced higher than NORMAL volatility.
Given price can RESPECT this short term trendline, we may have a Target of 3,500 in sight.
2 weeks of Bullish Momentum now followed by a beautiful retracement & Strong Wicks below.
SL - 3,355
TP 1 - 3,440
TP 2 - 3,470
TP 3 - 3,496

EURUSD pushing away from 2025 highsAfter creating a new 2025 high last week, MARKETSCOM:EURUSD is now in a slight correction mode. Will the bears take control from here? Let's have a look.
FX_IDC:EURUSD
Let us know what you think in the comments below.
Thank you.
77.3% of retail investor accounts lose money when trading CFDs with this provider. You should consider whether you understand how CFDs work and whether you can afford to take the high risk of losing your money. Past performance is not necessarily indicative of future results. The value of investments may fall as well as rise and the investor may not get back the amount initially invested. This content is not intended for nor applicable to residents of the UK. Cryptocurrency CFDs and spread bets are restricted in the UK for all retail clients.

EURUSD 1H. for 50 pips! :)Hello dear traders, this is EURUSD with Nika.
I want to share you this idea, with buy on limit perspective.
We may see this previous and current pattern are strong in connection.
So that's my opinion, about how we may receive some price movement.
It's good trading idea only in low budget. :)
Thank you!

USD/JPY(20250616)Today's AnalysisMarket news:
Trump: The United States may still intervene in the Iran-Israel conflict. If Iran launches an attack on the United States, the United States will "fight back with all its strength on an unprecedented scale." Iran and Israel should reach an agreement.
Technical analysis:
Today's buying and selling boundaries:
143.79
Support and resistance levels:
145.47
144.84
144.43
143.15
142.74
142.12
Trading strategy:
If the price breaks through 144.43, consider buying in, the first target price is 144.84
If the price breaks through 143.79, consider selling in, the first target price is 143.15

USD/JPY(20250613)Today's AnalysisMarket news:
The number of initial jobless claims in the United States for the week ending June 7 was 248,000, higher than the expected 240,000, the highest since the week of October 5, 2024. The monthly rate of the core PPI in the United States in May was 0.1%, lower than the expected 0.30%. Traders once again fully priced in the Fed's two interest rate cuts this year.
Technical analysis:
Today's buying and selling boundaries:
143.73
Support and resistance levels:
145.09
144.58
144.25
143.21
142.88
142.37
Trading strategy:
If the price breaks through 143.73, consider buying in, the first target price is 144.25
If the price breaks through 143.21, consider selling in, the first target price is 142.88

GBPUSD TECH.Hello everyone.
First of all, in this week, I feel so bearish :D
The market may seem very soon so bearish, if after we will have some downfall very soon...
I hope we will get in some profit situation, if the price will enter this "white break lined colored" channel... Because after that, the price may move many times there in that channel...
So, what we can wait in this situation is when the price will go down and starts making some sideways trend and will get horizontal trend...
Thank you!
Have a Profitable Day! ^^

XAUUSD BULLISH OR BEARISH DETAILED ANALYSISXAUUSD is currently forming a clean bullish pennant pattern on the daily timeframe, signaling a potential continuation of the dominant uptrend. After a strong impulsive rally that pushed gold prices to new highs, the market entered into a consolidation phase, tightening within the pennant structure. This type of price action typically precedes a breakout, and with current price action hovering near the upper boundary of the pennant, a bullish breakout looks imminent. If we break above this consolidation zone, the next target stands at 3500, in line with the measured move projection from the prior leg.
From a fundamental standpoint, gold remains in strong demand amid ongoing macroeconomic uncertainties and shifting central bank policies. Recent data out of the US showed signs of a cooling labor market and slowing inflation pressures, increasing the odds of the Federal Reserve leaning toward rate cuts in the second half of 2025. A dovish Fed would weaken the US dollar and lower Treasury yields—two key drivers that historically push gold prices higher. Additionally, continued central bank gold buying globally, especially from emerging markets, is providing a strong underlying bid for XAU.
The current consolidation is healthy and is allowing the market to build momentum before another leg up. Volatility is compressing, volume remains steady, and price structure is respecting key trendlines. Once we get confirmation with a breakout and close above the upper pennant boundary, it would open the door to a swift move toward the 3500 region. Traders should monitor volume and RSI closely for early signs of breakout confirmation.
In this environment of economic uncertainty, demand for safe-haven assets like gold is only increasing. With technicals and fundamentals aligned, XAUUSD is gearing up for a powerful bullish wave. As long as we hold above the key 3280–3300 support range, the bullish thesis remains fully intact. This setup offers excellent reward-to-risk potential and is one of the more compelling opportunities currently on the radar.

Gold Market Analysis: Short-Term Weakness, Long-Term OptimismAfter a significant drop on Friday, gold prices hit a low of **$3316** in the US market, indicating that the current market correction is likely to continue into next week.
### Current Market Dynamics
The short-term outlook for gold appears weaker, with the 4-hour cycle showing a decline and the daily cycle facing upward pressure. Despite this, the overall market remains within a broad trading range, mirroring the patterns observed in May.
The recent fall below the **$3330** support level is a key indicator. This point acted as a pivot between bullish and bearish sentiment, and its breach suggests that the short-term market has entered a period of weakness and volatility. However, the market hasn't fully shifted into a bearish trend. We can expect a continued downward fluctuation, but the extent of this drop should be limited, making a sharp decline unlikely.
### Trading Strategy for the Coming Week
Given these dynamics, a "short-term selling and long-term buying" strategy is recommended.
* **Short-term operations** may involve selling, but this should be approached cautiously.
* From a broader perspective, **buying remains the primary strategy**.
Looking ahead to next week, we anticipate the market will fluctuate and find a bottom around **$3300**. Once this support level stabilizes, a new upward trend is expected to begin.
**Key price levels to watch:**
* **Short-term resistance:** $3340
* **Lower support:** $3300
Flexibility in your trading arrangements will be crucial to capitalize on upcoming market opportunities.

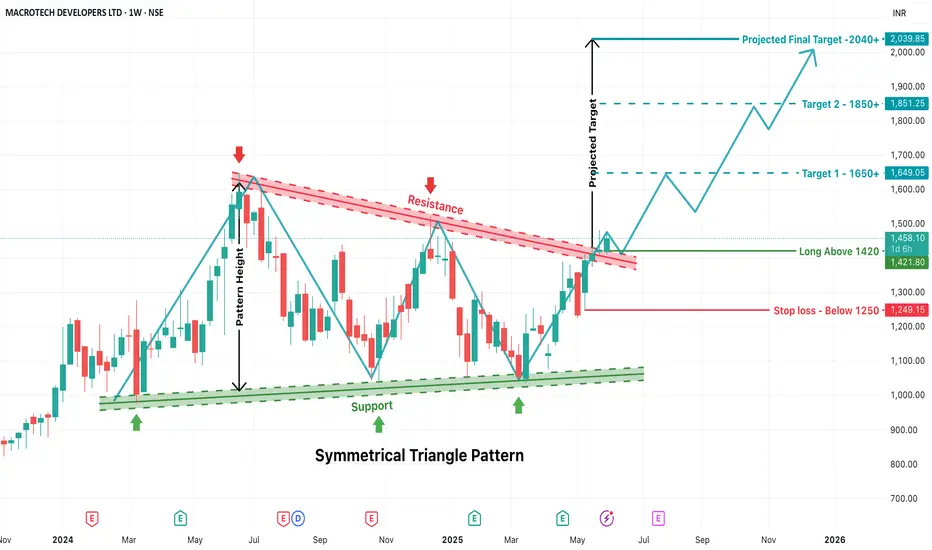
LODHA - Symmetrical Triangle Breakout Trade SetupAbout Pattern:
A Symmetrical Triangle Pattern is a continuation chart pattern formed when price action creates lower highs and higher lows, converging toward a point. It reflects indecision and compression in price before a breakout occurs. The breakout can be on either side, but here, a bullish breakout has occurred.
Support Line: Formed by connecting the swing lows (green arrows), which are gradually increasing.
Resistance Line: Formed by connecting the swing highs (red arrows), which are gradually decreasing.
This convergence of support and resistance forms the triangle.
Breakout Confirmation
Breakout Level: ₹1420
The stock has clearly broken out above the resistance trendline, indicating a strong bullish signal on the weekly timeframe.
Entry and Stop Loss Strategy
Entry Point: Enter the trade only above ₹1420 after confirmation of breakout. This acts as a psychological and technical barrier.
Stop Loss (SL): Set below ₹1250, which is well below the previous swing lows and triangle support. This acts as a safety net in case of a false breakout or reversal.
Target Calculation – Based on Pattern Height
Pattern Height:
Calculated from the highest swing high inside the triangle to the lowest swing low.
This vertical distance is then added to the breakout point (₹1420) to estimate the price targets.
Target 1: ₹1650+
This is the first resistance zone post-breakout and a psychologically important round number.
Target 2: ₹1850+
Based on the full extension of the pattern height and intermediate resistance zone.
Final Projected Target: ₹2040+
This is the complete projection of the triangle pattern height.
This setup is suitable for:
Swing traders looking for positional opportunities
Investors seeking breakout confirmation for fresh entries
Trend followers waiting for consolidation breakouts
Once price sustains above ₹1420, the stock is expected to follow a bullish trajectory toward ₹1650–2040+ over the coming weeks/months.
This Trendline Refuses To Be OverlookedTrading Fam,
While it is somewhat unclear what Bitcoin's next move will be (though I tend to lean towards more upside bias), one thing has become clear ...that aqua blue trendline I have drawn on our chart is proving its significance. Currently, it holds as support. A break to the downside though, and I expect us to drop all the way to 96k. If it continues to hold, a break above our recent high should be expected and new highs will be formed in a relatively quick timeframe.
Stew

GBPUSD BULLISH OR BEARISH DETAILED ANALYSIS ??GBPUSD has successfully completed its retest of the 1.34300–1.34500 support zone and is now showing strong signs of resuming its bullish momentum. The recent structure confirms a classic bullish continuation pattern, as price bounced cleanly off a critical support level that previously acted as resistance. This level has now flipped into a solid demand zone, giving buyers confidence to push toward the 1.40000 psychological target. Price action continues to respect the uptrend with higher lows forming since mid-April, suggesting strength and institutional accumulation.
From a macroeconomic perspective, the British pound remains fundamentally supported. Recent UK inflation data surprised to the upside, causing the market to delay rate cut expectations from the Bank of England. In contrast, the US dollar is weakening due to rising expectations that the Federal Reserve could initiate rate cuts later this year as inflation cools and labor market data softens. This divergence in policy outlooks between the BoE and the Fed is fueling bullish pressure on GBPUSD, making the 1.40000 level a realistic and high-probability target.
Technical confluence also supports this bullish wave. Fibonacci retracement levels drawn from the recent swing low to the high align closely with the support zone at 1.34300, which acted as a perfect retest before the next leg higher. Additionally, the bullish engulfing candles and consistent daily closes above the support level add further confirmation to the upside bias. As long as the pair holds above 1.34300, the structure favors bulls with strong momentum to test and potentially break the 1.38000 intermediate level on the way to 1.40000.
GBPUSD remains a high-confidence bullish opportunity, aligning both technically and fundamentally. The recent breakout and retest phase is complete, and the pair now appears poised for a sustained rally. With bullish market sentiment, favorable UK data, and USD softness across the board, this setup offers an excellent risk-to-reward ratio for medium-term swing traders targeting the 1.40000 zone.

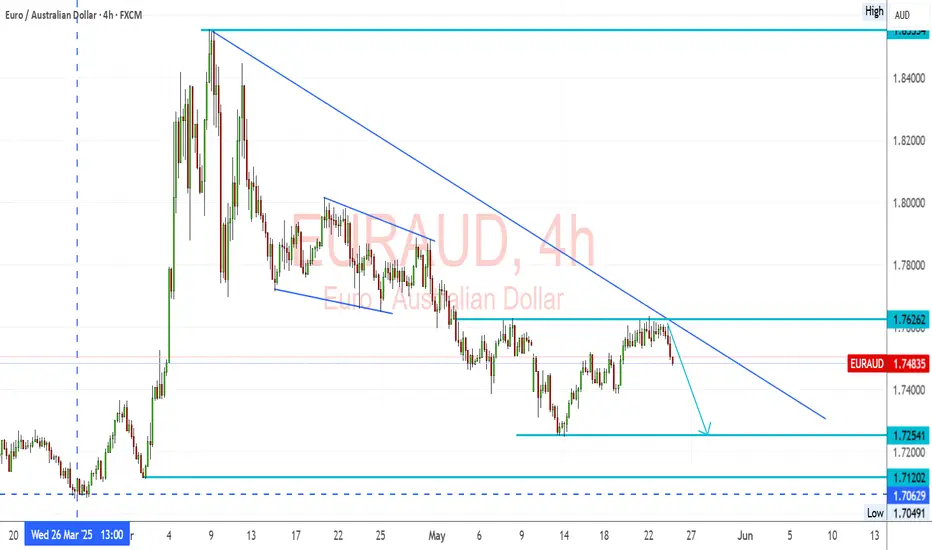
EURAUD – Trendline Holds, Bearish Setup Below 1.7626EURAUD Trend: EURAUD pair remains in a strong downtrend, marked by consistent lower highs and a descending trendline.
Resistance: 1.7626 has been retested and rejected, confirming it as a short-term ceiling.
Structure: The latest rejection from both horizontal resistance and the trendline confirms bearish intent.
🔽 Bearish Targets:
1.7254 – minor support and near-term target
1.7120 – stronger support zone
1.7060 – previous low and potential extended target
A clear break below 1.7400 could confirm continuation of the trend toward those levels.
Fundamental Overview:
🔻 EUR Weakness:
The Eurozone is slowing, particularly in Germany and France.
ECB remains cautious; recent comments show concern about tight financial conditions and sticky inflation.
Political uncertainties and mixed data prints are adding pressure.
🟢 AUD Support:
The RBA remains firm with hawkish language, holding rates while global peers lean dovish.
Commodities remain stable, and Australia benefits from demand out of Asia.
Domestic data (jobs and retail) shows surprising resilience.
Summary:
Bias: Bearish below 1.7626
Break Trigger: 1.7400
Target Range: 1.7250 – 1.7060
Fundamentals: Favor AUD on stronger economic footing and RBA policy tone
📉 EURAUD looks ready for another leg lower unless we see a breakout above 1.7630 with conviction.
XAUUSD - A few pips to the downsideBased on structure and pattern formations, likely to short this trade to the downside before expecting some considerable movement to the upside.

EURUSD BULLISH OR BEARISH DETAILED ANALYSISEURUSD has followed our expectations beautifully, bouncing strongly off a key support zone near 1.1270. This zone was previously a tough resistance which the pair broke through, and it’s now acting as a strong demand area. The latest bullish engulfing candle from this region signals solid buying pressure, confirming that bulls are stepping in to protect this structure. I’m now targeting a move toward the 1.17 level, which aligns with the previous high and the next major resistance on the chart.
From a macro perspective, the euro is showing resilience amid recent ECB policy comments, where officials have adopted a cautious but steady tone. Inflation remains persistent enough to delay aggressive rate cuts, keeping EUR demand intact. Meanwhile, the dollar is seeing renewed selling interest as market expectations shift toward a Fed pause, especially after softer US economic indicators including retail sales and jobless claims. This divergence is likely to support further upside in EURUSD.
Technically, this is a classic textbook retest of broken resistance turned support, backed by momentum indicators such as RSI now bouncing from mid-range and MACD showing signs of a potential bullish crossover. Volume has spiked at the support zone, confirming institutional participation. As long as EURUSD holds above 1.1270, I remain bullish and see this move extending toward 1.17 over the coming sessions.
This setup presents a strong risk-to-reward opportunity with momentum aligning with structure. The breakout and retest scenario is fully intact, and fundamentals are now favoring a continuation to the upside. Traders and swing holders should keep this on their radar as EURUSD looks ready to climb further.

GBPUSD needs a catalyst. Could UK inflation be that?For now, FX_IDC:GBPUSD is struggling to overcome a key resistance barrier, at around 1.3440. Could the UK inflation numbers help move the pair?
Let's dig in...
MARKETSCOM:GBPUSD
Let us know what you think in the comments below.
Thank you.
77.3% of retail investor accounts lose money when trading CFDs with this provider. You should consider whether you understand how CFDs work and whether you can afford to take the high risk of losing your money. Past performance is not necessarily indicative of future results. The value of investments may fall as well as rise and the investor may not get back the amount initially invested. This content is not intended for nor applicable to residents of the UK. Cryptocurrency CFDs and spread bets are restricted in the UK for all retail clients.

Market next move Bearish Disruption Analysis:
1. Range Weakness and Exhaustion Risk:
The price has been ranging within a tight zone, and repeated tests of the support line near 3,215–3,218 show weakening buyer pressure.
If bulls were strong, we might have already seen a breakout with momentum. Instead, there's sideways choppiness, suggesting indecision or exhaustion.
2. Lower Highs Forming:
Despite a flat support zone, price is forming lower highs, a bearish signal. Sellers are stepping in earlier on each bounce, tightening the range from the top.
3. Volume Depletion:
Volume is gradually dropping during this consolidation. If a breakout happens without a volume surge, it risks becoming a false breakout.
4. Liquidity Sweep Possibility:
Market makers might push price below the support zone (~3,215) to trigger stop-losses and accumulate orders before a potential real breakout. This would trap late buyers who enter early.
5. Bearish Scenario Path:
If price breaks below 3,215 and closes under that on decent volume, expect a move to the next demand zone near 3,200 or lower.
Downside target could be around 3,180–3,190, where the previous demand base formed on May 15.

ETH ANALYSIS📊 #ETH Analysis
✅There is a formation of Falling Wedge Pattern on daily chart and currently trading around its major support zone🧐
Pattern signals potential bullish movement incoming after sustain above the major support zone
👀Current Price: $2380
🚀 Target Price: $2785
⚡️What to do ?
👀Keep an eye on #ETH price action and volume. We can trade according to the chart and make some profits⚡️⚡️
#ETH #Cryptocurrency #TechnicalAnalysis #DYOR

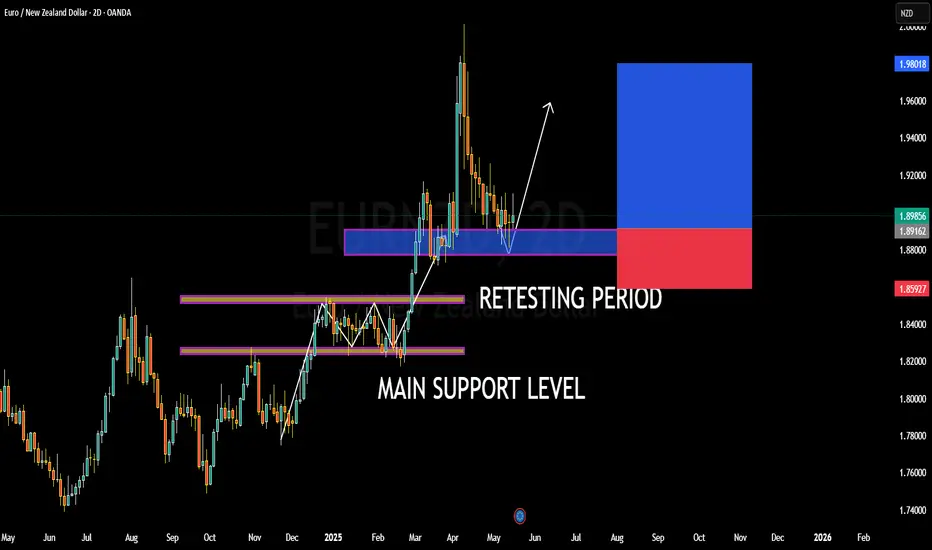
EURNZD BULLISH OR BEARISH DETAILED ANALYSISEURNZD is currently trading around the 1.89 zone after successfully completing a retest of its prior breakout area. This level aligns perfectly with a key historical demand zone, where previous resistance has now flipped into strong support. The market structure remains bullish, and the recent higher-low formation combined with increased volume suggests the pair is gearing up for its next impulsive move to the upside. The price has respected the support zone with precision, signaling institutional interest and a favorable risk-to-reward ratio for long positions.
From a fundamental perspective, the euro remains relatively supported against the New Zealand dollar due to diverging monetary policy expectations. The European Central Bank is maintaining a cautious but slightly hawkish tone amid sticky core inflation, while the Reserve Bank of New Zealand is under pressure to ease policy later this year due to softening economic indicators, including a slowdown in GDP growth and weaker labor market conditions. These macro drivers favor a bullish bias on EURNZD as capital flow leans toward safer, yield-protected assets in the eurozone.
Technically, this setup has clean market geometry. The pair has broken through a multi-month consolidation structure and is now retesting the breakout with confluence from the main support zone at 1.88–1.89. With momentum building and volume increasing on the bounce, the setup is valid for a continuation toward the 1.99 level, especially if the pair reclaims the minor resistance at 1.9050. Breakout traders and position holders should monitor this area closely for confirmation.
Overall, this is a textbook bullish continuation play. The market has absorbed sell pressure at a critical level, and the successful retest confirms the strength of the new support base. With both technical structure and macro fundamentals aligned, this setup offers high potential for trend continuation, and I'm anticipating a strong move toward 1.99 in the coming weeks.
USD/JPY(20250516)Today's AnalysisMarket news:
Fed Chairman Powell: The Fed is adjusting its overall policy-making framework. Zero interest rate is no longer a basic situation. The wording of underemployment and average inflation rate needs to be reconsidered. PCE is expected to drop to 2.2% in April.
Technical analysis:
Today's buying and selling boundaries:
145.93
Support and resistance levels:
147.26
146.77
146.44
145.42
145.10
144.61
Trading strategy:
If the price breaks through 145.93, consider buying, the first target price is 146.44
If the price breaks through 145.42, consider selling, the first target price is 145.10

#NIFTY Intraday Support and Resistance Levels - 16/05/2025Gap up opening expected in nifty near 25200 level. After opening if nifty starts trading above 25300 level then expected strong further upside rally towards the 25500+ level. Any reversal only expected from 25250 level. Downside 25050 level will act as a strong support for today's session.

Is DAX ready for a slight correction lower?We are watching the German XETR:DAX as it is currently struggling to go for a new all-time high. Can this be the moment for a deeper correction lower?
Let's dig in...
MARKETSCOM:GERMANY40
Let us know what you think in the comments below.
Thank you.
77.3% of retail investor accounts lose money when trading CFDs with this provider. You should consider whether you understand how CFDs work and whether you can afford to take the high risk of losing your money. Past performance is not necessarily indicative of future results. The value of investments may fall as well as rise and the investor may not get back the amount initially invested. This content is not intended for nor applicable to residents of the UK. Cryptocurrency CFDs and spread bets are restricted in the UK for all retail clients.
