USD/JPY(20250425)Today's AnalysisMarket news:
Federal Reserve-①Hamack: If economic data is clear, the Fed may cut interest rates in June
②Waller: It will take until July to get a clearer understanding of how tariffs affect the economy. If tariffs lead to higher unemployment, interest rate cuts may be initiated. ③The Atlanta Fed GDPNow model predicts that the US GDP growth rate in the first quarter will be -2.5%. ④Kashkari: The frequent announcements from Washington have brought challenges to policymakers and everyone.
Technical analysis:
Today's buying and selling boundaries:
142.79
Support and resistance levels:
143.94
143.51
143.23
142.34
142.06
141.63
Trading strategy:
If the price breaks through 142.79, consider buying, the first target price is 143.23
If the price breaks through 142.34, consider selling, the first target price is 142.06
Technical

btc . w4 . fancy SHORTthe 'OTF - one time frame' Break of the monthly is still due.
There was no chance for LONGS during the week for retail buyers, only late buyers.
We've traded 2 days just under resistance, accumulating:
- late LONGS
- early SHORTS
I'm willing to SHORT now on friday, once the OTF has been hit.
Scalling in from cwHigh upwards
Invalidation would be to keep pumping and then potentialy SFP on monday for downside.
R:R is alright! I like to give myself a 3% invalidation range till SL.

USDJPY Buy UpdateUSDJPY Buyers stepping in fully...
Analyzing the information from what the yearly candle printed a strong buy is building up at these level

GBPAUD DETAILED ANALYSIS FUNDAMENTALS AND TECHNICALSGBPAUD is currently showing strong bullish momentum after a clean bounce from a key support level around 2.0600–2.0700. The pair has formed a textbook bullish flag pattern on the 12H chart, indicating a potential continuation of the prevailing uptrend. Price action is respecting the trend structure well, and a breakout above the descending flag resistance could open the doors toward the next major resistance around 2.20. I'm currently watching the 2.0870–2.0900 zone closely, as a sustained close above this level may trigger a high-probability upside continuation.
From a technical standpoint, this consolidation within the bullish flag is healthy after a strong impulsive move that started in late March. Volume is gradually decreasing within the flag, which often precedes a breakout. The risk-reward setup here is compelling, with a clear invalidation below 2.0450 and a defined target at 2.2000, aligning perfectly with the recent highs and psychological round number.
On the fundamental side, GBP remains well-supported due to the Bank of England’s hawkish tone. Sticky inflation data in the UK is pushing market expectations for further tightening or at least a delay in rate cuts. Meanwhile, AUD continues to lag behind amid concerns over China’s economic recovery and the Reserve Bank of Australia's cautious policy stance. Recent Australian CPI data showed signs of easing inflation, which strengthens the divergence between BOE and RBA, favoring more upside in GBPAUD.
This setup is ideal for swing traders and position traders looking to capture a trend continuation with a clear structure and clean price action. GBPAUD is now on breakout watch and remains one of the top-performing GBP pairs in April. If momentum aligns post-breakout, the 2.20 target could be reached swiftly. Keep this pair on your radar—momentum, structure, and fundamentals are in sync for a bullish scenario.

USD/JPY(20250424)Today's AnalysisMarket News:
The United States hit a 16-month low in April. The total number of new home sales in the United States in March was an annualized to a new high since September 2024.
Technical analysis:
Today's buying and selling boundaries:
142.82
Support and resistance levels:
144.93
144.14
143.63
142.01
141.50
140.71
Trading strategy:
If the price breaks through 143.63, consider buying, the first target price is 144.14
If the price breaks through 142.82, consider selling, the first target price is 142.01

USDJPY BULLISH OR BEARISH DETAILED ANALYSISUSDJPY has just completed a clean breakout above a well-defined descending channel on the 4H chart, signaling the beginning of a short-term bullish wave. This move reflects a technical shift in sentiment as buyers reclaim control after weeks of selling pressure. The breakout candle closed above the upper trendline, indicating a strong potential for continuation. The target zone appears to align with the previous resistance zone around 147.68, where price reacted multiple times in the past, creating a well-defined liquidity area.
From a fundamental standpoint, the dollar is regaining traction following a stabilization in U.S. Treasury yields and a slight pullback in geopolitical tensions. Market participants are also pricing in a slightly more hawkish Fed tone, as inflation remains persistent and jobless claims continue to show strength. Meanwhile, the Bank of Japan remains firmly dovish, with no indication of tightening policy anytime soon, reinforcing yen weakness and supporting the upside momentum in USDJPY.
This current price action is not just technical—it is aligned with macro drivers. The divergence in monetary policy stance between the Federal Reserve and the Bank of Japan continues to be a key bullish factor for USDJPY. As long as U.S. inflation remains sticky and Fed officials lean toward holding or even hiking rates, this pair is likely to stay supported on dips. Add to that Japan’s fragile domestic consumption outlook and persistent intervention threats, and USDJPY may find itself grinding higher toward resistance zones.
In conclusion, with the channel breakout confirmed and fundamentals favoring a bullish bias, I’m eyeing upside continuation toward 147.68. A tight stop below 140.20 makes the setup attractive in terms of risk-reward. I'll be watching price reaction at interim levels, but the structure is clean and the setup has strong confluence—perfect for capturing this short-term wave.

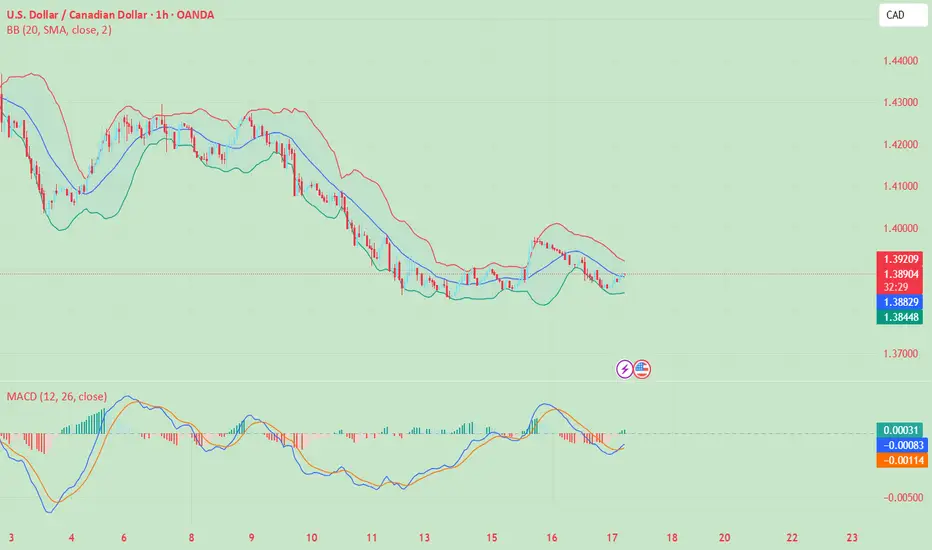
USDCHF BULLISH OR BEARISH DETAILED ANALYSISWe are currently observing the USD/CHF pair, which is trading around 0.8225 as of April 23, 2025. The pair has recently experienced a slight uptick, driven by renewed demand for the US dollar following President Trump's decision to retract threats against Federal Reserve Chair Jerome Powell. This move has alleviated investor concerns regarding the Fed's independence, providing a temporary boost to the greenback.
Despite this short-term rally, the overall outlook for USD/CHF remains bearish. The pair is trading below the critical 100-day Exponential Moving Average (EMA), and the Relative Strength Index (RSI) is hovering near 36, indicating continued selling pressure. The immediate resistance level is identified at 0.8360, while the first support level to monitor is at 0.8121.
Fundamentally, the Swiss franc has appreciated significantly, surging approximately 9% against the US dollar in April alone. This appreciation is attributed to global uncertainties stemming from shifting US trade policies, which have increased demand for safe-haven assets like the franc. The Swiss National Bank (SNB) is under pressure to address this rapid rise, as it poses risks to their inflation targets and the competitiveness of Swiss exports.
In conclusion, while there may be short-term fluctuations influenced by geopolitical developments and central bank communications, the prevailing trend for USD/CHF appears bearish. Traders should remain cautious and monitor key support and resistance levels, as well as fundamental factors that could impact the pair's trajectory.

GOLD (XAU/USD) Breakout Watch –Bullish Continuation or Pullback?🔍 Instrument Analysis: XAU/USD (Gold vs USD)
Timeframe: Likely 1H or 4H (based on candle structure)
Indicators:
EMA 50 (Red) – Current value: 3,365.25
EMA 200 (Blue) – Current value: 3,248.04
📈 Current Market Structure
Price: Trading at 3,433.62, in a strong uptrend with higher highs and higher lows.
Trend: Bullish, supported by price trading above both the 50 EMA and 200 EMA.
Key Zones:
Immediate Resistance: ~3,430 - 3,440 zone (currently being tested).
First Support Zone: ~3,315 - 3,330
Second Support Zone: ~3,250 - 3,270
🧠 Scenario Analysis
✅ Bullish Scenario (Primary Bias)
Price is attempting a break and retest of the resistance zone.
If a successful retest confirms it as support, next upside leg could target 3,480+.
Bullish continuation is favored as long as price holds above 3,385 (recent breakout level).
⚠️ Bearish Scenario (Secondary Bias)
If price fails to hold above 3,385, we may see a pullback to:
3,315 - 3,330 support area (reaction likely due to proximity to EMA 50).
A deeper retracement toward the 3,250 zone, aligned with EMA 200, which would be a critical level for bullish continuation or breakdown.
📊 EMA Insight
EMA 50 > EMA 200: Confirms bullish momentum.
The slope of both EMAs is upward, reinforcing current upward trend.
A test of the EMA 50 may offer a buy opportunity if structure holds.
🔔 Trade Outlook
Bullish bias remains intact above 3,385.
Look for bullish price action confirmation (bullish engulfing, pin bars, etc.) on retest of resistance-turned-support.
Monitor volume/activity around 3,385-3,400 for potential rejection or continuation clues.

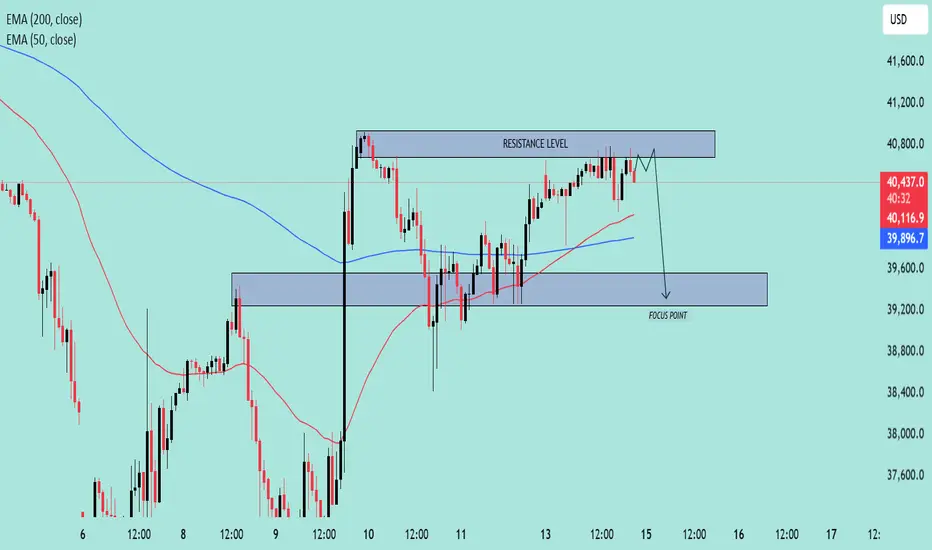
US30 Approaching Key Resistance–Potential Reversal Setup in Play🧠 Chart Overview
Asset: US30 (likely the Dow Jones Industrial Average)
Timeframe: Appears to be 1H or 2H
Indicators:
EMA 50 (Red): 40,119.5
EMA 200 (Blue): 39,897.3
Price at time of chart: Around 40,503
🔍 Key Technical Levels
🔴 Resistance Zone
Range: ~40,750 to 40,850
Price has tested this level multiple times and is currently hovering near it.
The resistance is holding, and no strong breakout has occurred.
🟦 Support / Focus Zone
Range: ~39,200 to 39,600
Marked as the “FOCUS POINT” – likely the expected target on a breakdown.
EMAs Insight:
Price is above both the 50 EMA and 200 EMA, suggesting short-term bullishness.
However, since it’s stalling at resistance, it could flip bearish on rejection.
🧭 Price Action Narrative
The chart suggests a potential fakeout above resistance, followed by a sharp rejection.
The path drawn shows a short-term dip, targeting the FOCUS POINT (support zone).
Rejection at resistance aligns with typical distribution behavior.
📌 Trade Idea (Bearish Bias)
Entry Idea: Short near or just above the resistance level (~40,800)
Target: 39,400 zone
Stop-Loss: Above the resistance level (~40,900+)
Risk/Reward: Favorable if price fails to break above resistance convincingly
📉 Bias: Bearish Reversal
Unless price breaks and closes above resistance with strong momentum, the chart favors a pullback scenario.
Gold (XAU/USD) Bullish Continuation Setup – Key Support Levels 📊 Chart Context & Setup
Chart Type: Candlestick
Indicators Used:
50 EMA (red): Currently at 3,199.009
200 EMA (blue): Currently at 3,123.168
Support Zone: Around 3,157.786 – 3,123.168
Current Price: Approximately 3,211.90
Focus Point (Target Zone): 3,283.810
🧠 Technical Analysis
🔹 Trend Analysis
Overall Trend: Bullish
Price is trading above both the 50 EMA and 200 EMA.
The EMAs are sloping upward, indicating strong momentum.
Golden Cross previously occurred (50 EMA crossing above 200 EMA).
🔹 Key Support & Resistance
Immediate Resistance Zone: Around 3,240
This area is acting as a potential rejection zone, with minor consolidation.
Support Zone (Highlighted): 3,157 – 3,123
This zone was previously a breakout level and now serves as a retest support.
It coincides with the 200 EMA, adding to its strength.
🔁 Scenarios Presented
Scenario A – Bullish Rejection from Immediate Support (3,199)
Price could hold above or near the 50 EMA.
Break and retest of minor resistance could lead to a push toward 3,283.81 (target).
This is a higher-risk entry as the support is not deeply tested yet.
Scenario B – Deeper Pullback to Major Support (3,157 – 3,123)
A drop below current price into the main demand zone.
Bullish engulfing or strong reaction in this zone would offer a high-probability long setup.
Ideal entry point for swing traders, especially if confirmed by volume or bullish candlestick reversal.
🎯 Trade Strategy Suggestion
✅ Long Setup
Entry Option 1: On bullish rejection above 3,199 with confirmation.
Entry Option 2 (Preferred): At strong support zone 3,157 – 3,123 with bullish reversal signal.
Target: 3,283.81
Stop Loss:
For Entry 1: Below 3,157
For Entry 2: Below 3,100 or 200 EMA, depending on aggressiveness
📌 Conclusion
This chart illustrates a classic bullish continuation setup with two potential entry scenarios:
A minor pullback and bounce from the 50 EMA.
A deeper retracement into a strong support zone aligned with the 200 EMA.
The uptrend remains intact as long as the price holds above the 200 EMA and the major demand zone. A break below 3,100 would invalidate the bullish outlook short-term

EURJPY --- bullish or bearish detailed analysis EURJPY is currently offering a high-conviction long opportunity as the pair completes a classic falling wedge breakout pattern on the daily timeframe. Price is now trading around 162.45 and has just broken out of a well-defined descending trendline, validating the bullish momentum shift. With the recent higher low formation and the wedge breakout confirming bullish market structure, the next leg toward the 167.36 zone is on the table, aligning with a clean resistance level and historical price reaction zone.
Fundamentally, the Euro is underpinned by the ECB’s cautious stance on rate cuts, as inflation in the Eurozone remains above the 2% target. Meanwhile, the Japanese Yen continues to weaken amid growing divergence between the Bank of Japan’s ultra-loose monetary policy and other global central banks maintaining relatively tight conditions. BoJ’s reluctance to tighten, combined with consistent intervention threats, hasn’t been enough to halt the Yen’s decline, making EURJPY an attractive long in the current macro backdrop.
Technicals align perfectly here—after a solid rally from the wedge bottom, EURJPY consolidated in a descending channel and has now broken out for a second time, repeating a bullish continuation pattern. The structure remains clean with clear invalidation below 161.26, offering a strong reward-to-risk ratio on continuation toward 167+. The multiple confluences of trendline breakouts, bullish market structure, and macro divergence make this a premium swing setup.
Highly searched keywords like “EURJPY breakout,” “falling wedge pattern,” and “JPY weakness” will drive additional traffic to this idea. With both price action and fundamentals in sync, this trade idea is structured to maximize upside potential while keeping risk controlled. A clean, strategic long setup that reflects disciplined execution and market awareness.

GBPCAD IS BULLISH OR BEARISH DETAILED ANALYSISGBPCAD is currently presenting a high-probability bullish setup after a textbook inverse head and shoulders formation on the 12H chart. Price is now hovering around 1.8457 and has just broken out above the descending trendline acting as neckline resistance. This structural shift, combined with clean bullish price action, signals the potential beginning of a fresh upward leg toward the 1.8976 region, a prior key supply zone and the projected target based on the measured move technique from the pattern.
From a fundamental standpoint, the British Pound is supported by hawkish BoE rhetoric and stronger-than-expected UK inflation data. Sticky core CPI and a robust labor market are keeping interest rate expectations elevated, which strengthens GBP across the board. In contrast, the Canadian Dollar remains under pressure due to softer oil prices and the Bank of Canada's dovish stance as it flirts with rate cuts in upcoming meetings. This macro divergence is fueling the momentum in GBPCAD’s favor, making it a favored pair for swing longs.
Technically, the pair is forming higher lows with increasing volume, which adds confidence to the breakout. The risk is well defined below 1.8198, making this an attractive trade with a solid 1:2+ reward-to-risk profile. As price continues to respect bullish market structure, any pullback toward the neckline could offer a prime re-entry zone for continuation traders.
This setup aligns with highly searched price action strategies such as “inverse head and shoulders breakout,” “neckline retest,” and “GBP strength vs CAD weakness.” With both technical and fundamental confluence pointing in the same direction, GBPCAD is set up for a potentially profitable swing opportunity heading into May.

CHFJPY TECHNICAL AND FUNADEMENTALS DETAILS ANALYSISCHFJPY has just broken out of a long-term descending channel on the daily chart, currently trading near 174.09. This breakout is technically significant, as it marks the end of a prolonged downtrend and suggests the beginning of a potential bullish reversal. The price action shows a clean breakout above the upper channel resistance, followed by a healthy retest—textbook price behavior when momentum shifts to the upside. With this structure flip, we are now positioning for a continuation towards the 182.40 zone, which aligns with a previous key resistance and measured move projection.
This breakout is supported by strong fundamentals. The Swiss Franc remains firm, driven by Switzerland’s resilient economic data and the Swiss National Bank’s cautious monetary stance. Meanwhile, the Japanese Yen continues to struggle as the Bank of Japan maintains its ultra-loose policy, despite recent signs of inflation picking up. The yield differential and risk-on sentiment are weighing heavily on JPY, making it an ideal quote currency for this bullish CHF move. Traders are increasingly favoring CHFJPY in the current macro landscape due to this divergence.
What makes this setup even more attractive is the clean technical structure paired with a favorable risk-reward ratio. The stop below the retest area around 171.63 offers tight risk management, while the upside potential toward 182.40 presents a strong 1:3+ R/R swing opportunity. These types of breakouts—especially after extended consolidation—often lead to trend-following momentum plays that institutions favor.
CHFJPY is now on many watchlists across TradingView due to this breakout from a descending channel, which is a highly searched pattern by technical traders. This pair is poised to deliver a profitable swing trade backed by both technical strength and macro alignment. If momentum continues, we could see a strong bullish leg throughout Q2.

USD/JPY(20250417)Today's AnalysisMarket news:
U.S. import prices fell 0.1% in March from the previous month, the first month-on-month decline since September last year.
Technical analysis:
Today's buying and selling boundaries:
143.10
Support and resistance levels:
144.08
143.72
143.48
142.72
142.48
142.11
Trading strategy:
If the price breaks through 143.10, consider buying, the first target price is 143.48
If the price breaks through 142.72, consider selling, the first target price is 142.48
USD/JPY(20250416)Today's AnalysisMarket news:
U.S. import prices fell 0.1% in March from the previous month, the first month-on-month decline since September last year.
Technical analysis:
Today's buying and selling boundaries:
143.10
Support and resistance levels
144.08
143.72
143.48
142.72
142.48
142.11
Trading strategy:
If the price breaks through 143.10, consider buying, the first target price is 143.48
If the price breaks through 142.72, consider selling, the first target price is 142.48

USD/JPY(20250414)Today's AnalysisMarket news:
Fed Collins: It is currently expected that the Fed will need to keep interest rates unchanged for a longer period of time. If necessary, the Fed is "absolutely" ready to help stabilize the market; Kashkari: No serious chaos has been seen yet, and the Fed should intervene cautiously only in truly urgent situations; Musallem: The Fed should be wary of continued inflation driven by tariffs.
Technical analysis:
Today's buying and selling boundaries:
143.41
Support and resistance levels:
146.00
145.03
144.40
142.41
141.79
140.82
Trading strategy:
If the price breaks through 144.40, consider buying, the first target price is 145.03
If the price breaks through 143.41, consider selling, the first target price is 142.41

DXY NEXT MOVE AND MARKET EFFECTThe US Dollar Index (DXY) is currently testing a major multi-year support zone around the 99.70–100.00 level. This level has held firm multiple times in the past, acting as a strong demand area during key macroeconomic cycles. Right now, price action is showing indecision with a clear do-or-die moment forming. If bulls defend this zone, we could witness a significant bullish reversal, potentially targeting the 103.00–105.00 range. However, a decisive break below this support could trigger a bearish wave toward the 96.00 handle or even lower.
Technically, this zone is not just psychological, but also a structural demand region, aligning with previous swing lows and price pivots. We’re seeing a potential for either a double bottom reversal or a breakdown structure forming, depending on how the market reacts in the coming sessions. Price is extremely oversold on higher timeframes, which could fuel a relief rally if momentum shifts. The reaction here will be key for broader market direction, especially as the dollar plays a pivotal role across forex majors.
Fundamentally, the DXY is under pressure as recent U.S. macro data reveals weakening momentum. March CPI printed hotter than expected, but other indicators like core PCE, NFP softness, and signs of slowing consumer demand are fueling expectations that the Fed may be nearing a policy pivot. At the same time, global risk sentiment is improving and yields have pulled back slightly, putting pressure on the greenback. However, rising geopolitical tensions and elevated oil prices continue to support USD as a safe-haven asset.
As a professional trader, this is a critical level to watch. I’m keeping an eye on price action confirmation for either a bullish engulfing setup or a clean break and retest of the 99.50 level. Both scenarios offer high-probability trades. Patience here is crucial — let the market reveal its hand, then align with the momentum. Dollar volatility is likely to remain elevated heading into next week, so managing risk with clarity is key.

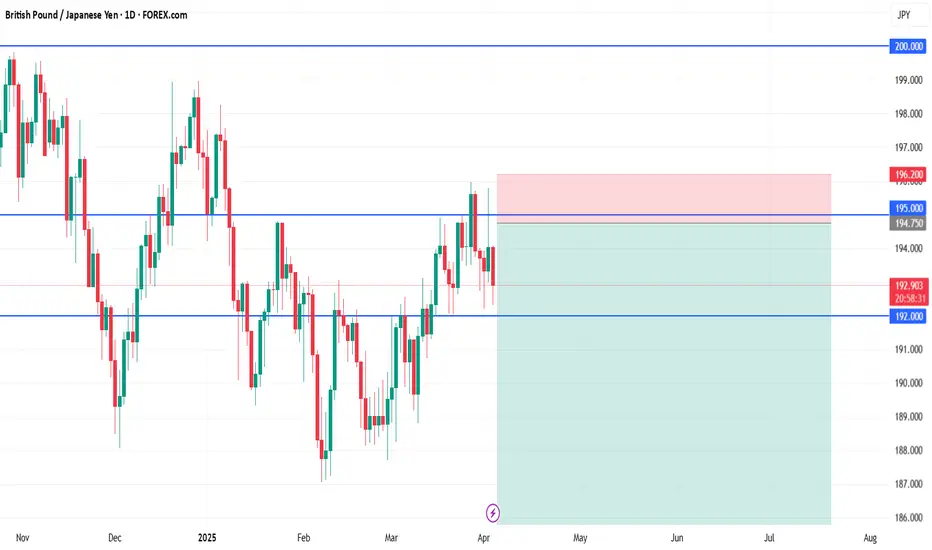
GBP/JPY short🧩 GBP/JPY Swing Short Setup
📍 Entry:
Sell Limit: 194.75
🛡️ Stop Loss (Above Resistance Wick):
SL: 196.20
→ Covers minor breakout/fakeout above 195 zone while protecting against invalidation
🎯 Take Profits:
TP1: 190.00
(Structure floor + first major reaction zone)
TP2: 185.00
(Clean horizontal support and demand zone)
TP3 (Swing Target): 180.00
(Large macro target — monthly structure retest)
🧠 Rationale Recap:
Price is consolidating just under multi-year resistance (195–200)
Fundamentals align: GBP weakening, JPY strengthening in risk-off environment
Strong R:R, clean rejection zone, and macro pressure potential
USD/JPY(20250411)Today's AnalysisMarket news:
The annual rate of the US CPI in March was 2.4%, a six-month low, lower than the market expectation of 2.6%. The market almost fully priced in the Fed's interest rate cut in June. Trump said inflation has fallen.
Technical analysis:
Today's long-short boundary:
145.38
Support and resistance levels:
149.05
147.68
146.79
143.97
143.08
141.71
Trading strategy:
If the price breaks through 145.38, consider buying, the first target price is 146.79
If the price breaks through 143.97, consider selling, the first target price is 143.08

CADJPY WILL BULLISH OR BEARISH ?? DETAILED ANALYSISCADJPY is currently forming a clear descending wedge pattern on the 12H chart, which historically signals a high-probability bullish reversal. The price has respected both the upper descending trendline and the lower support line with precision over the past few months, but the recent reaction near the wedge support is showing signs of buying interest. With the current price trading at 103.10, we are at a critical juncture where a breakout to the upside could initiate a strong momentum rally toward the 109.00 target.
Technically, this setup is supported by multiple touchpoints on both trendlines, suggesting a mature wedge structure ready to break. The risk-reward ratio is extremely favorable here, with clear invalidation below 100.90 and upside potential aligned with the upper structure of the broader consolidation zone. A confirmed breakout and candle close above the 104.00 resistance area would likely signal the start of a bullish impulse wave targeting 109.00 in the medium term.
On the fundamental side, CAD is supported by firm oil prices, which have remained elevated due to ongoing geopolitical risks and OPEC+ production cuts. Meanwhile, the JPY continues to weaken as the Bank of Japan remains firmly committed to ultra-loose monetary policy, even as inflation expectations globally stay elevated. This divergence in monetary policy between the BoC and BoJ is fueling carry trade flows, further boosting CADJPY's bullish outlook.
Looking ahead, any signs of risk-on sentiment in global markets, combined with resilient Canadian data, could act as a catalyst for the breakout. With the market positioning leaning heavily on JPY shorts and crude oil demand remaining strong, CADJPY is technically and fundamentally poised for a breakout rally. I'm watching the 104.00 zone closely—once cleared, I anticipate a swift move toward 109.00 with momentum on our side.

USD/JPY(20250410)Today's AnalysisToday's buying and selling boundaries:
146.66
Support and resistance levels:
150.90
149.32
148.29
145.03
144.01
142.42
Trading strategy:
If the price breaks through 148.29, consider buying, the first target price is 149.32
If the price breaks through 146.66, consider selling, the first target price is 145.03

WHY CADJPY IS BULLISH ?? DETAILED ANALYSIS CAD/JPY is currently trading around 104.200, forming a falling wedge pattern—a technical indicator often suggestive of a potential bullish reversal. Traders are closely monitoring this setup for a breakout, which could potentially propel the pair toward the target price of 107.000, indicating a prospective gain of approximately 300 pips.
Fundamentally, the Canadian dollar's performance is closely tied to global oil prices, given Canada's status as a major oil exporter. Recent stability in oil markets has provided underlying support to the loonie. Conversely, the Japanese yen, traditionally viewed as a safe-haven currency, has experienced fluctuations influenced by shifts in global risk sentiment and the Bank of Japan's monetary policy stance. The divergence in economic indicators and central bank policies between Canada and Japan may contribute to the anticipated bullish momentum in the CAD/JPY pair.
Technical analysis reinforces this outlook. The falling wedge pattern observed on the charts is characterized by converging trendlines sloping downward, indicating diminishing bearish momentum. A decisive breakout above the upper trendline of the wedge, accompanied by increased trading volume, would serve as a confirmation of the bullish reversal. Key resistance levels to monitor include 105.000 and 106.000, with a sustained move above these thresholds enhancing the likelihood of reaching the 107.000 target.
Traders should exercise prudent risk management strategies, such as setting appropriate stop-loss orders, to mitigate potential market volatility. Additionally, staying informed about upcoming economic data releases and central bank communications from both Canada and Japan will be crucial in navigating this trade effectively. By aligning technical insights with fundamental developments, traders can position themselves to capitalize on the potential bullish breakout in the CAD/JPY pair.

USD/JPY(20250408)Today's AnalysisToday's buying and selling boundaries:
146.92
Support and resistance levels
150.22
148.99
148.18
145.65
144.85
143.61
Trading strategy:
If the price breaks through 148.18, consider buying, the first target price is 148.99
If the price breaks through 146.92, consider selling, the first target price is 145.65
