BLZ │ SHORT │ 06.11.2023BINANCE:BLZUSDT.P
Comment
Throughout the day yesterday, the instrument experienced a significant upward pull, but towards the end of the day, it was once again pulled down. This was followed by consolidation right before a key level, and it looked quite promising. We didn't observe the expected reaction to a sharp decline, which usually triggers a correction. On the contrary, what we can see is a clearly defined presence of sellers, as the price almost touched the level twice, and it seems like there is no one actively defending this level. Instead, the price gradually moves lower within a local consolidation, indicating that sellers are gaining the upper hand.
Signals for level breakout
bar/candles closure near the level;
close retest of the level;
accumulation of energy for level breakout;
consolidation near the level;
there is no reaction to a strong instrument movement;
the instrument is not allowed to increase in price;
there is a reserve of calculated ATR;
Order parameters (risk-to-reward ratio = 1 to 3/4/5)
Open : 0.2735526;
Stop loss : 0.2761894;
Take profit :0.2656422 / 0.2630054 / 0.2603686;
Disclaimer
Every trader should make their trading decisions based on their own analysis and circumstances. The signals in this channel should be considered as an additional tool for your own consideration.
Follow me and receive high-quality cryptocurrency market analysis!
Technical_analysis

QI/USDT - BENQI: Failure_Swing◳◱ We've detected a Failure Swing pattern on the $QI / CRYPTOCAP:USDT chart. This pattern is a bullish indication and could indicate a potential trend reversal. The next resistance key levels are at 0.00556 | 0.00594 | 0.00666 and the major support zones are respectively at 0.00484 | 0.0045 | 0.00378. It is a bullish indication and we may consider buying at the current price zone of 0.0055 and targetting higher levels.
◰◲ General info :
▣ Name: BENQI
▣ Rank: 604
▣ Exchanges: Binance, Kucoin, Mexc, Hitbtc
▣ Category/Sector: Financial - Lending
▣ Overview: BENQI was launched on August 19, 2021, on the Avalanche C-Chain, and as the first recipient of the Avalanche Rush Initiative, received $3 million to be allocated as liquidity incentives for the users. The project is led by Dan Mgbor, who has over seven years of experience in project management, as well as various consultancy roles. BENQI is a Liquidity Market Protocol focused on approachability, ease of use, and low fees.
◰◲ Technical Metrics :
▣ Mrkt Price: 0.0055 ₮
▣ 24HVol: 4,574,476.852 ₮
▣ 24H Chng: -1.961%
▣ 7-Days Chng: 8.59%
▣ 1-Month Chng: 6.61%
▣ 3-Months Chng: -12.80%
◲◰ Pivot Points - Levels :
◥ Resistance: 0.00556 | 0.00594 | 0.00666
◢ Support: 0.00484 | 0.0045 | 0.00378
◱◳ Indicators recommendation :
▣ Oscillators: NEUTRAL
▣ Moving Averages: BUY
◰◲ Technical Indicators Summary : NEUTRAL
◲◰ Sharpe Ratios :
▣ Last 30D: -22.15
▣ Last 90D: -21.87
▣ Last 1-Y: -16.11
▣ Last 3-Y: -16.86
◲◰ Volatility :
▣ Last 30D: 0.32
▣ Last 90D: 0.34
▣ Last 1-Y: 0.73
▣ Last 3-Y: 1.06
◳◰ Market Sentiment Index :
▣ News sentiment score is N/A
▣ Twitter sentiment score is N/A
▣ Reddit sentiment score is 0.77 - V. Bullish
▣ In-depth QIUSDT technical analysis on Tradingview TA page
▣ What do you think of this analysis? Share your insights and let's discuss in the comments below. Your like, follow and support would be greatly appreciated!
◲ Disclaimer
Please note that the information and publications provided are for informational purposes only and should not be construed as financial, investment, trading, or any other type of advice or recommendation. We encourage you to conduct your own research and consult with a qualified professional before making any financial decisions. The use of the information provided is solely at your own risk.
▣ Welcome to the home of charting big: TradingView
Benefit from a ton of financial analysis features, instruments and data. Have a look around, and if you do choose to go with an upgraded plan, you'll get up to $30.
Discover it here - affiliate link -

LTC/BTC - Litecoin: Super Trend◳◱ On the $LTC/ CRYPTOCAP:BTC chart, the Super Trend pattern suggests a pause in volatility, potentially gearing up for a breakout. Traders might observe resistance around 0.002132 | 0.00227 | 0.002497 and support near 0.001905 | 0.001816 | 0.001589. Entering trades at 0.002031 could be strategic, aiming for the next resistance level.
◰◲ General info :
▣ Name: Litecoin
▣ Rank: 18
▣ Exchanges: Binance, Kucoin, Huobipro, Gateio, Mexc, Bittrex
▣ Category/Sector: Payments - Currencies
▣ Overview: Litecoin is a fork of Bitcoin's codebase with four times faster block times and a four times larger supply. The project considers itself complementary to Bitcoin as a silver to Bitcoin's gold. It is often used as a pseduo-testnet for Bitcoin, adopting new protocol changes before they are deployed on Bitcoin.
◰◲ Technical Metrics :
▣ Mrkt Price: 0.002031 ₿
▣ 24HVol: 110.878 ₿
▣ 24H Chng: 2.421%
▣ 7-Days Chng: 3.66%
▣ 1-Month Chng: 8.87%
▣ 3-Months Chng: -13.40%
◲◰ Pivot Points - Levels :
◥ Resistance: 0.002132 | 0.00227 | 0.002497
◢ Support: 0.001905 | 0.001816 | 0.001589
◱◳ Indicators recommendation :
▣ Oscillators: NEUTRAL
▣ Moving Averages: BUY
◰◲ Technical Indicators Summary : BUY
◲◰ Sharpe Ratios :
▣ Last 30D: 3.44
▣ Last 90D: -0.90
▣ Last 1-Y: 0.44
▣ Last 3-Y: 0.58
◲◰ Volatility :
▣ Last 30D: 0.36
▣ Last 90D: 0.49
▣ Last 1-Y: 0.74
▣ Last 3-Y: 0.97
◳◰ Market Sentiment Index :
▣ News sentiment score is N/A
▣ Twitter sentiment score is 0.52 - Bullish
▣ Reddit sentiment score is 0.57 - Bullish
▣ In-depth LTCBTC technical analysis on Tradingview TA page
▣ What do you think of this analysis? Share your insights and let's discuss in the comments below. Your like, follow and support would be greatly appreciated!
◲ Disclaimer
Please note that the information and publications provided are for informational purposes only and should not be construed as financial, investment, trading, or any other type of advice or recommendation. We encourage you to conduct your own research and consult with a qualified professional before making any financial decisions. The use of the information provided is solely at your own risk.
▣ Welcome to the home of charting big: TradingView
Benefit from a ton of financial analysis features, instruments and data. Have a look around, and if you do choose to go with an upgraded plan, you'll get up to $30.
Discover it here - affiliate link -

IOTA/USDT - IOTA: Trend_Reversal◳◱ An intriguing development has unfolded on the FWB:IOTA / CRYPTOCAP:USDT chart as we've identified a compelling Trend Reversal. This shift in price dynamics indicates a noteworthy potential trend change. It's crucial for us to pay attention to the next resistance levels located at 0.1677 | 0.1837 | 0.2145 and the significant support levels found at 0.1369 | 0.1221 | 0.0913. Taking these factors into consideration, it may be prudent to contemplate entering a buy position at the current price of 0.159, allowing us to take advantage of the projected trend continuation.
Let's keep a watchful eye on this exciting opportunity and stay proactive in our trading strategies.
◰◲ General info :
▣ Name: IOTA
▣ Rank: 89
▣ Exchanges: Binance, Kucoin, Bybit, Huobipro, Gateio, Bittrex
▣ Category/Sector: Services - IoT
▣ Overview: IOTA is transaction settlement and data transfer layer for the Internet of Things (IoT). It's distributed ledger, the Tangle, is based on a data structure referred to as a Directed Acyclic Graph (DAG). In the Tangle there are no blocks or miners, and every transaction on the Iota network must validate two previous transactions through a small proof-of-work (PoW). Thus the more transactions occur, the faster the network can process new transactions, theoretically allowing the network to become more efficient as it scales.
◰◲ Technical Metrics :
▣ Mrkt Price: 0.159 ₮
▣ 24HVol: 1,827,655.453 ₮
▣ 24H Chng: 3.448%
▣ 7-Days Chng: 12.59%
▣ 1-Month Chng: 6.28%
▣ 3-Months Chng: -9.42%
◲◰ Pivot Points - Levels :
◥ Resistance: 0.1677 | 0.1837 | 0.2145
◢ Support: 0.1369 | 0.1221 | 0.0913
◱◳ Indicators recommendation :
▣ Oscillators: SELL
▣ Moving Averages: STRONG_BUY
◰◲ Technical Indicators Summary : BUY
◲◰ Sharpe Ratios :
▣ Last 30D: -23.01
▣ Last 90D: -21.22
▣ Last 1-Y: -18.39
▣ Last 3-Y: -18.23
◲◰ Volatility :
▣ Last 30D: 0.36
▣ Last 90D: 0.41
▣ Last 1-Y: 0.57
▣ Last 3-Y: 0.94
◳◰ Market Sentiment Index :
▣ News sentiment score is N/A
▣ Twitter sentiment score is 0.70 - Bullish
▣ Reddit sentiment score is N/A
▣ In-depth IOTAUSDT technical analysis on Tradingview TA page
▣ What do you think of this analysis? Share your insights and let's discuss in the comments below. Your like, follow and support would be greatly appreciated!
◲ Disclaimer
Please note that the information and publications provided are for informational purposes only and should not be construed as financial, investment, trading, or any other type of advice or recommendation. We encourage you to conduct your own research and consult with a qualified professional before making any financial decisions. The use of the information provided is solely at your own risk.
▣ Welcome to the home of charting big: TradingView
Benefit from a ton of financial analysis features, instruments and data. Have a look around, and if you do choose to go with an upgraded plan, you'll get up to $30.
Discover it here - affiliate link -

XRP/BTC - XRP: Failure Swing◳◱ On the $XRP/ CRYPTOCAP:BTC chart, the Failure Swing pattern suggests indications that the trend may be gaining or losing strength. Traders might observe resistance around 0.00001714 | 0.00001819 | 0.00001993 and support near 0.0000154 | 0.00001471 | 0.00001297. Entering trades at 0.00001858 could be strategic, aiming for the next resistance level.
◰◲ General info :
▣ Name: XRP
▣ Rank: 5
▣ Exchanges: Binance, Kucoin, Huobipro, Gateio, Mexc, Bittrex
▣ Category/Sector: Payments - Currencies
▣ Overview: XRP is a cryptocurrency aiming to increase the speed and reduce the cost of transferring money between financial institutions. Underpinning Ripple's xRapid product, an on-demand liquidity solution, XRP is used as a bridge currency for financial institutions exchanging value between multiple fiat currencies. XRP is the native token of the XRP Ledger, an open-source cryptographic ledger powered by a peer-to-peer network of nodes.
◰◲ Technical Metrics :
▣ Mrkt Price: 0.00001858 ₿
▣ 24HVol: 743.419 ₿
▣ 24H Chng: 5.448%
▣ 7-Days Chng: 17.12%
▣ 1-Month Chng: 23.91%
▣ 3-Months Chng: 4.57%
◲◰ Pivot Points - Levels :
◥ Resistance: 0.00001714 | 0.00001819 | 0.00001993
◢ Support: 0.0000154 | 0.00001471 | 0.00001297
◱◳ Indicators recommendation :
▣ Oscillators: NEUTRAL
▣ Moving Averages: STRONG_BUY
◰◲ Technical Indicators Summary : BUY
◲◰ Sharpe Ratios :
▣ Last 30D: 6.33
▣ Last 90D: 0.63
▣ Last 1-Y: 0.67
▣ Last 3-Y: 0.86
◲◰ Volatility :
▣ Last 30D: 0.42
▣ Last 90D: 0.48
▣ Last 1-Y: 0.99
▣ Last 3-Y: 1.27
◳◰ Market Sentiment Index :
▣ News sentiment score is 0.56 - Bullish
▣ Twitter sentiment score is 0.53 - Bullish
▣ Reddit sentiment score is 0.37 - Bearish
▣ In-depth XRPBTC technical analysis on Tradingview TA page
▣ What do you think of this analysis? Share your insights and let's discuss in the comments below. Your like, follow and support would be greatly appreciated!
◲ Disclaimer
Please note that the information and publications provided are for informational purposes only and should not be construed as financial, investment, trading, or any other type of advice or recommendation. We encourage you to conduct your own research and consult with a qualified professional before making any financial decisions. The use of the information provided is solely at your own risk.
▣ Welcome to the home of charting big: TradingView
Benefit from a ton of financial analysis features, instruments and data. Have a look around, and if you do choose to go with an upgraded plan, you'll get up to $30.
Discover it here - affiliate link -

CFX/USDT - Conflux Network: Trend Reversal◳◱ On the $CFX/ CRYPTOCAP:USDT chart, the Trend Reversal pattern suggests momentum building up for a significant move. Traders might observe resistance around 0.1831 | 0.2104 | 0.2753 and support near 0.1182 | 0.0806 | 0.0157. Entering trades at 0.1662 could be strategic, aiming for the next resistance level.
◰◲ General info :
▣ Name: Conflux Network
▣ Rank: 78
▣ Exchanges: Binance, Kucoin, Bybit, Gateio, Mexc, Hitbtc
▣ Category/Sector: Infrastructure - Smart Contract Platforms
▣ Overview: Conflux Network is a smart contract platform that features a Turing-complete state machine built atop a high-throughput consensus protocol. Conflux reaches an agreement on transaction validator based on the total order of blocks organized in a Tree-Graph, a novel consensus mechanism that scaling benefits relative to existing blockchains. It also uses Proof-of-Work (PoW) to supplement its Tree-Graph consensus protocol. Conflux has a native token called CFX that serves as the reward for network miners and as a means for paying transaction fees.
◰◲ Technical Metrics :
▣ Mrkt Price: 0.1662 ₮
▣ 24HVol: 15,561,996.278 ₮
▣ 24H Chng: 8.203%
▣ 7-Days Chng: 6.76%
▣ 1-Month Chng: 27.71%
▣ 3-Months Chng: -6.14%
◲◰ Pivot Points - Levels :
◥ Resistance: 0.1831 | 0.2104 | 0.2753
◢ Support: 0.1182 | 0.0806 | 0.0157
◱◳ Indicators recommendation :
▣ Oscillators: BUY
▣ Moving Averages: STRONG_BUY
◰◲ Technical Indicators Summary : STRONG_BUY
◲◰ Sharpe Ratios :
▣ Last 30D: 2.55
▣ Last 90D: 0.07
▣ Last 1-Y: 1.55
▣ Last 3-Y: 0.44
◲◰ Volatility :
▣ Last 30D: 1.37
▣ Last 90D: 1.02
▣ Last 1-Y: 1.94
▣ Last 3-Y: 1.85
◳◰ Market Sentiment Index :
▣ News sentiment score is N/A
▣ Twitter sentiment score is N/A
▣ Reddit sentiment score is 0.62 - Bullish
▣ In-depth CFXUSDT technical analysis on Tradingview TA page
▣ What do you think of this analysis? Share your insights and let's discuss in the comments below. Your like, follow and support would be greatly appreciated!
◲ Disclaimer
Please note that the information and publications provided are for informational purposes only and should not be construed as financial, investment, trading, or any other type of advice or recommendation. We encourage you to conduct your own research and consult with a qualified professional before making any financial decisions. The use of the information provided is solely at your own risk.
▣ Welcome to the home of charting big: TradingView
Benefit from a ton of financial analysis features, instruments and data. Have a look around, and if you do choose to go with an upgraded plan, you'll get up to $30.
Discover it here - affiliate link -

AVAX/BTC - Avalanche: Failure Swing◳◱ On the $AVAX/ CRYPTOCAP:BTC chart, the Failure Swing pattern suggests indications that the trend may be gaining or losing strength. Traders might observe resistance around 0.0003463 | 0.0003632 | 0.0004041 and support near 0.0003054 | 0.0002814 | 0.0002405. Entering trades at 0.0003526 could be strategic, aiming for the next resistance level.
◰◲ General info :
▣ Name: Avalanche
▣ Rank: 21
▣ Exchanges: Binance, Kucoin, Huobipro, Bittrex, Hitbtc
▣ Category/Sector: Infrastructure - Smart Contract Platforms
▣ Overview: Avalanche is an open-source platform for launching decentralized finance applications and enterprise blockchain deployments in one interoperable, scalable ecosystem. Developers who build on Avalanche can create applications and custom blockchain networks with complex rulesets or build on existing private or public subnets.
◰◲ Technical Metrics :
▣ Mrkt Price: 0.0003526 ₿
▣ 24HVol: 60.761 ₿
▣ 24H Chng: 1.322%
▣ 7-Days Chng: 9.05%
▣ 1-Month Chng: 16.39%
▣ 3-Months Chng: -0.42%
◲◰ Pivot Points - Levels :
◥ Resistance: 0.0003463 | 0.0003632 | 0.0004041
◢ Support: 0.0003054 | 0.0002814 | 0.0002405
◱◳ Indicators recommendation :
▣ Oscillators: NEUTRAL
▣ Moving Averages: STRONG_BUY
◰◲ Technical Indicators Summary : BUY
◲◰ Sharpe Ratios :
▣ Last 30D: 4.42
▣ Last 90D: 0.28
▣ Last 1-Y: -0.18
▣ Last 3-Y: 0.97
◲◰ Volatility :
▣ Last 30D: 0.62
▣ Last 90D: 0.53
▣ Last 1-Y: 0.78
▣ Last 3-Y: 1.33
◳◰ Market Sentiment Index :
▣ News sentiment score is N/A
▣ Twitter sentiment score is 0.58 - Bullish
▣ Reddit sentiment score is 0.22 - V. Bearish
▣ In-depth AVAXBTC technical analysis on Tradingview TA page
▣ What do you think of this analysis? Share your insights and let's discuss in the comments below. Your like, follow and support would be greatly appreciated!
◲ Disclaimer
Please note that the information and publications provided are for informational purposes only and should not be construed as financial, investment, trading, or any other type of advice or recommendation. We encourage you to conduct your own research and consult with a qualified professional before making any financial decisions. The use of the information provided is solely at your own risk.
▣ Welcome to the home of charting big: TradingView
Benefit from a ton of financial analysis features, instruments and data. Have a look around, and if you do choose to go with an upgraded plan, you'll get up to $30.
Discover it here - affiliate link -

LRC/USDT - Loopring: BBand Breakout◳◱ On the $LRC/ CRYPTOCAP:USDT chart, the Bband Breakout pattern suggests an upcoming trend shift. Traders might observe resistance around 0.2135 | 0.2247 | 0.2569 and support near 0.1813 | 0.1603 | 0.1281. Entering trades at 0.2138 could be strategic, aiming for the next resistance level.
◰◲ General info :
▣ Name: Loopring
▣ Rank: 131
▣ Exchanges: Binance, Kucoin, Bybit, Huobipro, Gateio, Mexc
▣ Category/Sector: Financial - Decentralized Exchanges
▣ Overview: Loopring is an open protocol for building high-performance, order book decentralized exchanges on Ethereum. Their goal is to enable the building of highly scalable exchanges without compromising Ethereum-level security guarantees through a zkRollup construction.
◰◲ Technical Metrics :
▣ Mrkt Price: 0.2138 ₮
▣ 24HVol: 7,669,682.718 ₮
▣ 24H Chng: 6.633%
▣ 7-Days Chng: 13.52%
▣ 1-Month Chng: 21.59%
▣ 3-Months Chng: 0.87%
◲◰ Pivot Points - Levels :
◥ Resistance: 0.2135 | 0.2247 | 0.2569
◢ Support: 0.1813 | 0.1603 | 0.1281
◱◳ Indicators recommendation :
▣ Oscillators: NEUTRAL
▣ Moving Averages: STRONG_BUY
◰◲ Technical Indicators Summary : BUY
◲◰ Sharpe Ratios :
▣ Last 30D: 3.95
▣ Last 90D: 0.00
▣ Last 1-Y: 0.10
▣ Last 3-Y: 0.74
◲◰ Volatility :
▣ Last 30D: 0.44
▣ Last 90D: 0.46
▣ Last 1-Y: 0.88
▣ Last 3-Y: 1.50
◳◰ Market Sentiment Index :
▣ News sentiment score is N/A
▣ Twitter sentiment score is 0.52 - Bullish
▣ Reddit sentiment score is 0.30 - Bearish
▣ In-depth LRCUSDT technical analysis on Tradingview TA page
▣ What do you think of this analysis? Share your insights and let's discuss in the comments below. Your like, follow and support would be greatly appreciated!
◲ Disclaimer
Please note that the information and publications provided are for informational purposes only and should not be construed as financial, investment, trading, or any other type of advice or recommendation. We encourage you to conduct your own research and consult with a qualified professional before making any financial decisions. The use of the information provided is solely at your own risk.
▣ Welcome to the home of charting big: TradingView
Benefit from a ton of financial analysis features, instruments and data. Have a look around, and if you do choose to go with an upgraded plan, you'll get up to $30.
Discover it here - affiliate link -

BNB │ LONG │ 05.11.2023BINANCE:BNBUSDT.P
Comment
A great situation with BNB. The level's strong foundation on August 29, 2023, is clearly visible. The clear confirmation of the level on October 24, 2023, with the closing price almost at the level and reduced volatility on November 4, 2023, also clearly indicates the presence of a player in the market who placed a limit order at the price of 239.
When analyzing the trade, I ask myself the following question: "What happened that shouldn't have happened, and what didn't happen that should have happened?" In answering this question, I come to the conclusion that after a strong movement of the instrument, it should undergo a correction, which I do not see happening. Additionally, what strengthens my confidence in a future breakthrough is a very good consolidation with an approach to the level throughout the day. This is not a sudden price spike to the level but a slow and confident approach to the level. When the daily bar opens on November 5, 2023, we won't have to cover a long distance to reach the level because we will already be close to it. This means that there will be practically no resistance.
And this is exactly what happened.
Signals for level breakout
bar/candles closure near the level;
bar/candles closure near its high/low;
the instrument gradually approaches the level;
accumulation of energy for level breakout;
a good approach to the level;
consolidation near the level;
decrease in trading volumes before the level;
there is no reaction to a strong instrument movement;
there is a reserve of calculated ATR;
there is a reserve of technical ATR;
Signals against breaking the level
distant level retest;
Order parameters (risk-to-reward ratio = 1 to 3/4/5)
Open : 239.15175;
Stop loss : 238.393;
Take profit :241.428/ 242.18675/ 242.9455;
Disclaimer
Every trader should make their trading decisions based on their own analysis and circumstances. The signals in this channel should be considered as an additional tool for your own consideration.
Follow me and receive high-quality cryptocurrency market analysis!

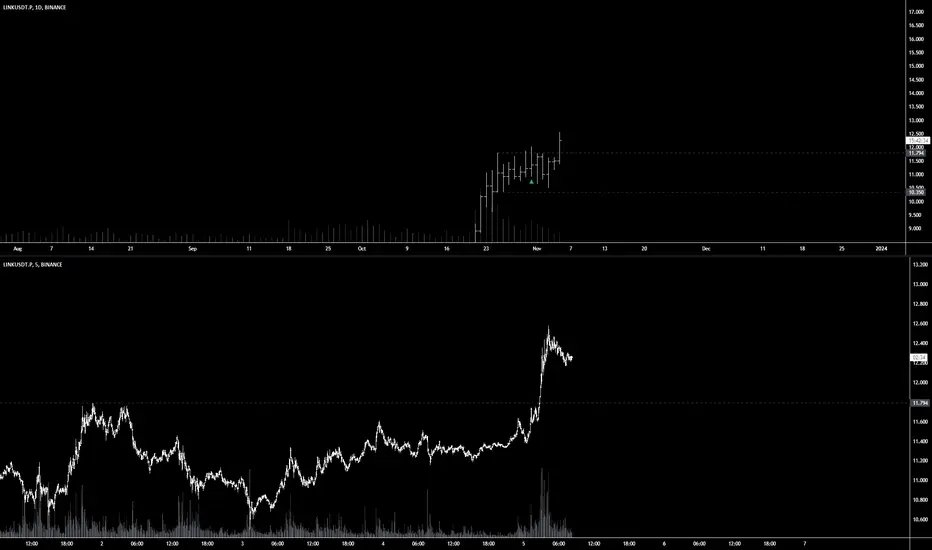
LINK │ LONG │ 05.11.2023BINANCE:LINKUSDT.P
Comment
I posted an idea for a level breakout on October 31, 2023, but that day, there was no actual breakout. Instead, a false breakout occurred, indicating a struggle around the level. Some are not willing for prices to go up, while others want it to.
Although I understood that the level would eventually be broken, I couldn't precisely predict when it would happen, as this knowledge is known to only a few who have spent half their lives in the market. However, by analyzing the chart now, I can identify two points when I would have entered a position:
November 2, 2023 - when the instrument initially moved down, but by the closing of the daily bar, it rose and closed almost at the highest level, near the level. This indicates strong buyers. Despite this, the breakout did not occur on that day, and prices fell again. But I wouldn't have lost anything since the instrument didn't reach my entry level. So, I would have canceled my order and waited for a new entry opportunity.
November 5, 2023 - the breakout occurred. Pay attention to the two days before the breakout. On November 3, 2023, the instrument confidently moved up during the day, and the next day, we see prices stabilizing at almost the same level. It was like the calm before the storm. As a result of this unusual calm, which we observed near the level only once during the entire accumulation period, we had a strong level breakout, where we could have made a move with a greater than 5-to-1 risk-reward ratio.
Conclusion: You need to be patient and wait for the instrument to be ready to break the level. Don't rush; sit quietly and wait, as if you are hunting a wild animal.
Signals for level breakout
the instrument gradually approaches the level;
accumulation of energy for level breakout;
consolidation near the level;
decrease in trading volumes before the level;
a clear zone beyond the level;
the instrument is not allowed to decrease in price;
there is a reserve of calculated ATR;
there is a reserve of technical ATR;
Disclaimer
Every trader should make their trading decisions based on their own analysis and circumstances. The signals in this channel should be considered as an additional tool for your own consideration.
Follow me and receive high-quality cryptocurrency market analysis!
TOMO │ SHORT (4H) │ 28.10.2023BINANCE:TOMOUSDT.P
You should only consider opening a trade if the 4-hour candlestick closes near the level where the candle closed on October 27, 2023, at 20:00. Otherwise, I don't recommend it.
Signals for level breakout
bar/candles closure near the level;
bar/candles closure near its high/low;
close retest of the level;
the instrument gradually approaches the level;
accumulation of energy for level breakout;
consolidation near the level;
decrease in trading volumes before the level;
there is a reserve of calculated ATR;
Trade Parameters
Open : 1.7805444;
Stop loss : 1.7908224;
Take profit :
1.7497104;
1.7394324;
1.7291544;
Disclaimer
Every trader should make their trading decisions based on their own analysis and circumstances. The signals in this channel should be considered as an additional tool for your own consideration.
Follow me and receive high-quality cryptocurrency market analysis!

LINK │ LONG │ 31.10.2023BINANCE:LINKUSDT.P
Comment
We approached the level after 6 days. There was a false breakout relative to the level, after which on the very next day, we approached the level again. The reaction to the false breakout is a strong move in the opposite direction, and although it occurred, in my opinion, the instrument is not being pushed down. This is because, on the next day, there was a strong upward movement and several approaches to the level. There are only very old levels above, and in my opinion, they do not have a significant impact in our current situation.
Signals for level breakout
close retest of the level;
the instrument gradually approaches the level;
accumulation of energy for level breakout;
consolidation near the level;
decrease in trading volumes before the level;
a clear zone beyond the level;
no response to a false level breakout;
there is a reserve of technical ATR;
the instrument is not following the market.
the instrument is stronger than the market
Signals against breaking the level
here is little ATR remaining;
the consolidation is quite wide;
Order parameters (risk-to-reward ratio = 1 to 3)
Open : 11.8147880;
Stop loss : 11.7108480;
Take profit :12.1266080;
Disclaimer
Every trader should make their trading decisions based on their own analysis and circumstances. The signals in this channel should be considered as an additional tool for your own consideration.
Follow me and receive high-quality cryptocurrency market analysis!

ARK │ LONG │ 31.10.2023BINANCE:ARKUSDT.P
Comment
The instrument is heading towards breaking its all-time highs. It's clear that it's not being pushed down. Although there are plenty of signals against taking a LONG position, they are offset by the lack of obvious restraining factors that would hinder the price from rising.
The only thing I'll personally wait for before opening a trade is consolidation. I want to see more accumulation before the level is breached.
Signals for level breakout
close retest of the level;
a clear zone beyond the level;
there is no reaction to a strong instrument movement;
the instrument is not allowed to decrease in price;
there is a reserve of technical ATR;
the instrument is stronger than the market
Signals against breaking the level
there is little ATR remaining;
no consolidation before the level;
quick approach to the level;
Order parameters (risk-to-reward ratio = 1 to 3)
Open : 1.1117106;
Stop loss : 1.1031576;
Take profit :1.1373696;
Disclaimer
Every trader should make their trading decisions based on their own analysis and circumstances. The signals in this channel should be considered as an additional tool for your own consideration.
Follow me and receive high-quality cryptocurrency market analysis!

APE │ LONG │ 03.11.2023BINANCE:APEUSDT.P
Comment
Overall, on the chart, we can observe a situation that has been unfolding for the past 10 days, and in my opinion, these 10 days represent an accumulation of energy for a level breakout. Of particular note are the last two days when the instrument closed very close to the level, and during the following day, there was an attempt to push it down, but right before closing, it was pushed back up. This indicates the accumulation of a position, and that's how I see it.
However, the one thing I'm not thrilled about is the absence of a proper consolidation before the actual level breakout. Maybe it will happen today, and for that, I need to keep an eye on it throughout the day.
Nevertheless, I'm placing an order because the instrument closed very close to the level, and it might break it even without the proper consolidation. I don't want to miss this opportunity. I'm prepared to accept a stop-loss since my target is at least 5 to 1.
Signals for level breakout
bar/candles closure near the level;
bar/candles closure near its high/low;
close retest of the level;
the instrument gradually approaches the level;
accumulation of energy for level breakout;
a good approach to the level;
there is a reserve of calculated ATR;
there is a reserve of technical ATR;
the instrument is not following the market.
Signals against breaking the level
no consolidation before the level;
Order parameters (risk-to-reward ratio = 1 to 3/4/5)
Open : 1.3960400;
Stop loss : 1.3858400;
Take profit :1.4266400 / 1.4368400 / 1.4470400;
Disclaimer
Every trader should make their trading decisions based on their own analysis and circumstances. The signals in this channel should be considered as an additional tool for your own consideration.
Follow me and receive high-quality cryptocurrency market analysis!

PERL/USDT - Perlin: BBand Breakout◳◱ On the $PERL/ CRYPTOCAP:USDT chart, the Bband Breakout pattern suggests an upcoming trend shift. Traders might observe resistance around 0.01888 | 0.01981 | 0.02153 and support near 0.01716 | 0.01637 | 0.01465. Entering trades at 0.01904 could be strategic, aiming for the next resistance level.
◰◲ General info :
▣ Name: Perlin
▣ Rank: None
▣ Exchanges: Binance, Gateio, Hitbtc
▣ Category/Sector: N/A
▣ Overview: Perlin is the first practical, trustless and decentralized cloud computing marketplace that leverages underutilized compute power in everyday smart-devices to make supercomputing economically viable and accessible globally.
◰◲ Technical Metrics :
▣ Mrkt Price: 0.01904 ₮
▣ 24HVol: 1,351,798.398 ₮
▣ 24H Chng: 5.543%
▣ 7-Days Chng: 8.24%
▣ 1-Month Chng: 11.59%
▣ 3-Months Chng: 14.10%
◲◰ Pivot Points - Levels :
◥ Resistance: 0.01888 | 0.01981 | 0.02153
◢ Support: 0.01716 | 0.01637 | 0.01465
◱◳ Indicators recommendation :
▣ Oscillators: BUY
▣ Moving Averages: STRONG_BUY
◰◲ Technical Indicators Summary : STRONG_BUY
◲◰ Sharpe Ratios :
▣ Last 30D: 1.90
▣ Last 90D: 0.62
▣ Last 1-Y: 0.46
▣ Last 3-Y: 0.73
◲◰ Volatility :
▣ Last 30D: 0.62
▣ Last 90D: 0.76
▣ Last 1-Y: 1.11
▣ Last 3-Y: 1.50
◳◰ Market Sentiment Index :
▣ News sentiment score is N/A
▣ Twitter sentiment score is 0.74 - Bullish
▣ Reddit sentiment score is N/A
▣ In-depth PERLUSDT technical analysis on Tradingview TA page
▣ What do you think of this analysis? Share your insights and let's discuss in the comments below. Your like, follow and support would be greatly appreciated!
◲ Disclaimer
Please note that the information and publications provided are for informational purposes only and should not be construed as financial, investment, trading, or any other type of advice or recommendation. We encourage you to conduct your own research and consult with a qualified professional before making any financial decisions. The use of the information provided is solely at your own risk.
▣ Welcome to the home of charting big: TradingView
Benefit from a ton of financial analysis features, instruments and data. Have a look around, and if you do choose to go with an upgraded plan, you'll get up to $30.
Discover it here - affiliate link -

RIF/USDT - RSK Infrastructure Framework: BBand Breakout◳◱ On the $RIF/ CRYPTOCAP:USDT chart, the Bband Breakout pattern suggests a consolidation phase that could precede a trend continuation or reversal. Traders might observe resistance around 0.1444 | 0.1712 | 0.22 and support near 0.0956 | 0.0736 | 0.0248. Entering trades at 0.1365 could be strategic, aiming for the next resistance level.
◰◲ General info :
▣ Name: RSK Infrastructure Framework
▣ Rank: 214
▣ Exchanges: Binance, Bybit, Gateio, Mexc, Hitbtc
▣ Category/Sector: Infrastructure - Application Development
▣ Overview: None
◰◲ Technical Metrics :
▣ Mrkt Price: 0.1365 ₮
▣ 24HVol: 12,349,139.008 ₮
▣ 24H Chng: 23.978%
▣ 7-Days Chng: 17.49%
▣ 1-Month Chng: 100.17%
▣ 3-Months Chng: 78.51%
◲◰ Pivot Points - Levels :
◥ Resistance: 0.1444 | 0.1712 | 0.22
◢ Support: 0.0956 | 0.0736 | 0.0248
◱◳ Indicators recommendation :
▣ Oscillators: BUY
▣ Moving Averages: STRONG_BUY
◰◲ Technical Indicators Summary : STRONG_BUY
◲◰ Sharpe Ratios :
▣ Last 30D: 4.30
▣ Last 90D: 1.72
▣ Last 1-Y: 1.07
▣ Last 3-Y: 0.60
◲◰ Volatility :
▣ Last 30D: 1.43
▣ Last 90D: 0.97
▣ Last 1-Y: 1.66
▣ Last 3-Y: 1.33
◳◰ Market Sentiment Index :
▣ News sentiment score is N/A
▣ Twitter sentiment score is 0.43 - Bearish
▣ Reddit sentiment score is 0.51 - Bullish
▣ In-depth RIFUSDT technical analysis on Tradingview TA page
▣ What do you think of this analysis? Share your insights and let's discuss in the comments below. Your like, follow and support would be greatly appreciated!
◲ Disclaimer
Please note that the information and publications provided are for informational purposes only and should not be construed as financial, investment, trading, or any other type of advice or recommendation. We encourage you to conduct your own research and consult with a qualified professional before making any financial decisions. The use of the information provided is solely at your own risk.
▣ Welcome to the home of charting big: TradingView
Benefit from a ton of financial analysis features, instruments and data. Have a look around, and if you do choose to go with an upgraded plan, you'll get up to $30.
Discover it here - affiliate link -

CKB/USDT - Nervos Network: BBand Breakout◳◱ On the $CKB/ CRYPTOCAP:USDT chart, the Bband Breakout pattern suggests an upcoming trend shift. Traders might observe resistance around 0.003212 | 0.003398 | 0.003889 and support near 0.002721 | 0.002416 | 0.001925. Entering trades at 0.003232 could be strategic, aiming for the next resistance level.
◰◲ General info :
▣ Name: Nervos Network
▣ Rank: 256
▣ Exchanges: Binance, Kucoin, Bybit, Huobipro, Gateio, Mexc
▣ Category/Sector: Infrastructure - Smart Contract Platforms
▣ Overview: Nervos Network is a public blockchain and collection of protocols that aim to solve the scaling limitations facing traditional networks like Bitcoin and Ethereum. Nervos' blockchain is a layer-1 protocol that uses Proof-of-Work (PoW) consensus and supports smart contract development. It also consists of a series of layer-2 scaling solutions to facilitate high-volume use cases. Nervos' native token (CKByte or CKB) allows users and developers to claim storage space on the Nervos blockchain in proportion to their holdings.
◰◲ Technical Metrics :
▣ Mrkt Price: 0.003232 ₮
▣ 24HVol: 4,794,419.814 ₮
▣ 24H Chng: 5.277%
▣ 7-Days Chng: 11.70%
▣ 1-Month Chng: 19.04%
▣ 3-Months Chng: 10.47%
◲◰ Pivot Points - Levels :
◥ Resistance: 0.003212 | 0.003398 | 0.003889
◢ Support: 0.002721 | 0.002416 | 0.001925
◱◳ Indicators recommendation :
▣ Oscillators: SELL
▣ Moving Averages: STRONG_BUY
◰◲ Technical Indicators Summary : BUY
◲◰ Sharpe Ratios :
▣ Last 30D: 5.44
▣ Last 90D: 1.40
▣ Last 1-Y: 0.42
▣ Last 3-Y: 0.62
◲◰ Volatility :
▣ Last 30D: 0.45
▣ Last 90D: 0.52
▣ Last 1-Y: 0.95
▣ Last 3-Y: 1.30
◳◰ Market Sentiment Index :
▣ News sentiment score is N/A
▣ Twitter sentiment score is 0.56 - Bullish
▣ Reddit sentiment score is 0.57 - Bullish
▣ In-depth CKBUSDT technical analysis on Tradingview TA page
▣ What do you think of this analysis? Share your insights and let's discuss in the comments below. Your like, follow and support would be greatly appreciated!
◲ Disclaimer
Please note that the information and publications provided are for informational purposes only and should not be construed as financial, investment, trading, or any other type of advice or recommendation. We encourage you to conduct your own research and consult with a qualified professional before making any financial decisions. The use of the information provided is solely at your own risk.
▣ Welcome to the home of charting big: TradingView
Benefit from a ton of financial analysis features, instruments and data. Have a look around, and if you do choose to go with an upgraded plan, you'll get up to $30.
Discover it here - affiliate link -

ANT/BTC - Aragon Network: Elliott_Wave_12345◳◱ Hey traders, we've identified an Elliott Wave 12345 pattern on the UPCOM:ANT / CRYPTOCAP:BTC chart. This pattern is a bullish indication and could indicate a potential trend reversal. The next resistance key levels are at 0.00015821 | 0.00017552 | 0.00020388 and the major support zones are respectively at 0.00012985 | 0.0001188 | 0.00009044. We may consider buying at the end of wave 5 at the current price level at 0.00013225.
◰◲ General info :
▣ Name: Aragon Network
▣ Rank: 187
▣ Exchanges: Binance, Kucoin, Huobipro, Bittrex, Kraken, Hitbtc
▣ Category/Sector: Infrastructure - Misc
▣ Overview: The Aragon Network (Aragon) is a decentralized autonomous organization (DAO) whose goal is to act as a “digital jurisdiction” that aims to make it possible for organizations, entrepreneurs and investors to do business without a legal nexus.
◰◲ Technical Metrics :
▣ Mrkt Price: 0.00013225 ₿
▣ 24HVol: 6.260 ₿
▣ 24H Chng: -5.102%
▣ 7-Days Chng: -6.40%
▣ 1-Month Chng: -7.91%
▣ 3-Months Chng: 9.75%
◲◰ Pivot Points - Levels :
◥ Resistance: 0.00015821 | 0.00017552 | 0.00020388
◢ Support: 0.00012985 | 0.0001188 | 0.00009044
◱◳ Indicators recommendation :
▣ Oscillators: NEUTRAL
▣ Moving Averages: STRONG_SELL
◰◲ Technical Indicators Summary : SELL
◲◰ Sharpe Ratios :
▣ Last 30D: -0.27
▣ Last 90D: 1.57
▣ Last 1-Y: 1.65
▣ Last 3-Y: 0.74
◲◰ Volatility :
▣ Last 30D: 0.31
▣ Last 90D: 0.42
▣ Last 1-Y: 0.73
▣ Last 3-Y: 1.32
◳◰ Market Sentiment Index :
▣ News sentiment score is N/A
▣ Twitter sentiment score is 0.52 - Bullish
▣ Reddit sentiment score is 0.57 - Bullish
▣ In-depth ANTBTC technical analysis on Tradingview TA page
▣ What do you think of this analysis? Share your insights and let's discuss in the comments below. Your like, follow and support would be greatly appreciated!
◲ Disclaimer
Please note that the information and publications provided are for informational purposes only and should not be construed as financial, investment, trading, or any other type of advice or recommendation. We encourage you to conduct your own research and consult with a qualified professional before making any financial decisions. The use of the information provided is solely at your own risk.
▣ Welcome to the home of charting big: TradingView
Benefit from a ton of financial analysis features, instruments and data. Have a look around, and if you do choose to go with an upgraded plan, you'll get up to $30.
Discover it here - affiliate link -

1000PEPE │ SHORT │ 29.10.2023BINANCE:1000PEPEUSDT.P
Signals for level breakout
bar/candles closure near the level;
bar/candles closure near its high/low;
close retest of the level;
the instrument gradually approaches the level;
accumulation of energy for level breakout;
a good approach to the level;
consolidation near the level;
decrease in trading volumes before the level;
the instrument is being held from falling/rising in price;
there is a reserve of calculated ATR;
there is a reserve of technical ATR;
Trade Parameters
Open : 0.0011024;
Stop loss : 0.0011243;
Take profit :
0.0010367;
0.0010148;
0.0009929;
Disclaimer
Every trader should make their trading decisions based on their own analysis and circumstances. The signals in this channel should be considered as an additional tool for your own consideration.
Follow me and receive high-quality cryptocurrency market analysis!

RUNE │ LONG │ 31.10.2023BINANCE:RUNEUSDT.P
Comment
In fact, this situation is not standard for me, but there is something that seems special. Normally, when an instrument experiences a significant increase over a short period, a typical reaction to such growth is a correction. However, I do not see this behavior in the instrument. Instead, I observe an unusual pattern where the instrument starts consolidating. Such behavior indicates the intention of the instrument to move in the same direction as before. Another strong signal for a breakout is that despite BTC and the broader market gradually moving lower, our instrument is gradually moving higher. This suggests that there is a strong presence in this instrument that can go against the crowd.
A day trader's task is to try to find traces of a major player, understand what they are doing, and where the instrument is likely headed, then join them. In this case, I'll be joining the buyers.
If the price starts to sharply decline, I will cancel the order and monitor the price throughout the day to see if it resumes an upward move or if I should remove the instrument from my watchlist.
Signals for level breakout
consolidation near the level;
there is no reaction to a strong instrument movement;
there is a reserve of technical ATR;
the instrument is not following the market.
Signals against breaking the level
there is little ATR remaining;
Order parameters (risk-to-reward ratio = 1 to 3)
Open : 2.8322640;
Stop loss : 2.8159440;
Take profit :35.8972240;
Disclaimer
Every trader should make their trading decisions based on their own analysis and circumstances. The signals in this channel should be considered as an additional tool for your own consideration.
Follow me and receive high-quality cryptocurrency market analysis!

LQTY │ SHORT │28.10.2023BINANCE:LQTYUSDT.P
Signals for level breakout
bar/candles closure near the level;
bar/candles closure near its high/low;
consolidation near the level;
there is no reaction to a strong instrument movement;
there is a reserve of calculated ATR;
there is a reserve of technical ATR;
Trade Parameters
Open : 1.6678308;
Stop loss : 1.6886770;
Take profit :
1.6052920;
1.5844457;
1.5635995;
Disclaimer
Every trader should make their trading decisions based on their own analysis and circumstances. The signals in this channel should be considered as an additional tool for your own consideration.
Follow me and receive high-quality cryptocurrency market analysis!

POLYX │ LONG │ 31.10.2023BINANCE:POLYXUSDT.P
Comment
Usually, with a strong instrument's growth, there should be an equally strong movement in the opposite direction. However, instead, we see a calm consolidation, which is a very strong signal.
At present, POLYX looks the most promising for an upward continuation out of all the ideas already published, as there is consolidation before the level is breached. In other words, the instrument has increased in price, stopped, is gaining strength, undergoing consolidation, and is likely to move higher.
At least that's how I see it. If there are sharp price changes, I will cancel the order.
Signals for level breakout
bar/candles closure near its high/low;
close retest of the level;
accumulation of energy for level breakout;
consolidation near the level;
decrease in trading volumes before the level;
a clear zone beyond the level;
there is no reaction to a strong instrument movement;
the instrument is not allowed to decrease in price;
there is a reserve of calculated ATR;
there is a reserve of technical ATR;
the instrument is not following the market.
the instrument is stronger than the market
Order parameters (risk-to-reward ratio = 1 to 3)
Open : 0.4316427;
Stop loss : 0.4194294;
Take profit :0.5049225;
Disclaimer
Every trader should make their trading decisions based on their own analysis and circumstances. The signals in this channel should be considered as an additional tool for your own consideration.
Follow me and receive high-quality cryptocurrency market analysis!

Bulls and Bears zone for 11-01-2023Market is trying to rally this morning after selling off during ETH session.
We could have a range bound session today.
Level to watch 4213 --- 4211
Reports to watch:
US:ISM Manufacturing Index
10:00 AM ET
US: Construction Spending
10:00 AM ET
US:JOLTS
10:00 AM ET
US:EIA Petroleum Status Report
10:30 AM ET
US:FOMC Announcement
2:00 PM ET
US: Fed Chair Press Conference
2:30 PM ET
