what will happen to MANAUSDT after 100% fallinghello
as you can see MANAUSDT is in the support key level and after nearly 5 months of falling it may be time to increase a little after touching the lowest level of the channel
all you need to know is in the chart
good lock
The information provided on this Page does not constitute investment advice, financial advice, trading advice, or any other sort of advice and you should not treat any of the website's content as such. this page does not recommend that any cryptocurrency should be bought, sold, or held by you. Do conduct your own due diligence and consult your financial advisor before making any investment decisions
Technical_analysis

Don't miss opportunity for short position NZDUSDhello
as you can see a flag pattern for NZDUSD and it has potential to downward from the point that we showed in chart
all you need is in chart
good lock
The information provided on this Page does not constitute investment advice, financial advice, trading advice, or any other sort of advice and you should not treat any of the website's content as such. this page does not recommend that any cryptocurrency should be bought, sold, or held by you. Do conduct your own due diligence and consult your financial advisor before making any investment decisions

What is the next movement of BITCOINHello everyone
If this support is lost, we can consider the next point of 15500
Otherwise, an upward trend up to 18,000 can be predicted in the 4-hour time frame
all you need to know is in the chart
good luck
The information provided on this Page does not constitute investment advice, financial advice, trading advice, or any other sort of advice and you should not treat any of the website's content as such. this page does not recommend that any cryptocurrency should be bought, sold, or held by you. Do conduct your own due diligence and consult your financial advisor before making any investment decisions

TATA STEEL Broken the Trend LineTATA STEEL took support on this trend line 3 times and now it broken with some big red candle in 1-day time frame.
Overall it looks like a bearish trend in weekly time frame and reverse in Fibonacci retracement tool at 61.8% level confirms the correction has finished and now ready to come down the mentioned levels. NSE:TATASTEEL

XRP technical analyze | posibility for long position on XRPUSDThello guys
we have a very good opportunity for XRP long position
As you can see in the chart, there is 2 way for XRP movement, and its up to Bitcoin movement in the next few days, so you should wait for a break out or confirmation of rejection
all you need to know is in the chart
good luck
The information provided on this Page does not constitute investment advice, financial advice, trading advice, or any other sort of advice and you should not treat any of the website's content as such. this page does not recommend that any cryptocurrency should be bought, sold, or held by you. Do conduct your own due diligence and consult your financial advisor before making any investment decisions

BTCUSDT Long position Possibilitywe are going to have a look at the changes in the Bitcoin market in terms of data in the network, let's check the potential in the network for price growth, take a look at the miners, measure the supply and demand situation, and finally finish with the options market.
In general, the health of the network has improved in terms of activity compared to the previous days, and the positive point that exists is that the activity of the key range has not been lost, but in general, the level of activity is still low,
and most of the activity is done by small traders, because if we go, number If we check the transactions, we can see that there has been growth, and on contrary, the volume of transactions is at a low level,
and it shows that the whales of the network do not want to be active at the moment. In the past few days, we saw the weakening of the security of the Bitcoin network.
fell, the hash rate was decreasing at a relatively high speed, but the current situation has reached its key range, now that news has been published,
if this news is definitive, it will cause many miners to be affected, and consequently, the hash rate will be affected. It has an impact and the possibility of losing this key range increases, now considering that the income of miners
is also decreasing and if the price stays in these areas, it may strengthen the risk from this category again.
Well, I also mentioned the income of the miners. In general, the income of this category through
the construction of blocks is still decreasing compared to a year ago, but it has not reached the green area where the miners are under a lot of pressure. On the other hand, the income of the miners from Through the network has risen a bit,
but it has not been able to significantly affect the total income. If we come to check the valuation of Bitcoin, we will see that it is involved in a negative bubble, according to the MBRM index, this issue will be very clear to us.
It has a significant history and it has shown that when bitcoin is involved in a negative bubble, those who see it have investments and demand that bitcoin will be profitable for them in the long term,
but I know that you know better than me that market conditions change in every period. Paying attention to this issue, for investment, we should not pay attention to one element and must consider the view of the action market.
If I go to the supply & demand layer and check the demand, we can see that the demand and the network are mainly on the side of the traders, and they are accumulating, but for those who have ten bitcoins,
this accumulation has calmed down a bit and they show me indecision. 16400 has become very attractive for traders and it is considered an important range because almost ten percent of the circulating balance is in this area,
and if we pay a little more attention, we can also see the behavior of speculators because when the price goes up, they sell at a profit. And again, when we return to these areas,
we see that the circulating assets are growing in this area, now if we check in terms of supply, in general, the level of hash and network has come down, whether in profit or loss, but during the past day, we have seen We had a series of sales, and again, the sales were at a loss,
and it happened from those whose coins were between 3 and 6 months old, who had the highest sales, and the total amount sold in this category was 22,000 bitcoins, but those who were in profit.
Now, they prefer to withdraw their own coins, instead of the old ones It has been 7 to 10 years wallet that the amount was low and their number was 590, and then it was two to three years that they took out 2000 bitcoins,
but the more important thing is the behavior of speculators.
We see that the sellers are buying in the support areas, the price goes up a bit, they sell, and until the price cannot break those areas that make a profit,
the price growth can be uncertain.
Finally, if we check the amount of Bitcoin input and output to exchanges, the input is more dominant, but I don't see very serious inputs, so in general, even though Bitcoin is located in valuable areas, the potential in the network is less than before,
if the important areas of security activity are lost. Lamb naturally affects the health of the network and that effect will be negative
In terms of supply and demand,
we can see that the demand in the network is not so high, although the width in the network is low, but the behavior of investors is more than everyone else at the moment.
Finally, we turn to the option market
, we see that the most important maturity date is December 30, the volume of open contracts is very high (approximately 2.3 billion), the most important support for us is at $15,000, then $12,000, and finally $10,000, that's right, $10,000 has much higher open interest. But in order to reach $10,000, we must first lose $15,000.
Now, considering that we mentioned that the range of 16,400 is very attractive for traders, and it has been able to work well for now.
In the end, if we examine the implied volatility together, which shows me the expectations of traders and price changes, it somehow shows the foresight of option traders. We can mention 2 things:
One is that the traders expect that we will reject this area, whether it goes up or down, on the other hand, it is a good time for those who want to work with options because the contracts have become cheaper,
and it is possible that we will see new contracts in the coming days. There will be a lot of new sentiment in this market, and if there are any changes, we will definitely update
The information provided on this Page does not constitute investment advice, financial advice, trading advice, or any other sort of advice and you should not treat any of the website's content as such. this page does not recommend that any cryptocurrency should be bought, sold, or held by you. Do conduct your own due diligence and consult your financial advisor before making any investment decisions

Bitcoin Technical Analysis 2022 - Based on OnBalanceVolumeHello every one, hope you all are doing good.
This is not a financial Advice, crypto is very volatile and risky, so please do research by your own before doing trade.
OBV OnBalanceVolume is one of important indicator to find the volume locations/movement of volume and the movement of the price.
sometimes it's hard to find out the Divergences using RSI alone, stochastic oscillator and MFI is also one good indicator to identify the Divergences.
Apart from RSI, MFI and stochastic, we can find divergence using OBV too.
For example, as I mentioned in the chart, the Orange Box (from Jan 2015 to April 2016) the price action of Bitcoin was roughly from 200usd to 500usd
but the OBV value is showing a huge "Divergences" roughly from just 3M to 23M perhaps the all-time high of OBV is 37M.
So, most of the critical volume is inside this orange zone, so throughout the life cycle of Bitcoin this volume is playing a vital role until now.
According to Wyckoff theory the market movers or market makers or so-called Composite Men (Orange Box) who buy cheaply and sell at high.
Ok, let's come to point, this time am making this Bitcoin Analysis based on OBV to find the critical zones of volume and where we are at now throughout the Bitcoin Life Cycle.
After deeply analyzing the OBV and drawing the trendlines and channels where the volume and price is respecting more, after the massive Breakout from the parallel channel (at orange zone),
Orange zone is the actual/core accumulation zone of overall Bitcoin where the Composite Men accumulated buying very cheaply and keep Distributing till now and Distribute until the Bitcoin is reset.
Final Conclusion1:
After the massive Breakout from the Parallel channel, the Momentum of OBV is not drastically increasing but instead its Dropping steadily.
From 2016-Breakout to until now 2022 the OBV value is ranging between roughly 25M to 38M (not huge difference), the momentum of going up is Dropped and
Instead of Breakout from the channel it Brokedown in the current Bear Market 2022 this is something concerned of.
So most likely the OBV will keep testing and testing the top of the channel and to my guess it keeps failing and failing same as the blue ascending triangle in the chart
and don't know when but, at some point of time at least once, it should test the bottom of the parallel channel. (May be this test will be the Reset point for Bitcoin).
Final Conclusion2:
Currently there is a slight Divergence created in OBV as price falling and OBV is showing small uptrend.
So most likely soon there will be a counter move in the upside direction and test the upper line of the parallel channel.
(In most cases this kind of slight Divergences happens in corrective waves when the market is selling off (during Distribution phase) and forcibly divert the market to move in reverse direction).
Please give a like and comment if you have any questions.
Thank you.

💁♂️ ETHUSDT / 6H Short From 1220/1240 ?🤔 let's see ❗💁♂️ HI Everyone... As you can see, the price has reacted positively to the specified support zone after a 14% correction. Currently, the price is in the suffering range. It is possible that the price will reach the $1220/$1240 FVG range created by the reaction Be positive. For the desired scenario, it is important to maintain the $1150/$1170 range. 💹
Support ranges $1100/$1070 ⚠❗
Resistance ranges $1207/$1220/$1240❗
❎ (DYOR)...⚠⚜
WHAT DO YOU THINK ABOUT THIS ANALYSIS? I will be glad to know your idea 🙂✌
IF you like my analysis please LIKE and comment 🙏✌

$APE - something like thisHello my Fellow TraderZ,
As like many other #ALTS , $APE is also looking WEAK despite strong moves few days earlier.
Here is my projection on #APE in coming days. Also this idea is still very much in play but if the market decides to SHORT SQUEEZE first then I guess major resistance for #APECOIN comes near $5.40.
Have it on radar.
Happy Trading. CHEERS!!!

Don't miss opportunity for short position BNBhello guys
we have a very good opportunity for BTC long position
as you can see in the chart trendline has broken and it might be a very good time to open short in BNB
all you need to know is in the chart
good luck
The information provided on this Page does not constitute investment advice, financial advice, trading advice, or any other sort of advice and you should not treat any of the website's content as such. this page does not recommend that any cryptocurrency should be bought, sold, or held by you. Do conduct your own due diligence and consult your financial advisor before making any investment decisions

Don't miss opportunity for Short position COSMOShello guys
we have a very good opportunity for BTC long position
If it stabilizes below the trend line, it can be expected to fall to the specified range
all you need to know is in the chart
good luck
The information provided on this Page does not constitute investment advice, financial advice, trading advice, or any other sort of advice and you should not treat any of the website's content as such. this page does not recommend that any cryptocurrency should be bought, sold, or held by you. Do conduct your own due diligence and consult your financial advisor before making any investment decisions

this is my opinion about Quant hello guys
we have a very good opportunity for BTC long position
it is mostly a long position and you can martingale in this position
all you need to know is in the chart
good luck
The information provided on this Page does not constitute investment advice, financial advice, trading advice, or any other sort of advice and you should not treat any of the website's content as such. this page does not recommend that any cryptocurrency should be bought, sold, or held by you. Do conduct your own due diligence and consult your financial advisor before making any investment decisions

Don't miss opportunity for long position ETHhello guys
we have a very good opportunity for BTC long position
it's funny because in my personal opinion I think ETH will rise up a little from here but the chart tells us it will fall.
Logic says to rely on evidence
all you need to know is in the chart
good luck
The information provided on this Page does not constitute investment advice, financial advice, trading advice, or any other sort of advice and you should not treat any of the website's content as such. this page does not recommend that any cryptocurrency should be bought, sold, or held by you. Do conduct your own due diligence and consult your financial advisor before making any investment decisions

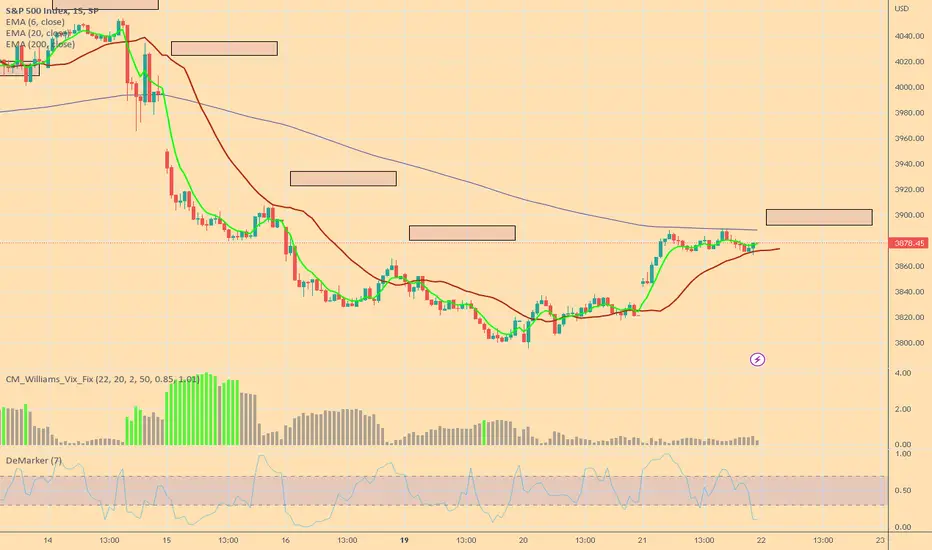
Bulls and Bears zone for 12-22-2022It seems that last couple of days rally could have been short squeeze.
ETH session market has been selling off and testing yesterday's Low.
Level to watch 3885 --- 3883
Report to watch:
US: EIA Natural Gas Report
10:30 AM ET
Bitcoin TA from 2010 to 2022 - Based on previous Patterns/cyclesAs I said I will post an idea different from Elliott wave theory. Not a financial Advice, this is my personal opinion or idea.
This Bitcoin Technical Analysis is purely based on studying its own previous trends/cycles and predicting the future cycle.
This is not based on Elliotte wave Theory nor am comparing it with DXY or S&P or Dow, next time I will make an idea based on correlation with DXY/Dollar.
Before proceeding I will tell an interesting story " The Story of Zombie and chickens".
A lazy zombie maintains the chicken farm, since chickens grow and breed faster so the numbers are keep growing n growing.
Throughout the year zombie keeps eating chickens and he keeps growing bigger n bigger. Since the zombie is very lazy, he needs help and maintains a dog to look after all the chickens.
As per now for every 4 years or so zombie gets seasonal disease and to get recover himself, he eats chickens in a massive number, not all though.
Dog also keeps eating for his survival, but after all its dog, so when the dog gets older and unable to handle the chickens, zombie appoints a new young dog to take his place.
The conclusion of this story is "Zombie never dies and keeps growing n growing, chickens are born kill and the dog keeps replaced by a new dog".
Ok let's proceed with our Analysis. Different traders visualize the charts in different ways based on their own perception. Chart is the emotions of all traders, it's like map of treasures.
I see many people use trend lines, Fibonacci, moving averages, Ichimoko or other technical indicators and many other.
Even I use many of these, but for this am not using averages or Fibonacci or Ichimoko. Am using RSI and money flow index indicators and triangle pattern for this.
1.Explaining the Patterns or drawings which I created:
Chart patterns in longer time frames, price moves in waves or some kind of curves rather than straight lines/trendlines.
I made some concentric circles where the price is respecting more (basically support n resistances), that doesn't mean the price goes in a circular fashion and goes back to its origin - zero.
Always trend breaks (upside or downside) so may be at some point of time it may break out this circular channel and form a new trend of circles.
I created the triangle pattern in this way --> (A)previous ATH-> to ->(B)current ATH-> to ->(C)lowest bearish Point-> to -> Highest counter move).
For each Bull of Bitcoin (with in 2yrs or so), it is forming a kind of symmetrical triangle with ABCD waves inside it.
(Symmetrical Triangle pattern --> Breaking out of the pattern --> new Bull or new Triangle pattern again).
2.Observation and conclusion taken from the patterns:
After deeply observing the previous 3 symmetrical triangles of Bitcoin-Green, Blue and Purple. I was wandering how to make the current pattern.
The information I have is (previous ATH 20k (point A) + current ATH 70k (point B) + I took 15500(point C) as temporary Bottom.
The conclusion is Green + Blue + Purple triangles are symmetrical in shape. (Symmetrical triangles are mostly bullish and breakout upside not compulsory though).
But for the current cycle, bitcoin is making is Descending triangle. Descending triangle patterns are generally bullish as well as bearish depend on where they are created.
(At the Bottom OR At top of the cycle). As of now it is at the top (so this means there are chances it may breakdown from this Descending triangle).
What I observed is cycle after cycle the width of the triangles are increasing and the height is getting decreased, technically what does this mean?
what I concluded is the move of going sideways is increasing and the momentum or motive of going up is diminishing/normalizing.
(So, this means there are high chances Bitcoin may move less upside and may go sideways or down).
One more thing I observed is after massive move/action of correction of every cycle (Bitcoin Bottom) there is counter move/reaction (Point D of the Triangle).
Generally, the point "D" of every cycle is laying above the top edge of previous symmetrical triangle (the sky-blue horizontal arrow lines).
(So based on the above observation I took the "D" point at 50k as counter move/reaction for current cycle/Descending triangle,
also, it is coinciding with the concentric circles which I made).
3.Final Conclusion, studying the current Descending triangle (Red)/Probabilities:
After over all study, this is my Personal Opinion:
1.Current correction is so massive with in short period of time, considering previous counter rallies and currently bullish Divergences formed in RSI + MFI taking into account,
so high possibilities that there can be a counter rally up to 50k or more than that.
2.I don't think current low 15495 is Bottom for Bitcoin. May be temporary Bottom or it may go little lower than now creating 2 layers of bullish divergences in RSI (for temp Bottom).
(Technically current pattern is Descending triangle, so high possibilities that Bitcoin may make lower low (another low may be 13780) after the counter rally.
to my guess Bitcoin may put its lower low after the Halving).
4.Probabilities of next Bull/cycle:
case1: After Bitcoin making lower low (may be 13.7k), this is the situation DO/DIE for Bitcoin.
If Bitcoin manages to break out of this Descending triangle similar to previous moves, it can put a new ATH (for another decade Bitcoin may trade between 19k to 160k).
case2: Since current pattern is Descending triangle, if Bitcoin fails to breakout from this channel, there are high probabilities that it will break down.
If Bitcoin Breaks Down, most likely it will reset itself from over all cycle right from 2010. (This scenario can be same as my previous Elliott wave theory which I already shared.)
Am sorry my Technical Analysis looks little complex; I hope I explained well.
Thank you.

$BNB - Through the hollow lanesHello my Fellow TraderZ,
All this FUDs seem to be working properly for the #BINANCE Haters.
But the question is that, will this collapse like $FTT. Reminder that I am talking about the Token not Exchange.
Look, $BNB is going to test its last major support of $180-190. Breaking would taking this one to $120-130.
Although the major support is still $40. Keep your bid around these levels.
Honestly, chart showing disaster for #BNB. Only current nearby support & CZ could save this massacre.
Lets see.
Happy Trading. CHEERS!!!

Don't miss opportunity for short position ETHhello guys
we have very good opportunity to ETH short position
as you have see trend line has broken and after pullback you can open your position
all you need to know is in chart
good luck
The information provided on this Page does not constitute investment advice, financial advice, trading advice, or any other sort of advice and you should not treat any of the website's content as such. this page does not recommend that any cryptocurrency should be bought, sold, or held by you. Do conduct your own due diligence and consult your financial advisor before making any investment decisions

Bulls and Bears zone for 12-14-2022Yesterday was the second time S&P 500 tested 4100 level this month which could be a major resistance level at this time.
In addition, yesterday's sell off could be an indication that trades have less confidence in this rally.
Level to watch 4052 --- 4050
Reports to watch:
US:EIA Petroleum Status Report
10:30 AM ET
US:FOMC Announcement
2:00 PM ET
US:Fed Chair Press Conference
2:30 PM ET


Channel Still IntactThe down trend is still intact here and the index looks to be loosing strength at this critical level. Looking at a macro lower high & local lower high with bearish momentum starting to build. Still short here with a target around 3300 in the first quarter of 2023

BTC/USDT Binance technical analysisHello,
Today I will look at the BTC/ USDT pair on Binance in the 4h timeframe. The demand zone is sitting around 16K, and the supply zone is around 17K. I can see that the descending triangle is formatted, and I am expecting that the price will go downward from its current position. I am expecting a downtrend, bearish movement, and the price of Bitcoin to go down to at least $16200 in the next few days. Even if we had some small uptrend situations in the past few days, we are still in a bearish cycle. If the opposite happens (a bullish movement), we can expect the price to rise around $18,000, but I doubt it.
Enjoy & have an amazing day!
BF

$FTM - doomed in Lower TimeFrameHello my Fellow TraderZ,
In my previous analysis about $FTM on Daily, I made a cautious statement regarding its PULLBACK to test the EMA55 on Daily at the least.
If you see here on lower TF, price has broken the support TL. So, I am expecting a slight above move to retest the broken TL(looking at S.RSI) and continue the down path.
BUT If the price reclaims the TL then this down move would be a FAKEOUT & price could once again tend to retest the Major above TL(Daily).
Be patient, anyside $FTM will move rapidly.
Happy Trading. CHEERS!!!

$FTM - Just a matter of TimeHello my Fellow TraderZ,
#FANTOM $FTM - consolidating near the TL. Well I wish this one to break upward for some handsome profit.
But if you see on DTF, S.RSI is on overbought territory, which could bring price further down towards $0.2050-.2175.
Well I am just sitting and waiting for either the pullback or break the TL.
CHEERS!!!
