EURGBP is Nearing the Daily Trend!!!Hey Traders, in the coming week we are monitoring EURBBP for a buying opportunity around 0.86400 zone, EURGBP is trading in an uptrend and currently is in a correction phase in which it is approaching the trend at 0.86400 support and resistance area.
Trade safe, Joe.
Technical Analysis

FARTCOIN Breakout Watch – Red Resistance Approaching! 🚨 $FARTCOIN Breakout Watch – Red Resistance Approaching! 🔴⏳
$FARTCOIN is approaching the red resistance zone.
📊 If breakout confirms, next move could target:
🎯 First Target → Green line level
A breakout could trigger bullish continuation and upside momentum.

NZDUSD: More Growth Ahead Next Week 🇳🇿🇺🇸
NZDUSD may continue rising next week after a confirmed bullish
trap that occurred following a text of a key daily horizontal support.
A local consequent Change of Character CHoCH indicates
a strength of the buyers and a highly probable growth.
Next resistance - 0.6
❤️Please, support my work with like, thank you!❤️
I am part of Trade Nation's Influencer program and receive a monthly fee for using their TradingView charts in my analysis.

NASDAQ Potential UpsidesHey Traders, in today's trading session we are monitoring NAS100 for a buying opportunity around 23,300 zone, NASDAQ is trading in an uptrend and currently is in a correction phase in which it is approaching the trend at 23,300 support and resistance area.
Trade safe, Joe.

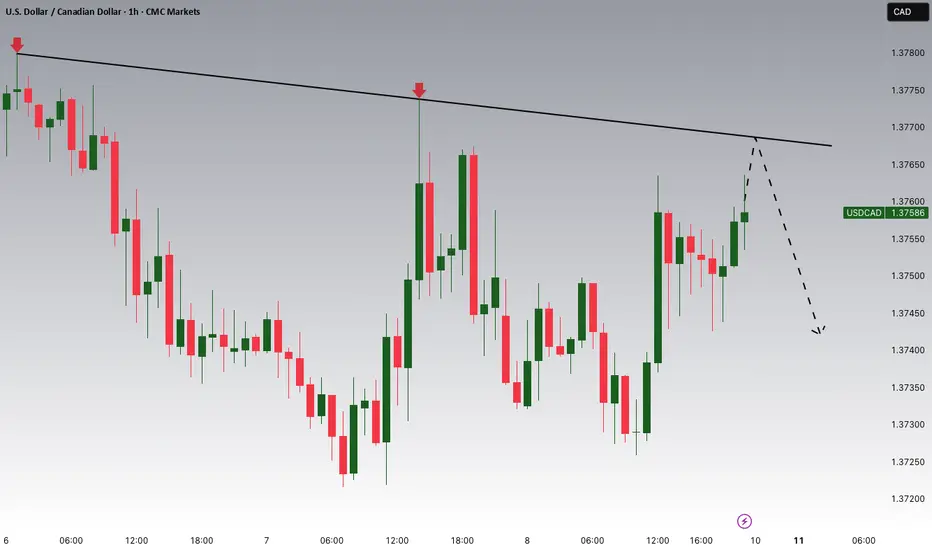
USDCAD Potential DownsidesHey Traders, in the coming week we are monitoring USDCAD for a selling opportunity around 1.37700 zone, USDCAD is trading in a downtrend and currently is in a correction phase in which it is approaching the trend at 1.37700 support and resistance area.
Trade safe, Joe.
XAUUSD Weekly Plan a Liquidity Clean-Up?XAUUSD Weekly Plan – The Final Bullish Push Before a Liquidity Clean-Up?
Are you ready for a high-volatility week?
Last week, Gold continued to move steadily inside its bullish channel, reaching the FVG High Zone and pushing towards the strong resistance cluster at 3426–3428 (OBS Sell Zone).
The bullish structure on H2–H4 remains intact, but as price enters the distribution zone, candles are tightening, and volume is fading — a clear sign that buying pressure is weakening.
Macro Backdrop – What’s on the Calendar?
This week is packed with high-impact USD data:
CPI (Aug 12) – Major inflation reading, key driver for USD & Gold.
PPI (Aug 14) – Producer inflation, often a leading indicator for CPI trends.
Unemployment Claims (Aug 14) – Short-term labour market indicator.
💡 Expectations:
CPI & PPI are forecast to improve compared to last month.
If confirmed, this could trigger a sharp Gold pullback as USD strengthens.
However, a weak CPI/PPI could give Gold one last bullish spike before reversal.
Technical Outlook
The H2 bullish channel is well-defined.
The top of the channel aligns with the FVG High Zone — a key area for big player sell limits and profit-taking.
Likely scenario:
Price extends to test 3426–3428 Sell Zone.
Bearish reaction → Channel breakdown.
Retest VPOC 3395–3400 → Drop towards liquidity pools below.
Key Trading Levels
SELL Zone: 3426 – 3428
SL: 3434
TP: 3420 → 3415 → 3410 → 3405 → 3400 → 3395 → 3390 → 3380 → 3370 → 3360
BUY Zone: 3330 – 3328
SL: 3322
TP: 3335 → 3340 → 3350 → 3360 → 3370 → 3380
Risk Management Notes
⚠️ This is a high-risk news week — false breaks are highly possible before & after CPI/PPI.
Avoid holding heavy positions during key data releases.
If price breaks above 3434 with strong volume, bearish scenarios are invalid → wait for a new structure.
📌 Summary:
Primary bias → Sell from 3426–3428, target downside liquidity pools.
Secondary play → Buy from 3330–3328 if liquidity sweep occurs.
Stay disciplined. Manage risk. Don’t get caught in the volatility trap.
— MMFlow Trading

NZDUSD Potential UpsidesHey Traders, in today's trading session we are monitoring NZDUSD for a buying opportunity around 0.59050 zone, NZDUSD is trading in an uptrend and currently is in a correction phase in which it is approaching the trend at 0.59050 support and resistance area.
Trade safe, Joe.

CORZ Earnings Alert — Bearish Setup Ahead of BMO Report****⚠️ CORZ Earnings Alert — Bearish Setup Ahead of BMO Report**
Core Scientific (CORZ) faces heavy fundamental headwinds with declining revenue (-55.6%) and negative margins, despite some bullish options flow and technical support near \$14.
**📉 Market Sentiment:**
* Moderate bearish conviction (75%)
* Mixed signals: cautious optimism from options flow vs. weak fundamentals
* Watch M\&A uncertainty and regulatory risks
**🛠 Trade Setup:**
* **Instrument:** CORZ
* **Direction:** PUT (SHORT)
* **Strike:** \$14
* **Entry Price:** \$0.16
* **Profit Target:** \$0.48 (200-300% gain)
* **Stop Loss:** \$0.08
* **Expiry:** 2025-08-08
* **Size:** 1 contract
* **Entry Timing:** Pre-earnings close
**🔑 Key Levels:**
* Support near \$14
* Resistance at \$15
* Expected Move: -\$2.50
**⚠ Risk Management:**
* Cut losses at 50% premium decline (\$0.08)
* Exit by market open next day if no target hit
---
**#CORZ #CoreScientific #EarningsTrade #PutOptions #BearishSetup #OptionsTrading #CryptoStocks #MAndA #RiskManagement #TechnicalAnalysis #TradingView #StockMarket #Volatility #ShortSetup**

LLY Is Overbought ---$615 Put Play**💊 LLY WEEKLY TRADE IDEA — BEARISH PRESSURE BUILDING**
📉 **Sentiment:** Strong bearish lean (70% confidence) — low RSI, high volume distribution.
📊 **Institutional Flow:** 1.7x weekly volume, puts stacking near key strikes.
⚠ **Risk:** Gamma risk + oversold → expect high volatility.
**🛠 Setup:**
* **Direction:** PUT (Short bias)
* **Strike:** \$615
* **Expiry:** 2025-08-15
* **Entry:** \$2.20 – \$2.40
* **PT:** \$3.30 (50-100% gain target)
* **SL:** \$1.20 (\~40-50% loss cap)
📌 **Why?**
* Daily RSI \~20, Weekly RSI \~33 → both falling
* Institutional selling pattern confirmed
* Bearish volume + neutral C/P ratio tilt
💡 *Timing is key — oversold = possible dead-cat bounce before breakdown to \$605 support.*

MarketBreakdown | USDJPY, NZDUSD, EURJPY, US100
Here are the updates & outlook for multiple instruments in my watch list.
1️⃣ #USDJPY daily time frame 🇺🇸🇯🇵
The market is trading in uptrend.
After the price updated a high, it retraced.
I see a consolidation now and a formation of a narrow
horizontal trading range.
A bullish breakout of a resistance of the range and a daily
candle close above that will provide a strong trend-following bullish signal.
An uptrend will most likely resume then.
2️⃣ #NZDUSD daily time frame 🇳🇿🇺🇸
A test of a historically significant major demand cluster triggered a strong
bullish reaction. The price violated a strong resistance and closed above that.
I think that the market will most likely continue growing.
3️⃣ #EURJPY daily time frame 🇪🇺🇯🇵
The pair is trading within a horizontal parallel channel.
With the absence of high impact fundamental news today,
I think that the market will most likely continue consolidating
and the price may retrace from the resistance.
4️⃣ #NASDAQ Index #US100 daily time frame 🇺🇸🇨🇭
Looks like the market is preparing to update the ATH.
A confirmed violation of a minor daily resistance and a valid
Change of Character on intraday time frames indicate clear
strength of the buyers.
I guess that 23700 level will be tested soon with its highly probable breakout.
Do you agree with my market breakdown?
❤️Please, support my work with like, thank you!❤️
I am part of Trade Nation's Influencer program and receive a monthly fee for using their TradingView charts in my analysis.

GBPUSD: Bullish Continuation Ahead?! 🇬🇧🇺🇸
GBPUSD violated a significant resistance cluster yesterday.
The market broke through that with a high momentum bullish candle.
Chances will be high that the pair will continue rising.
The next goal for the buyers is 1.35 psychological resistance.
❤️Please, support my work with like, thank you!❤️

BTCUSDT 111k first then UPHi fellow traders,
Here’s my current BTCUSDT view on the 4H chart, based on Elliott Wave principles.
After a corrective structure, we’ve seen a strong bounce, and price is now approaching a key area of interest. I’ve marked the zones I’m watching for potential buys and sells:
🟨 Lower box: Potential buy zone if price pulls back with a corrective structure.
🟨 Upper box: Area of interest for taking partials or looking for potential short setups, depending on how price reacts.
If momentum continues, we could see BTC pushing into the 125K region, which aligns with fib extensions from previous swings.
As always, I’m waiting for confirmation before making any entries.
Let me know what you see on your end!

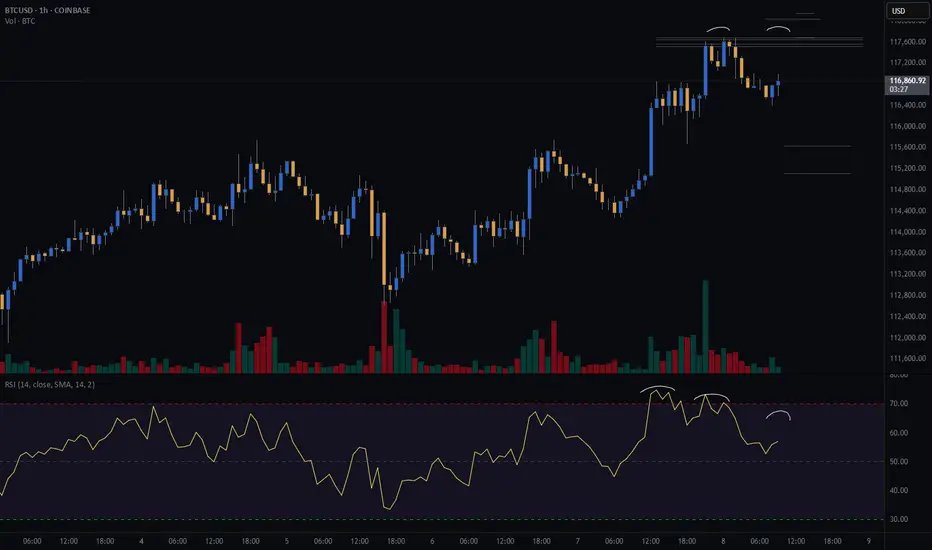
Bitcoin Bears Lining Up? My Short PlanBitcoin is flirting with a potential pullback, and I’ve got my eyes locked on this short setup.
The setup is a double top on the hourly chart.
📊 Risk/Reward: 3.7
🎯 Entry: 117 515
🛑 Stop Loss: 118 033
💰 Take Profit 1 (50%): 115 629
💰 Take Profit 2 (50%): 115 116
Seeing negative rsi divergence on the hourly chart, signaling slowing buying momentum.
I am looking for the hourly candle to close within the range drawn on the chart with lower volume.
I’ll be scaling out at TP1 and letting the second half ride if the bears get their way.
📅 Will today be the start of a deeper drop?
📍 I’m documenting my trades as part of my live trading journey – follow along to see how this one plays out and catch my next setups in real time.
Not financial advice – just my personal analysis.
MNDY Earnings Play — Strong Bullish Momentum Ahead of AMC**🚀 MNDY Earnings Play — Strong Bullish Momentum Ahead of AMC**
Monday.com (MNDY) shows powerful fundamentals with 30% revenue growth and a perfect 8-quarter earnings beat streak. Options flow and technicals align for a potential explosive move post-earnings on **2025-08-08 (After Market Close)**.
**🔥 Key Stats:**
* Revenue growth: 30.1% TTM
* EPS consensus: \$3.70 (85% confidence in a beat)
* IV Rank: 75% (watch for IV crush post-earnings)
* RSI near 25 → oversold, setup for bounce
* Strong call volume at \$250 strike
**🛠 Trade Setup:**
* **Instrument:** MNDY
* **Direction:** CALL (LONG)
* **Strike:** \$250
* **Entry Price:** \$17.40
* **Profit Target:** \$52.00 (200-400% gain)
* **Stop Loss:** \$8.70 (50% premium cut)
* **Expiry:** 2025-08-15
* **Size:** 1 contract
* **Entry Timing:** Pre-earnings close
**⚠ Risk Management:**
* Position size max 2% portfolio
* Exit within 2 hours post-earnings to avoid IV crush and theta decay
---
**#MNDY #MondayDotCom #EarningsTrade #OptionsTrading #CallOptions #BullishSetup #PreEarnings #TechnicalAnalysis #RSI #IVRank #SwingTrade #TradingView #StockMarket #HighReward #RiskManagement**

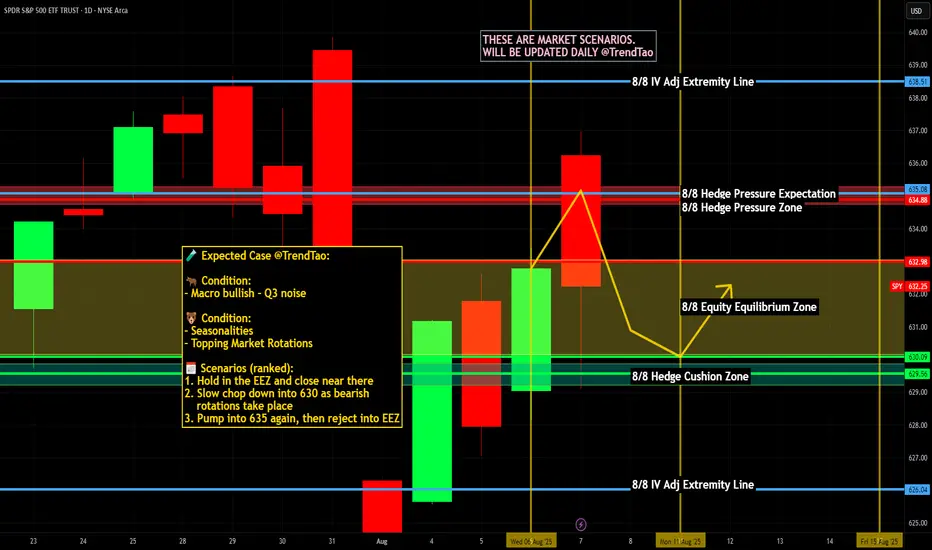
Nightly $SPY / $SPX Scenarios for August 8, 2025🔮 Nightly AMEX:SPY / SP:SPX Scenarios for August 8, 2025 🔮
🌍 Market-Moving News 🌍
🧾 Tariff Shock → Day 2 Positioning
Markets are still digesting the new tariff regime (10%–41% on broad imports) and the proposed 100% levy on imported semiconductors with carve-outs for firms investing in U.S. production. Expect continued dispersion: U.S.-capex-heavy names bid; globally exposed hardware, autos, and consumer electronics face margin risk until rules are clarified.
💬 Policy Signaling Risk
Fed speakers are leaning cautious on growth and inflation pass-through from tariffs; Bostic flagged skepticism that tariff-driven price effects fade quickly. Translation: don’t count on a rapid dovish pivot because of tariffs alone.
⛽ Energy & Positioning Into the Weekend
Oil beta in focus: Baker Hughes U.S. rig count (1:00 pm ET) and CFTC COT (3:30 pm ET) hit this afternoon—both can nudge energy, USD, and risk appetite into the close.
📊 Key Data Releases & Events 📊
📅 Friday, August 8, 2025
10:20 AM ET – St. Louis Fed President Alberto Musalem (remarks)
Market angle: watch for any tariff-inflation commentary and guidance on the path/timing of cuts.
1:00 PM ET – Baker Hughes U.S. Rig Count
Reads on drilling activity; oil services beta and crude sentiment.
3:30 PM ET – CFTC Commitments of Traders (weekly)
Positioning update across futures/FX; risk heading into next week.
(No major Tier-1 U.S. macro prints scheduled today; next CPI is Tuesday, Aug 12.)
Bureau of Labor Statistics
⚠️ Disclaimer:
Educational info only, not financial advice. Do your own research.
📌 #trading #stockmarket #economy #Fed #tariffs #chips #energy #rigcount #COT
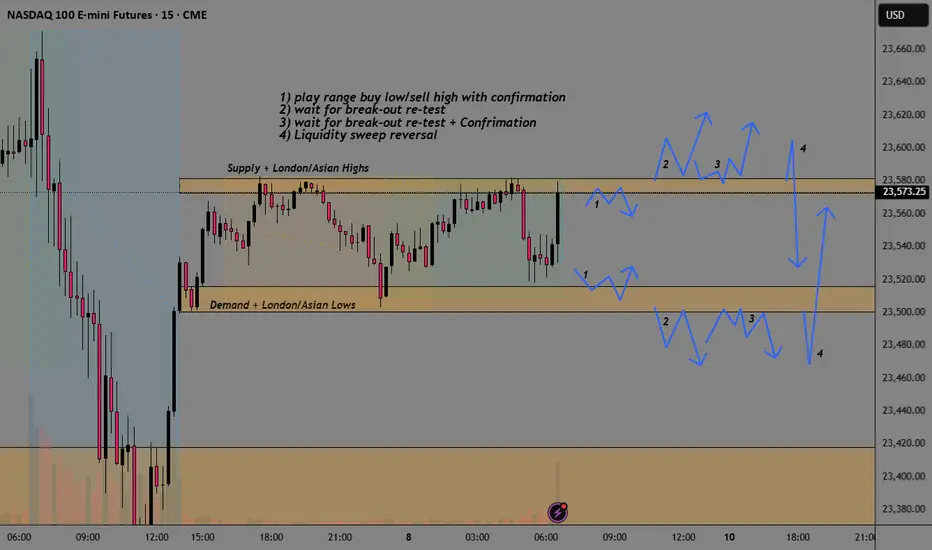
NQ Break-Out AnalysisSee chart from analysis of different options depending on the type of trader and what others are looking at.
1) play range buy low/sell high with confirmation
2) wait for break-out re-test
3) wait for break-out re-test + Confirmation
4) Liquidity sweep reversal
ENA Breakout Alert – Red Resistance Cleared! 🚨 MIL:ENA Breakout Alert – Red Resistance Cleared! 🔴✅
MIL:ENA has finally broken out of the red resistance zone.
📊 This breakout signals bullish momentum with potential for further upside.
🔥 Buyers stepping in strong —

FIGMA Grabbing Liquidity!!!
## ⚠️ FIG Swing Short Setup (2025-08-08) ⚠️
**Bias:** 📉 **Strong Bearish** — heavy put flow, weak trend, no momentum support.
**🎯 Trade Plan**
* **Ticker:** \ NYSE:FIG
* **Type:** PUT (SHORT)
* **Strike:** \$75.00
* **Entry:** \$4.80 (watch open, avoid chasing)
* **Profit Target 1:** \$7.20 (+50%)
* **Profit Target 2:** \$9.60 (+100%)
* **Stop Loss:** \$2.88 (-40%)
* **Expiry:** 2025-08-15
* **Size:** 1 contract
* **Confidence:** 75%
**📊 Key Notes**
* **C/P Ratio:** 0.45 → bearish options flow ✅
* Institutional bias heavily short ✅
* Trend falling, multi-timeframe returns flat ❌
* Volume: average — no strong push yet ⚠️
* Watch \$80 resistance for rejection trigger 🚨

Heating oilHeating Oil BUY CALL Chart explains SL TP EP
Putting It All Together: Heating Oil “Buy Call” Setup
Technical View Fundamental Support Trade Rationale
Falling wedge suggests reversal Seasonal demand + diesel shortage Bullish bias if breakout confirmed
Bottom Line
The falling wedge pattern in Heating Oil, supported by robust technical buy signals and seasonally supportive fundamentals, presents a compelling bullish opportunity—especially if a breakout is confirmed with strong volume. Just be mindful of macroeconomic and supply-side risks that could blunt momentum

BTC Breakout: 119,800 to clear, 123,218 in sight__________________________________________________________________________________
Market Overview
__________________________________________________________________________________
Momentum: 📊 Consolidation range below 119,800–123,218, primary trend still 📈 bullish; buyers defending 116,100–114,723.
Key levels (TF):
- Resistances: 117,800–118,600 (6H/4H supply); 119,800 (720 PH); 123,218 (D Pivot High).
- Supports: 116,100 (6H/2H); 115,720 (240 PH); 114,723 (D Pivot Low); 112,600 (240 PL); 111,980 / 98,200 (W Pivots).
Volumes: Normal across TF → no “Extreme Volumes” (need confirmation on breakouts).
Multi-timeframe signals: HTF 1D/12H/6H/4H = Up; 2H = Down; 30m ISPD = Sell (LTF divergence).
Risk On / Risk Off Indicator context: Neutral → no sector-wide directional bias.
__________________________________________________________________________________
Trading Playbook
__________________________________________________________________________________
Global bias : Slightly 📈 bullish above 115,720/114,723; swing invalidation on a close < 114,723.
Opportunities:
- Buy pullback 116,100–115,700 toward 117,800/118,600/119,800.
- Bullish breakout: acceptance 1D/12H > 119,800 → target 123,218.
- Tactical short: clean rejection 117,800–118,600 while 2H = Down and 30m ISPD = Sell.
Risk zones / invalidations:
- Intraday longs: close < 115,700.
- Swing longs: close < 114,723 (risk 112,600 → 111,980).
- Shorts: LTF close > 118,600; structural: acceptance > 119,800.
Macro catalysts (Twitter/News):
- US pro‑crypto tilt (debanking review, retirement/PE/crypto access, Fed nominee) → sentiment tailwind.
- Softer USD (BOE hawkish cut, Fed pick) → positive for risk/BTC.
- US rates (30Y auction, yields) → a yield spike would weigh on breakouts.
Action plan:
- Pullback Buy: Entry 115,900; Stop 114,650; TP1 117,800, TP2 118,600, TP3 119,800 → R/R ~2.0–2.8.
- Breakout Setup: Enter on RP 119,800–119,400 after 1D/12H close > 119,800 + volume; Stop 118,500; TP1 121,800, TP2 123,200, TP3 (runner) → R/R ≥2.0.
- Tactical Short: Entry 118,200; Stop 118,700; TP1 116,600, TP2 116,100, TP3 115,700 → R/R ~1.6–2.5.
__________________________________________________________________________________
Multi-Timeframe Insights
__________________________________________________________________________________
1D/12H/6H/4H (Up): Bullish structure consolidating below 119,800; support cluster 115,720–114,723 holding; key setups = buy pullbacks + confirmed breakout > 119,800 toward 123,218.
2H (Down): Lower highs below 118,000; 117,800–118,600 supply favors tactical fades; needs flip > 118,600 to push 119,800.
1H/30m/15m (Up, with 30m ISPD = Sell): Sub‑range 116,100–117,900; buy scalps at 116,400/116,100; caution buying into 117,900–118,600 (rejection risk).
Key divergences: HTF Up vs 2H Down + 30m ISPD Sell → higher odds of false breaks below 118,600/119,800.
__________________________________________________________________________________
Macro & On-Chain Drivers
__________________________________________________________________________________
Macro events:
- US pro‑crypto stance (debanking review, retirement/PE/crypto access, Fed nominee) → better access/regulatory tone (Twitter sources).
- Gold tariffs/repricing narrative → reinforces “digital gold”.
- Softer USD and easing inflation impulses → support risk; watch long-end yields.
Bitcoin analysis:
- Technical: testing the upper bound of a rising wedge, momentum improving.
- Institutional/access: treasury/banking initiatives may support participation.
- Energy/valuation: Bitcoin Energy Value ~145,000 vs spot ~116,000 → implied discount.
On-chain data:
- Post‑ATH indecision; “air gap” 110,000–116,000.
- STH in profit ~70% → fresh demand needed.
- ETFs: ~−1,500 BTC outflow recently (risk if it persists).
- Funding <0.1% → moderate leverage, less immediate squeeze.
- On‑chain pivot ≈ 116,900 to reclaim; 119,800 critical for confirmation.
Expected impact:
- Friendlier macro + balanced on‑chain favor a cautiously bullish technical bias, but confirmation requires acceptance above 119,800 with volume.
__________________________________________________________________________________
Key Takeaways
__________________________________________________________________________________
- Overall bias: cautiously 📈 bullish in a range; buy dips at 116,100–115,700; swing invalidation below 114,723.
- Top setup: confirmed breakout > 119,800 with volume to target 123,218; otherwise fade 117,800–118,600.
- Macro: US pro‑crypto tone and softer USD support BTC, but monitor UST yields.

Gold on the Rise: A Breakthrough Forecast That's Hard to Stop!XAUUSD is trading within an ascending channel, recently bouncing off the support zone around 3,360 USD and heading towards higher levels. The price structure maintains higher highs and higher lows, indicating that the bullish trend is likely to continue.
Weak U.S. employment data and a rise in unemployment claims have fueled expectations that the Fed will cut interest rates in September, weakening the USD and making gold more attractive. Analysts predict that gold could reach higher levels due to concerns over slow growth in the U.S. and the weakening of the USD. Additionally, trading volumes for gold have surged, indicating strong investor interest. Geopolitical tensions are also increasing gold's appeal as a safe-haven asset.
Gold is currently testing resistance around 3,400–3,425 USD, and if it breaks through, the bullish trend could continue towards 3,500 USD.

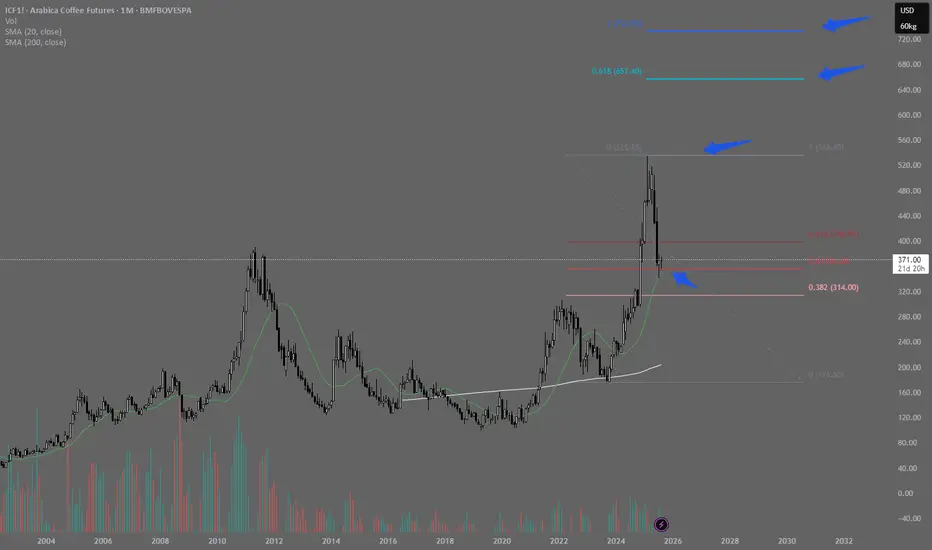
Correction Over? Coffee May Be Ready for Another Rally!After a strong rally and moving far from its moving averages, coffee futures have started a healthy and expected pullback.
As we can see, the 20-period moving average (green) stands out as a strong support level and a potential target for those who sold near the top — whether for a partial profit-taking (expecting a deeper correction) or a full exit.
The candle formed right on the 20MA clearly reflects this dynamic: positions being closed by some traders and opened by others.
This price zone offers a good buying opportunity, with a tight stop and a long target in favor of the prevailing uptrend.
The trade symmetry is favorable, further reinforcing interest in this region.
Initial targets would be the previous high, and if that level is broken, the Fibonacci projections for more ambitious upside moves.
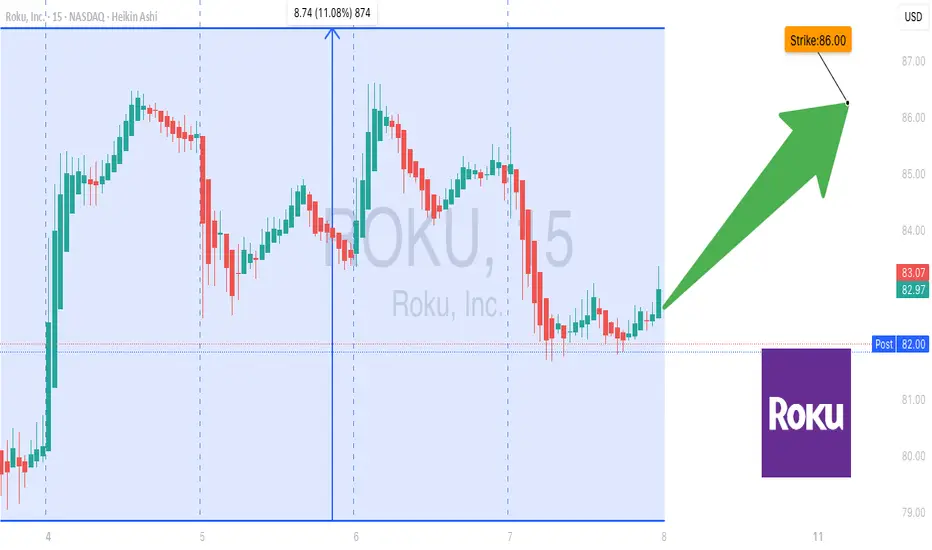
ROKU Call Alert: Cheap Options, Big Upside?🚨 ROKU Options Alert (Aug 6) – Bullish Breakout or Bull Trap?
📉 **Daily RSI < 45** → Bears in control
📈 **Weekly RSI Rising** → Bulls not giving up
📊 **Heavy Volume on Red Candle** = Institutional Selling?
💥 **Call/Put Ratio Spikes** → Speculators loading calls
⚠️ **High Gamma Risk** (Only 2DTE) = Fast & Furious Moves Incoming
---
### 🤖 What the AI Models Say:
**🔵 Grok/xAI** → ⚖️ *Moderate Bullish*
✅ Institutional Buying
✅ Favorable Volatility
📢 Suggests \$86 CALLs
**🔴 DeepSeek / Claude** → *No Trade*
⚠️ Daily RSI bearish
⚠️ Heavy distribution
🛑 Too risky this week
---
### 🧠 Summary: Mixed Signals = Cautious Bulls
Despite bearish momentum, **options flow screams bullish**. Risk-reward favors a speculative long — **only with tight stops**.
---
### 💰 Suggested Trade
**ROKU \$86 CALL** expiring **Aug 8**
📥 **Entry**: \$0.85
📈 **Profit Target**: \$1.30 (50%)
🛑 **Stop Loss**: \$0.51
🔒 **Confidence**: 65%
⏰ **Entry Timing**: At Open
---
### ⚠️ Key Risk:
Market tug-of-war between **institutional sellers vs. retail bulls**.
Only trade if you can manage fast-moving positions. 🔄
---
💬 Drop a 🚀 if you’re entering — and follow for more AI-driven trades!