OIL INDIA BUY VIEW OIL INDIA - BUY PROJECTION
Trade Setup :
Fundamental Analysis
Stock PE - 9.22
Industry PE - 20.7
Low Debt
Promoter Holding - 53 %
DII Holdings - 17 %
Regularly Paid Dividend - 2 %
Strong Fundamental - Stock Possible to Doubled - (Current - 474 ) (Target - 948 )
for Long term 5 years Holding ..
Technical Analysis
Monthly - Strong Support & Fib 50 %
Day - Wait For Candle Close in Black Line
Entry - 507 Rs
Target - 740 Rs
Stoploss - 408 Rs
Happy trading .. Thank You ...
Technical Analysis

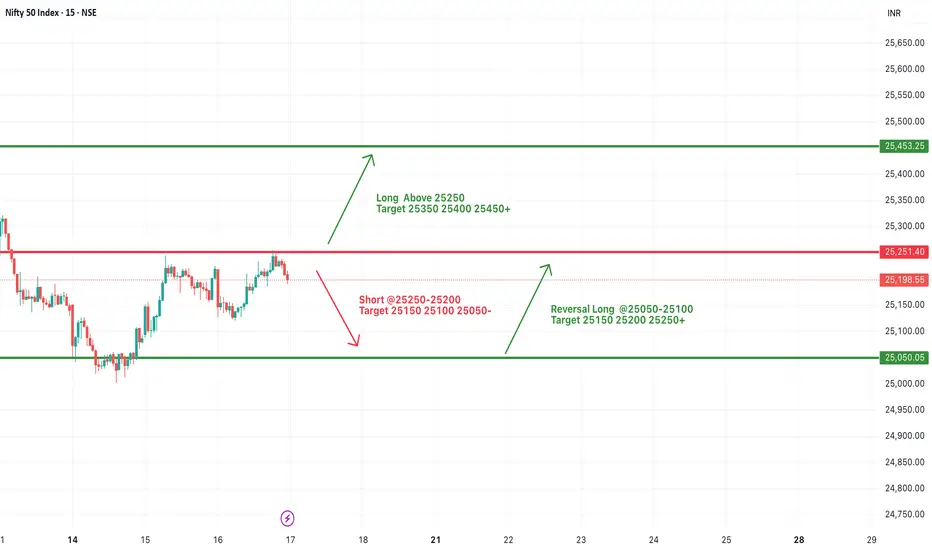
#NIFTY Intraday Support and Resistance Levels - 17/07/2025Opening Expectation: Slight Gap-Up Around 25200
Nifty is likely to open slightly gap-up near the 25200 level, showing early signs of strength. If the index manages to sustain above the 25250 level, we may see a continuation of the upward momentum with targets around 25350, 25400, and 25450+. This zone marks the upper resistance, and a breakout with strong volume could push prices into a bullish trend for the session.
On the other hand, if Nifty faces rejection around 25250–25200 and begins to slide, a short opportunity opens up with downside targets at 25150, 25100, and 25050. Sustained weakness below these levels could intensify selling pressure. However, in case the index reverses and bounces from the 25050–25100 zone, a quick intraday long trade can be considered toward 25150, 25200, and 25250+.
Today’s bias remains slightly positive, but the session may remain volatile between key levels. Traders should focus on price action around the 25250 resistance and use trailing stop losses with strict risk control.
[INTRADAY] #BANKNIFTY PE & CE Levels(17/07/2025)Bank Nifty is expected to open slightly gap-up near the 57100 zone. This level is a key intraday pivot. If the index sustains above 57100, it could trigger upward momentum toward the next resistance levels at 57250, 57350, and potentially 57450+. A move beyond 57550 will likely strengthen the bullish sentiment and may stretch the rally further toward 57750, 57850, and 57950+.
On the downside, if Bank Nifty fails to hold 57050–57100 and slips below 56950–56900, it may invite selling pressure, with potential downside targets at 56750, 56650, and 56550. This zone acts as short-term support, and failure to hold here could lead to further weakness.
Overall, Bank Nifty is currently in a range with bullish bias above 57100.

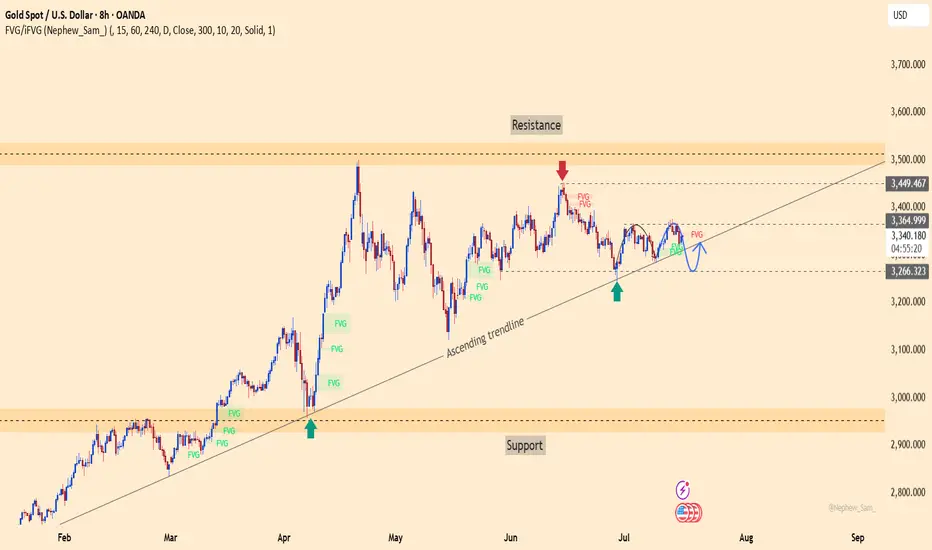
xauusd – is gold coiling up for a breakout?After multiple retests of the ascending trendline since March, gold (XAUUSD) continues to hold a solid bullish structure. While it hasn’t decisively broken through the 3,366 resistance, price action suggests that buyers are still in control. The repeated appearance of FVG zones signals smart money accumulation beneath the surface.
On the news front, U.S. PPI data came in at a 0.2% increase — exactly in line with expectations. This neutral result hasn’t given the USD a strong push, which may allow gold to maintain or even inch higher in the short term.
As long as the 3,265 support zone holds, the path remains open for a move toward the 3,449 target area. This might be the final consolidation before a powerful breakout. The question is: are you ready to ride the next leg up?
EURUSD – Weakness emerges at descending channel resistanceEURUSD remains within a well-defined descending channel and was recently rejected at the upper trendline – a key dynamic resistance zone. Price action shows the recovery is limited around 1.16600, with multiple FVG (Fair Value Gap) zones reinforcing the potential for further downside.
On the news front, the euro remains under pressure as Eurozone inflation data brought no surprises, while the US dollar is supported by June’s PPI rising exactly as expected at 0.2%. This combination leaves EURUSD with little momentum to break higher, making a move back toward the 1.15300 support area a scenario to watch.
If the price fails to break above 1.16600 and forms a lower high, the bearish trend will be further confirmed. Keep an eye on price behavior around the FVG zones to identify optimal entry points.

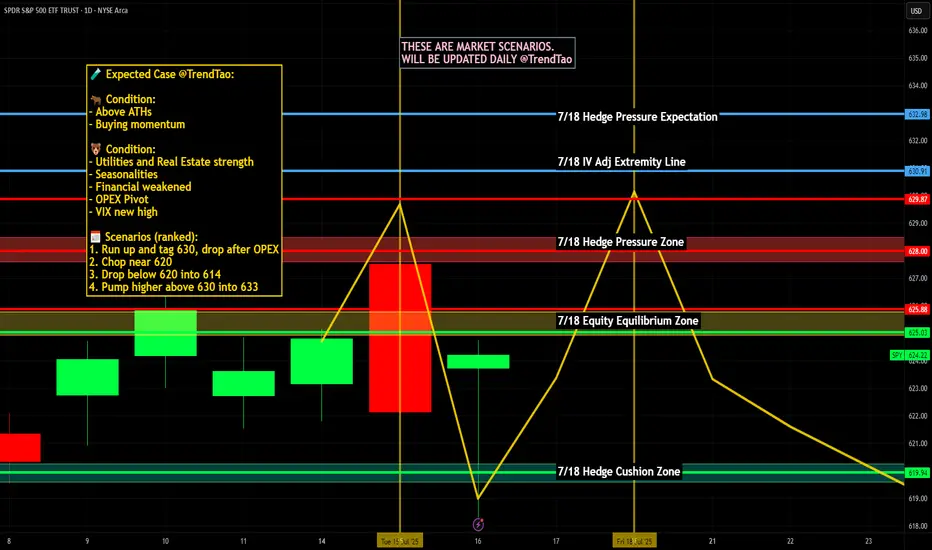
Nightly $SPY / $SPX Scenarios for July 17, 2025🔮 Nightly AMEX:SPY / SP:SPX Scenarios for July 17, 2025 🔮
🌍 Market-Moving News 🌍
🇮🇳 India–U.S. Inflation Divergence Dampens Dollar
India’s June retail inflation tumbled to a six-year low, while U.S. CPI hit its fastest pace since February—driven by tariff effects. This divergence is weakening the U.S. dollar against the rupee, pushing down dollar‑rupee forward premiums
📜 Treasury to Ramp Up T-Bill Issuance
Following the recent debt-ceiling increase, the U.S. Treasury plans to issue over $1 trillion in T-bills over the next 18 months. Money-market funds, flush with cash, are expected to absorb the supply, which could influence short-dated yields
💱 Dollar Eases Amid Fed-Related Volatility
Headline news that President Trump “highly unlikely” to fire Fed Chair Powell, coupled with stable PPI data, calmed markets. The dollar dipped slightly after earlier turmoil, while gold and bonds saw modest gains
📊 Key Data Releases & Events 📊
📅 Thursday, July 17:
(No major U.S. economic releases)
Markets will track T-bill issuance plans, dollar forward dynamics, and statements from the Treasury and Fed regarding debt and rate strategy.
⚠️ Disclaimer:
This is for educational purposes only—not financial advice. Consult a licensed financial advisor before making investment decisions.
📌 #trading #stockmarket #economy #dollar #tbills #inflation #Fed #technicalanalysis
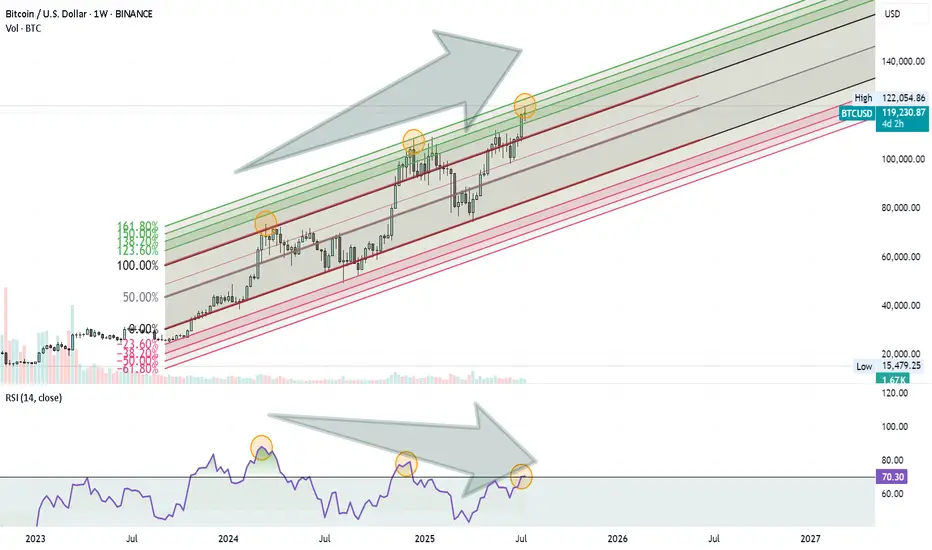
Bitcoin Rally Losing Steam?Bitcoin might be approaching a Turning Point . Here’s what I’m seeing on the weekly chart:
Price is moving inside an ascending Fibonacci channel.
It’s getting close to the 1.60 (160%) extension level, which has acted as a reversal zone before.
At the same time, the RSI is showing a clear negative divergence, suggesting that momentum is weakening.
These signs combined could mean we’re not far from a significant correction.
Nothing is confirmed yet, but it’s a setup worth keeping an eye on.
COIN -- Major Trendlines + Bearish Divergence = Breakdown?Hello Traders!
Today I have shared the chart of COINBASE. Of course we cant know for sure what price will do, however you can take clues and combine them to give you a high probability reading of the chart.
Here are the clues:
1) MAJOR TRENDLINE
2) TRENDLINE
3) BEARISH DIVERGENCE
4) BULL FLAG MEASURED MOVE
When we combine these clues, a very bearish picture is painted... This signals to me that there is a high probability price will likely reverse and trade to the downside in the near future.
I hope everyone enjoyed this post and is able to use it as an educational tool.
Thanks everyone and best of luck on your trading journey!

EUR/USD Technical Outlook Daily chart frame**EUR/USD has bounced from the S1 zone (\~1.1595–1.1575)**, chart analysis
**EUR/USD Technical Outlook**
**Current Price:** \~1.1618
**Recent Action:** Rejection from S1 zone, forming a potential base.
**Bullish Scenario (Active)**
The pair has bounced from key **S1 support** (1.1595 area), suggesting demand is present.
**If momentum holds:**
* **Immediate Target 1:** 1.1645 (Fibonacci + 21 EMA)
* **Target 2:** 1.1665–1.1685 zone (7 EMA + minor resistance)
* **Target 3:** 1.1725 (R1 zone and mid-July resistance)
* Breakout above R1 would shift momentum firmly bullish.
*Watch for bullish continuation candles and rising volume.*
**Bearish Risk (Still Possible)**
* If the bounce stalls near **1.1645–1.1665**, and the pair reverses:
* A drop back toward **1.1595–1.1575** support could occur again.
* Break below that zone would expose:
* **S2 support at 1.1510**
* Possibly extend to **1.1475** in case of stronger USD demand
Summary:
* **Bounce from S1** shows initial bullish strength.
* **Key resistance to break:** 1.1645–1.1685 for bullish continuation.
* **Key support to hold:** 1.1595–1.1575 to avoid deeper correction.

AUD/USD Technical Outlook: Rising Channel Faces Resistance Near The Australian Dollar remains in an upward-sloping channel against the U.S. Dollar on the daily timeframe. Price action has recently bounced from channel support near 0.6500, a key psychological and technical level, and is attempting to regain traction within the structure.
The 61.8% Fibonacci retracement of the July 2023 – April 2024 decline at 0.6558 is currently acting as resistance, coinciding with the upper half of the rising channel. A break above this could see momentum extend toward the 78.6% retracement zone near 0.6730.
The 50-day SMA is crossing above the 200-day SMA, forming a golden cross—typically a bullish continuation signal—though price is slightly below both moving averages, implying short-term indecision.
From an indicator perspective:
RSI hovers around 50, showing a neutral bias and confirming the consolidation phase.
MACD is flat and converging near the zero line, signaling weakening momentum and a possible pause or reversal.
A daily close below channel support could expose the 0.6450–0.6400 zone next, while sustained strength above 0.6558 could re-ignite bullish interest targeting the 0.6700–0.6730 region.
Overall, AUD/USD remains technically constructive as long as the channel holds, but traders should watch closely for a breakout or breakdown confirmation from current levels.
-MW

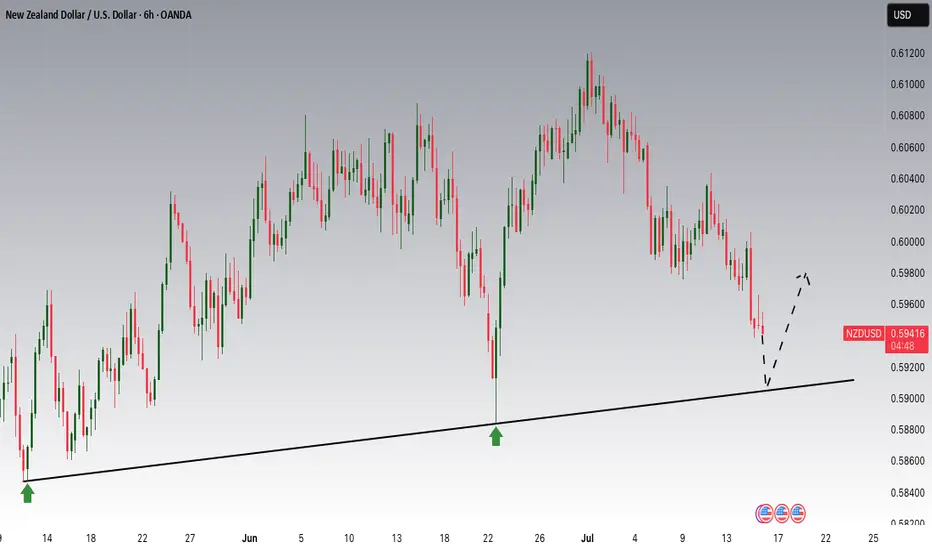
NZDUSD is Nearing an Important SupportHey Traders, in today's trading session we are monitoring NZDUSD for a buying opportunity around 0.59100 zone, NZDUSD is trading in an uptrend and currently is in a correction phase in which it is approaching the trend at 0.59100 support and resistance area.
Trade safe, Joe.
DXY Bullish Pennant (awaiting breakout)**1-hour timeframe** of the **US Dollar Index (DXY)** with technical analysis applied. Here's the breakdown:
**Technical Analysis Summary:**
**Current Price:**
* Around **98.08**, trading just under the **7 EMA (98.09)**.
**Bullish Structure:**
* A strong **bullish impulse leg** is visible (sharp green candle rally).
* Followed by a **bullish flag/pennant** pattern (marked in red), which is typically a **continuation pattern** in an uptrend.
* The flag is forming after a steep upward move — suggesting **consolidation before potential breakout continuation**.
**EMA Trend Support:**
* **EMA 7, 21, and 50** are aligned bullishly:
* EMA 7 > EMA 21 > EMA 50
* This supports the **short-term uptrend** structure.
**Support Zones:**
* A strong **demand zone** is marked between **97.50–97.70** (highlighted in red), where price previously consolidated before the breakout.
* EMA 50 also sits around **97.72**, reinforcing this as a strong **pullback support level**.
**Possible Scenarios:**
1. **Bullish Continuation:**
* If the price breaks above the flag resistance, it may **rally towards 98.70 → 99.00 → 99.10**.
2. **Bullish Pullback:**
* If price dips to retest the support near **97.80–97.90** or EMA 21, and holds, it may bounce and continue upward.
**Conclusion:**
* **Trend:** Bullish
* **Pattern:** Bullish Pennant (awaiting breakout)
* **Support:** 97.72–97.90
* **Upside Targets:** 98.70 → 99.00+
* **Outlook:** Positive bias continues **as long as price holds above the support zone** and EMAs.

Gold Bullish Momentum
📈 XAU/USD Gold Technical Analysis – Smart Money Concept Perspective
🕒 Timeframe: 1H | Date: July 16, 2025
Overview:
This analysis follows a Smart Money Concept (SMC) framework, focusing on market structure shifts, liquidity zones, and potential high-probability setups. Gold (XAU/USD) is showing signs of a possible bullish reversal after forming a clear accumulation zone near a significant low.
Key Highlights:
🔹 BOS (Break of Structure):
A bullish break of structure confirms a shift in momentum, indicating that the prior bearish trend might be weakening.
🔹 LL (Lower Low) and LH (Lower High):
The market previously formed a Lower Low, followed by a Lower High, maintaining bearish structure until the recent BOS occurred.
🔹 Accumulation Phase:
Price is consolidating in a defined accumulation range, suggesting smart money might be absorbing liquidity before a move higher. This zone may serve as the springboard for the next bullish leg.
🔹 Inducement:
An inducement zone lies just below the trendline support and accumulation range. It’s designed to trap early sellers before a bullish continuation.
🔹 POI (Point of Interest):
A key supply or mitigation zone lies around the $3,355.75 level. We expect price to move into this POI before reacting.
🔹 Target:
If price successfully clears the POI and confirms strength, the projected target is in the $3,375–$3,380 zone based on confluence from upper channel resistance and previous structure.
🔄 Forecast Path:
Short-Term Pullback: Price may dip slightly to mitigate the inducement zone near trendline support.
Bullish Breakout: Strong impulse toward POI.
Reaction from POI: Potential minor retracement before a continuation toward the target.
🧠 Market Psychology Insight:
This setup reflects smart money accumulation and manipulation at its core — inducing retail traders into short positions before a potential bullish move. Watch for confirmations like bullish engulfing candles or break of lower highs on smaller timeframes.
📌 Conclusion:
Gold is poised for a possible bullish move after showing accumulation and breaking bearish structure. The $3,328–$3,335 range is key for entries, with the $3,355 POI and $3,375+ as targets. Manage risk and wait for confirmation before entering trades.
💬 Let me know your thoughts or drop your own chart ideas below!
📊 #XAUUSD #Gold #SmartMoney #TradingView #Forex #TechnicalAnalysis #SMC #PriceAction

Exide Industries Ready for the Next Bull Run !! Powering Up !!there are two chart of Exide Industries.
In a first chart: EXIDEIND is moving in a well defined parallel channel and currently trading near at support 365-375 range
In the second chart,EXIDEIND is respecting support at both the monthly pivot and the supertrend indicator, with the support zone positioned between ₹365-₹370.
EXIDEIND is currently sustaining below both the monthly and weekly pivot levels at ₹290. As long as the stock does not break above this pivot zone, the momentum is expected to remain weak.
If this level is suatin then ,we may see higher prices in EXIDEIND.
Thank you !!

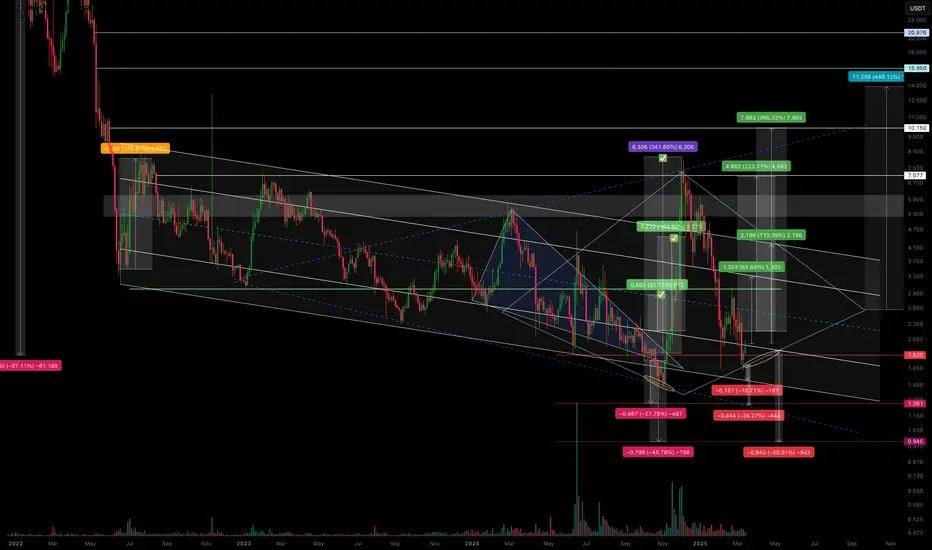
CVX/USDT – Is the scenario repeating? Continuing to work.The previous trading idea has played out with 3 out of 4 marked zones reached.
We saw a false breakout from the descending channel, followed by a pullback in line with the overall market—returning to the channel’s support zone.
I’ve noticed a potential formation of either a diamond pattern or an expanding triangle, but we’ll see how it plays out further.
Regarding declines and support zones:
-10.71% drop to the support of the descending channel.
-26.27% drop to the anticipated support of the expanding triangle.
-50% drop, likely as a squeeze under extremely negative news.
Regarding growth and resistance zones:
+65% rise to the resistance of the internal channel.
+110% rise to the resistance of the external channel (and if a diamond pattern forms, then its boundary).
+246% rise as a second attempt to break out of the descending channel.
+440% rise as a potential realization of diamond pattern pricing (if it forms).
All of this should be factored into your trading strategy, even the less likely scenarios.
I'll share the execution of the previous trading idea in my TG. I've also marked it on the chart.
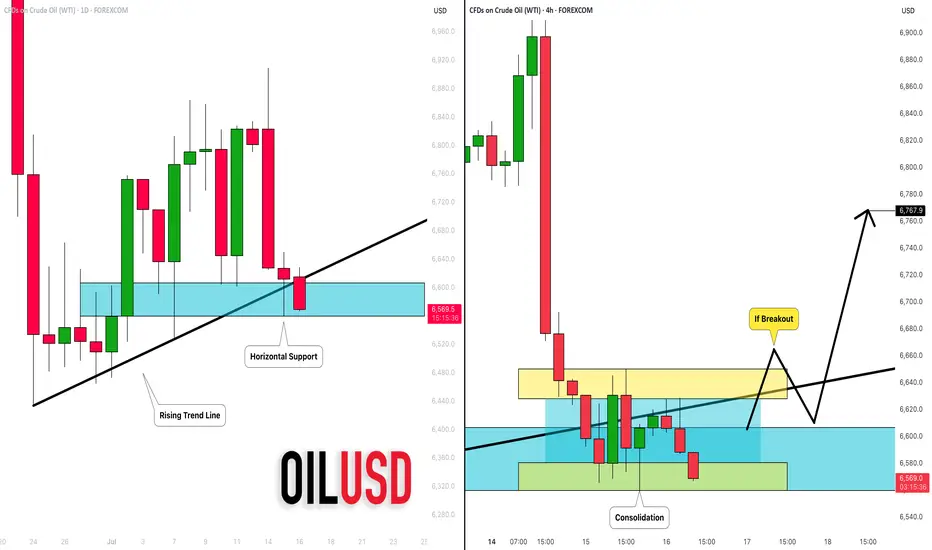
CRUDE OIL (WTI): Your Trading Plan Explained
Do not forget that today we expect Crude Oil Inventories data
release - it will be 10:30 am NY time.
Ahead of this news, the market is testing a significant daily support cluster
that is based on a rising trend line and a horizontal structure.
You signal to buy will be a bullish breakout of a minor intraday
horizontal resistance on a 4H.
4H candle close above 66,5 will be your confirmation.
A bullish continuation will be expected to 67.6 then.
I suggest waiting for the news release first and then check how
the market prices in the news. If our technicals align with fundamentals,
it will provide an accurate setup.
Alternatively, a bearish violation of a blue support will push the prices lower.
❤️Please, support my work with like, thank you!❤️
XAUUSD Analysis : Gold's Bullish Comeback + Target📊 Chart Overview:
Gold has shown a technically strong structure on the 4-hour time frame, respecting multiple layers of support, while slowly shifting momentum in favor of buyers. What stands out most in this chart is the parabolic curve formation at the bottom, labeled the "Black Mind Curve Support" — a key psychological zone that has guided price action back to the upside.
Let’s walk through the key elements and why this current setup deserves your attention:
🧠 1. Black Mind Curve Support – Bullish Base Formation:
This curved structure at the bottom is no ordinary pattern. It reflects gradual accumulation and buyer dominance, often seen in textbook rounded bottom formations. The market printed multiple higher lows along this curve, suggesting a deliberate and patient entry by smart money.
Whenever price touched this curve, it found strong demand — a clear sign that the bulls are defending their territory.
🧱 2. Channel Support + SR Interchange – Historical Demand:
Zooming into the left side of the chart, you’ll notice how price dropped into a converging zone where a descending channel support intersected with a historical support/resistance (SR) level. This confluence created a high-probability buy zone — the very origin of the current bullish wave.
This channel breakout also represents a structural shift, marking the beginning of bullish control.
🔁 3. Major SR – Interchange Zone:
One of the most critical areas in this chart is the Major SR Interchange zone, where former resistance was broken and later retested as support. This is a classic support-resistance flip — the type of zone institutional traders watch closely.
This level currently acts as a launchpad for bulls, reinforcing bullish structure and offering low-risk long opportunities when respected.
⚔️ 4. Minor BOS (Break of Structure):
Recently, the price broke above a short-term lower high, indicating a minor bullish break of structure. This is confirmation that momentum has shifted in the short term. Such BOS events are powerful signals, especially when backed by curve support and SR flips.
This also paves the way for the price to push into the next liquidity pocket above.
🧭 5. Central Zone – 50% Equilibrium:
The horizontal line drawn around the $3,330 level marks the central 50% zone — the midpoint of this entire price range. This acts as a natural equilibrium zone where buyers and sellers usually fight for control.
Price is now trading above this zone, giving the upper hand to bulls. Holding above the 50% line increases the probability of continuation to higher resistance levels.
🧨 6. Target Area – "Next Reversal Zone":
Looking ahead, the $3,370 – $3,380 range is labeled as the Next Reversal Zone. This is where sellers previously stepped in and rejected price hard. However, if momentum remains strong and bulls can push price into this zone again, we might witness either:
A sharp pullback (if bearish reaction occurs), or
A major breakout above toward the $3,400 key resistance (if buyers overpower).
This is the zone to watch for either short-term profit taking or potential trend continuation setups.
📌 Key Technical Levels:
Immediate Support: $3,330 – $3,315 (Central + Retest Zone)
Major Support: $3,290 (Mind Curve Base)
Short-Term Resistance: $3,370 – $3,380 (Reversal/Reaction Zone)
Bullish Continuation Target: $3,400+
📒 Conclusion & Strategy Insight:
This chart presents a textbook bullish reversal setup with clean structural progression:
Price formed a rounded base
Broke out of previous range resistance
Retested multiple key SR zones
Now targeting liquidity above
The bulls are in control as long as the price remains above the curve and the major SR zone. A retracement into $3,330 could offer an ideal long entry, targeting the $3,370–$3,380 zone with tight risk.
✅ Suggested Trading Approach:
Buy Opportunities: On pullbacks toward $3,330–$3,315 with confirmation
Sell Watch: Near $3,375–$3,380 if bearish divergence or strong rejection appears
Invalidation: Break and close below $3,290 curve support
🧠 Final Thoughts:
Gold continues to build a strong bullish base. The parabolic nature of the support curve suggests rising demand. As long as support holds, the bulls may take price to fresh highs in the coming days.
Keep an eye on how price behaves around the Next Reversal Zone — that will reveal whether this bullish rally is ready for a breakout or a cooldown.

DENTA – SMC & Breakout Structure Analysis (Jul 2025)Accumulation/Distribution: Long consolidation near ₹270–₹311
Break of Structure (BOS): Trendline breakout + recent close above prior top
Neutral toward Bullish: Awaiting volume and price action confirmation to validate trend shift
1. Defined Range Structure
Support ~₹270 (red line) holding over 4+ months
Resistance ~₹311–₹315 (blue line) tested multiple times before today
2. Possible Breakout Attempt
Price has breached the descending trend line—an early mark of bullish structure shift
Close is marginally above resistance, but lacks volume confirmation for breakout validation
3. Volume & Confirmation
No substantial volume spike yet—breakouts typically require accompanying volume
Watch for multi-session closes above ₹315 with sustained volume to support continuation
4. Pullback as an Opportunity
Retracing into ₹305–₹310 could form a higher-low
Such a move would align with healthy trend behavior, offering clearer structure and stronger validation

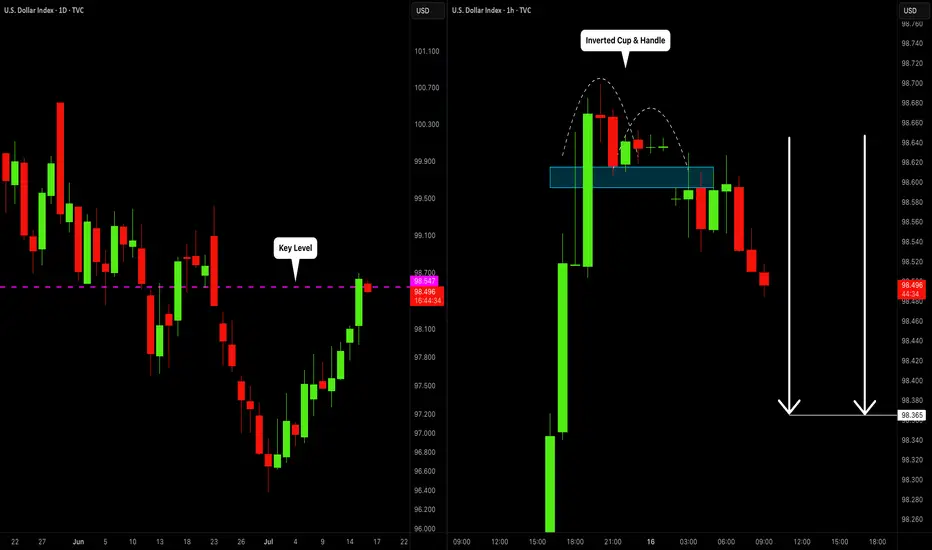
DOLLAR INDEX (DXY): Bearish Move From Key Level
I think that Dollar Index may drop from a key daily horizontal resistance level.
As a confirmation, I spotted an inverted cup & handle pattern on an hourly time frame
and a bearish violation of its neckline.
The market will most likely continue falling at least to 98.36
❤️Please, support my work with like, thank you!❤️
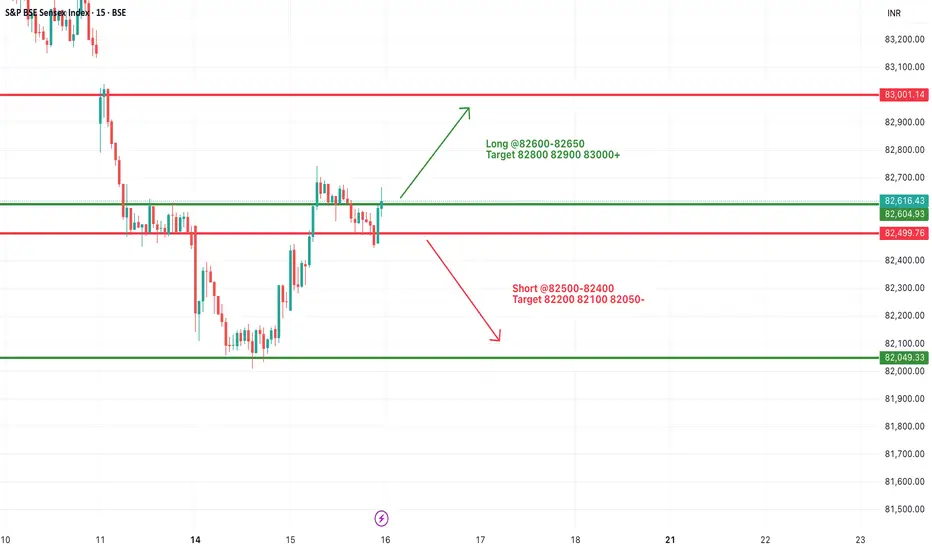
#SENSEX Intraday Support and Resistance Levels - 16/07/2025Sensex is expected to open flat near the crucial 82600–82650 resistance zone, which has acted as a turning point multiple times recently. A sustained move above this range may trigger bullish momentum toward 82800, 82900, and even 83000+. This move would indicate a positive continuation after the recovery seen from recent lows.
However, if the index faces rejection around 82600–82650, it may once again slip below 82500, opening the door for short-side opportunities with targets at 82200, 82100, and 82050. This region has seen a lot of price action over the last few sessions, so volatility may be higher.
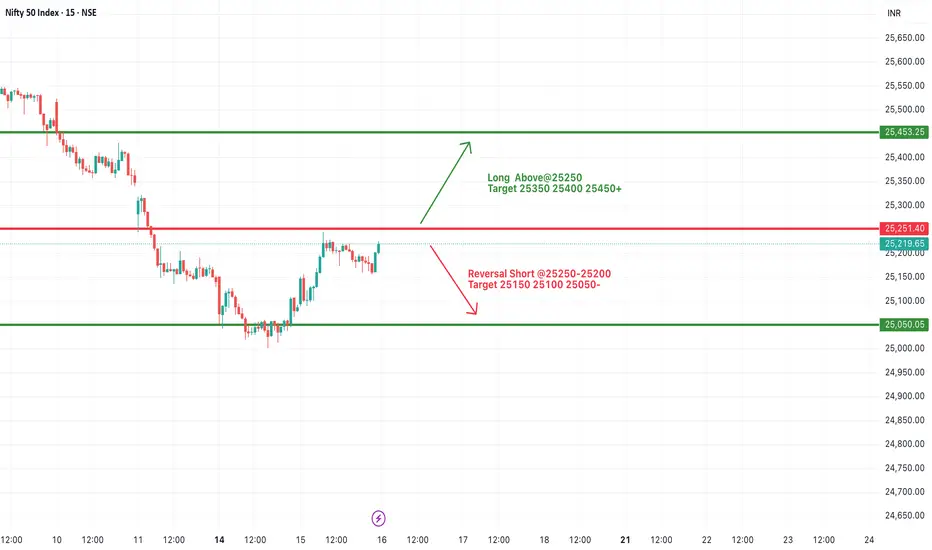
#NIFTY Intraday Support and Resistance Levels - 16/07/2025Nifty is likely to open flat near the 25200 mark, with the index currently hovering just below a key resistance zone of 25250. A decisive breakout above 25250 may provide momentum for a further upside rally toward 25350, 25400, and possibly 25450+. This level has acted as resistance in the past, so sustaining above it will be crucial for any bullish continuation.
On the flip side, 25250–25200 is also a potential reversal zone. If Nifty fails to break and sustain above it, then sellers may take control, and the index could see a pullback toward the immediate support levels of 25150, 25100, and 25050.
Since the index is near a crucial breakout/rejection point, early session price action will determine the direction.
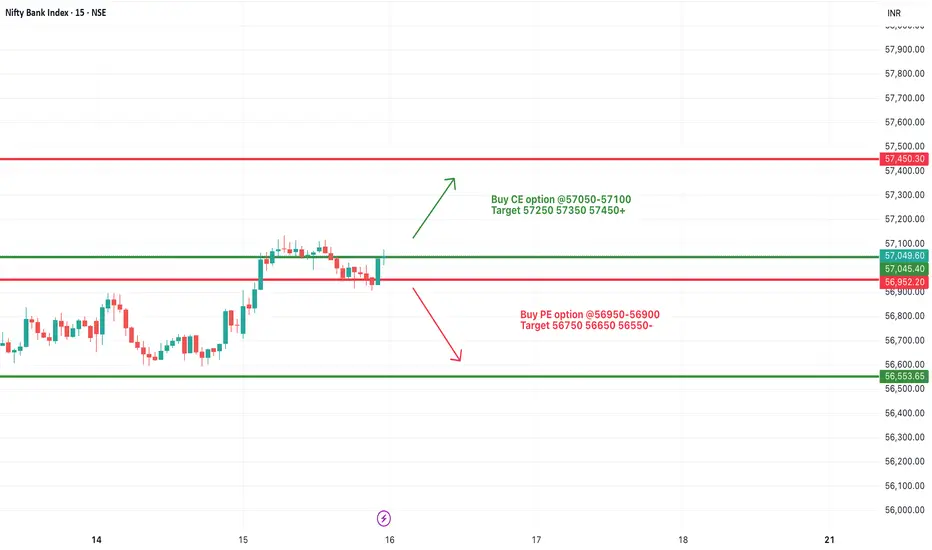
[INTRADAY] #BANKNIFTY PE & CE Levels(16/07/2025)Bank Nifty is expected to begin the day on a flat note near the 57000 mark, indicating indecisiveness after the previous session's recovery. The immediate resistance zone lies between 57050 and 57100. A sustained move above this level can trigger an upward continuation toward the targets of 57250, 57350, and possibly 57450+. This zone will be key for bullish momentum, and traders can look for strength confirmation around this breakout.
On the downside, the 56950–56900 level is crucial. If Bank Nifty slips below this zone, it may invite fresh selling pressure, with intraday downside targets around 56750, 56650, and 56550. The support at 56550 and below can act as demand zones for any pullback.
GBPJPY – Eyeing new highs as bullish structure holdsGBPJPY continues to trade within a steady ascending channel and has recently bounced from short-term support around 198.200. If price breaks above 199.400, bullish momentum could strengthen, targeting the previous high near 200.800 — a key resistance zone that has been rejected before.
From a fundamental perspective, expectations that the Bank of England will maintain high interest rates to combat inflation are supporting the pound. Meanwhile, investor sentiment remains cautious toward the yen following dovish signals from the Bank of Japan. If upcoming UK economic data is positive, GBPJPY may continue climbing in the sessions ahead.
