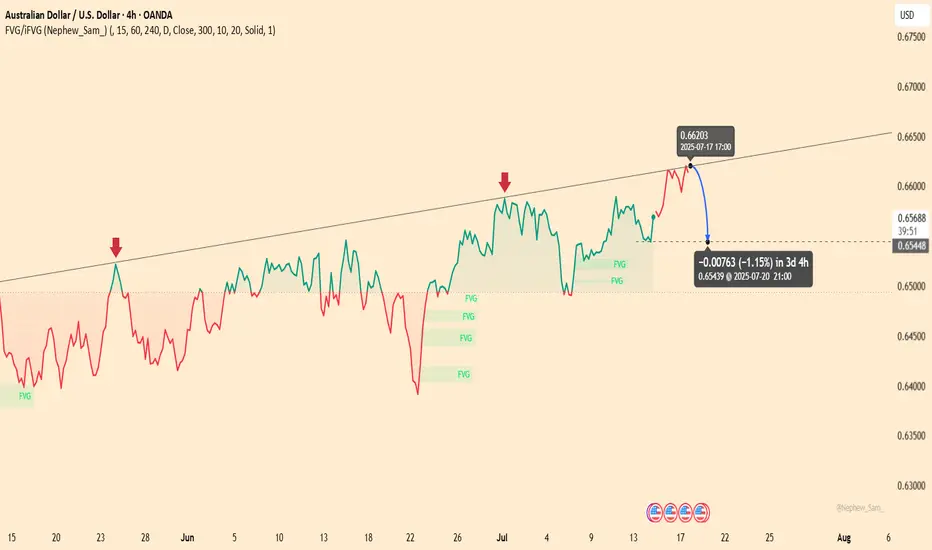
AUDUSD – Mild rebound, downside risk aheadAUDUSD is approaching a key trendline resistance after a short-term recovery. However, repeated rejections at this level in the past suggest a potential reversal is forming. The current structure mirrors previous setups – a mild rally into the trendline followed by weakness.
On the news front, recent U.S. economic data has supported the dollar, particularly stable job numbers and consumer confidence. Meanwhile, the market is awaiting the upcoming FOMC meeting minutes and Australia’s CPI report. Without a surprise boost from AUD fundamentals, the pair could face renewed downward pressure in the coming sessions.
Technical Analysis
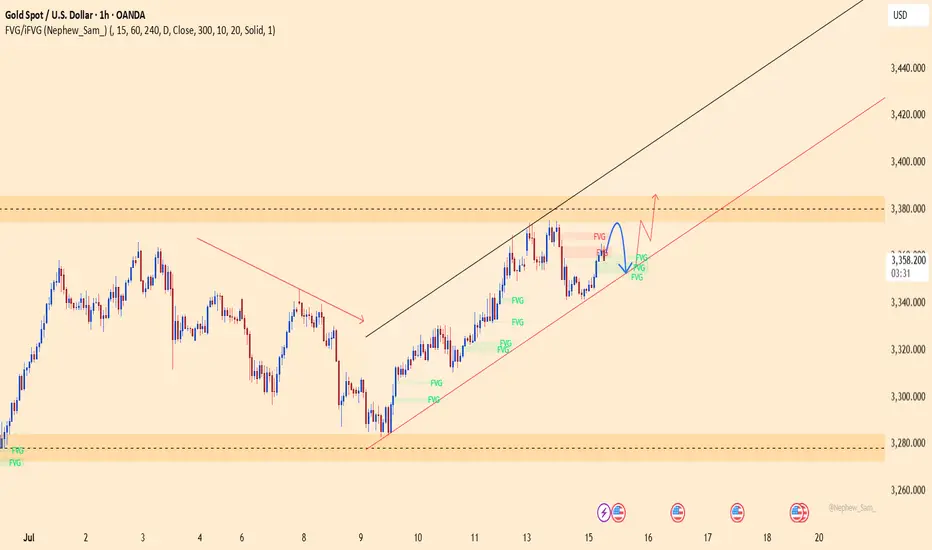
Gold set to surge? XAUUSD is holding firmly within a clear ascending channel on the H1 chart. After a strong rally, price is showing signs of a minor pullback toward the trendline support – potentially the last chance for buyers before gold accelerates toward the upper resistance zone.
On the news front, lower-than-expected U.S. producer inflation data has weakened the dollar, increasing gold’s appeal as a safe haven. In the coming days, key economic events like retail sales and comments from the Fed could serve as catalysts for the next bullish leg.
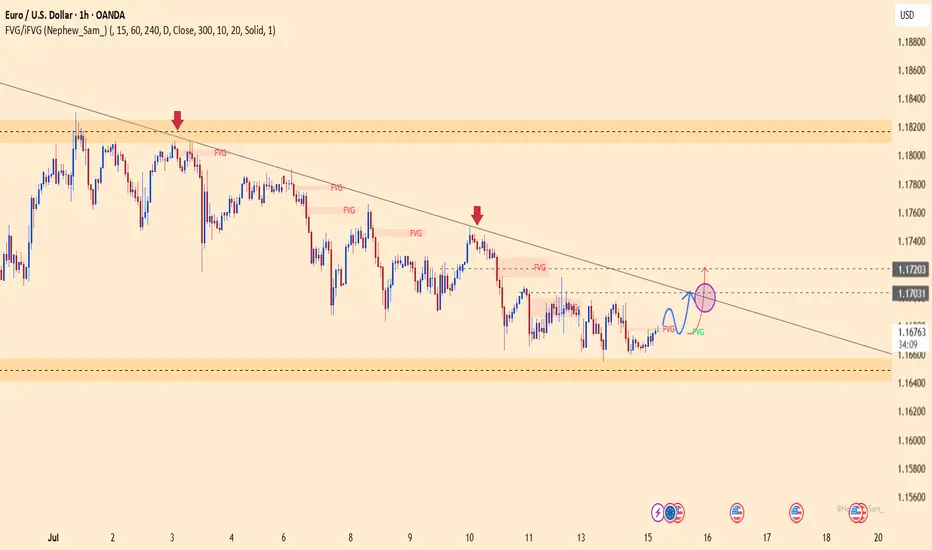
EURUSD – Bullish Momentum ReturnsEURUSD is gradually breaking free from downward pressure as it breaches the short-term accumulation structure, aiming for the resistance zone around 1.1720. On the chart, a clear bullish trend is emerging, supported by FVG signals reinforcing the recovery.
On the news front, expectations are rising that the European Central Bank will maintain a tighter policy stance for longer, as core inflation in the Eurozone remains elevated. Meanwhile, the USD is under corrective pressure following last week’s lower-than-expected U.S. CPI data. Upcoming statements from ECB and Fed officials today will be key in determining the next move for this currency pair.
Unless a surprise arises from the U.S. side, EURUSD is likely to sustain its short-term upward momentum and test the next technical resistance area.
Nightly $SPY / $SPX Scenarios for July 16, 2025 🔮 Nightly AMEX:SPY / SP:SPX Scenarios for July 16, 2025 🔮
🌍 Market-Moving News 🌍
📈 Record Bullish Sentiment Signals Rotation
Bank of America reports the most bullish fund-manager sentiment since February. With 81% expecting one or two Fed rate cuts this year, the group sees a rotation strategy replacing outright selling, with investors tipping toward sector shifts over wholesale exits
⚠️ Trump’s Fed Attacks Stir Policy Concerns
President Trump’s public criticism of Fed Chair Powell—calling for steep rate cuts and threatening removal—has raised market alarms over the central bank’s independence. Analysts warn such interference could destabilize confidence in U.S. monetary policy
🏦 Banks Prepare for Earnings Surge
Major U.S. banks are expected to report strong Q2 results this week. Enhanced trading and investment banking revenues are forecasted to offset economic uncertainties tied to tariffs
📡 Nvidia CEO to Visit Beijing
Jensen Huang is set to hold a high-profile media briefing in Beijing on July 16, signaling continued emphasis on China for Nvidia despite U.S. export restrictions—potentially a key narrative for tech markets
📊 Key Data Releases & Events 📊
📅 Wednesday, July 16:
8:30 AM ET – Producer Price Index (June)
Gauges wholesale inflation pressures; June expected +0.2% MoM vs May’s +0.1%
9:15 AM ET – Industrial Production & Capacity Utilization (June)
Monitors factory and utilities output and usage rates—key for industrial-sector health
Jensen Huang in Beijing
Nvidia CEO to lead media briefing in Beijing—a potential market mover for chipmaking and AI sectors
⚠️ Disclaimer:
This info is for educational purposes only—not financial advice. Consult a licensed professional before making investment decisions.
📌 #trading #stockmarket #inflation #Fed #tech #industrial #PPI
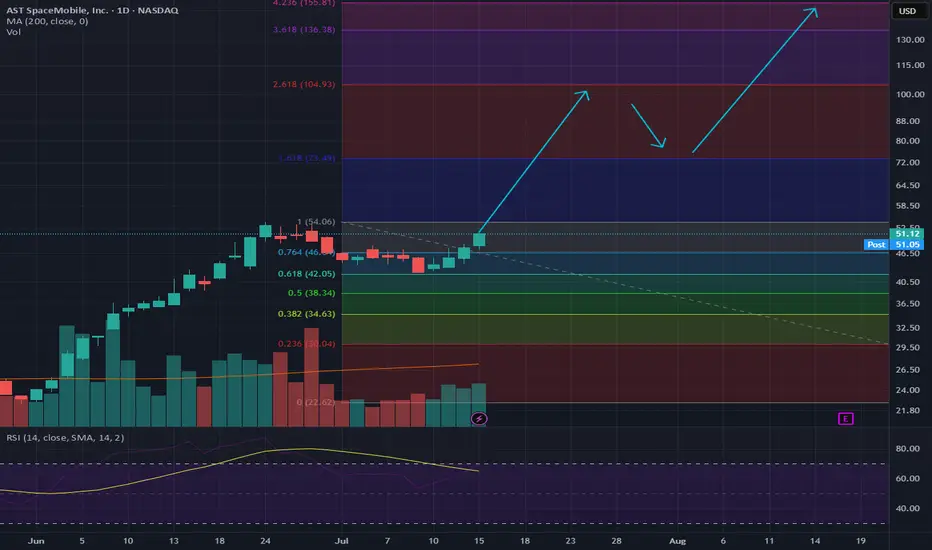
LONG-TERM $ASTSYou can't spell Sats without ASTS
This will be a trillion dollar company - here's the next few years, cheers!
BITCOIN PULLBACK 110.000🔹 The uptrend remains intact
After setting a new high, the price may enter a mild correction toward the $110K zone.
Key support levels in this uptrend are:
✅ $115K
✅ $110K
✅ $105K
As long as the price holds above $105K, any pullback is considered healthy and the uptrend is likely to continue.
📊 A shallow correction is part of a healthy market structure.

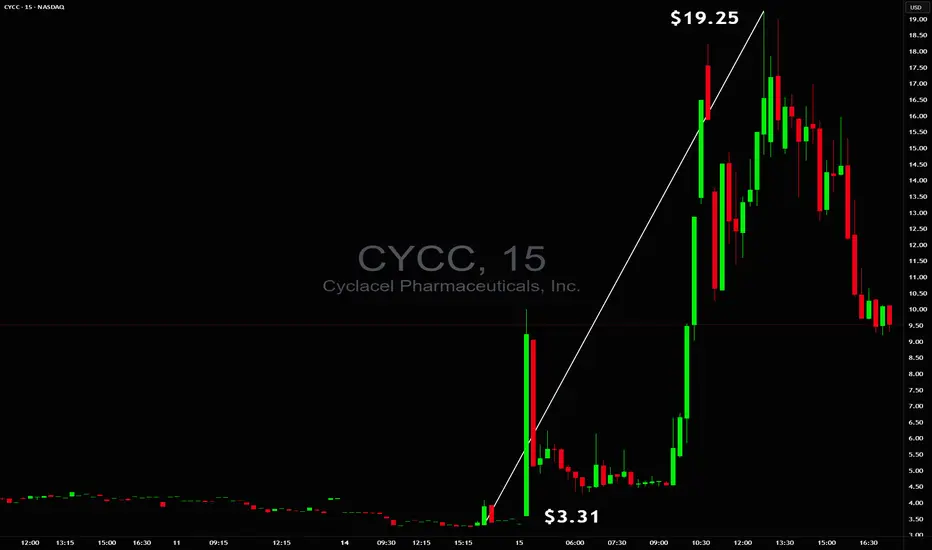
$3.31 to $19.25 in minutes$3.31 to $19.25 in minutes 🚀 but without a safe trade setup ❌ NASDAQ:CYCC
Too unstable to trade early while end of day there was a chance for power squeeze but even on 60M+ volume, tiny float and huge borrow fee they were able to reverse it so safe stop had to be respected ✔️
NVIDIA -- Major Resistance // Confluence of 3 FactorsHello Traders!
WOW... This chart is quite incredible I must say.
It's amazing how price is currently at an exact point where 2 major trendlines converge which also nearly coincides with the 1.618 Fibonacci extension. Price closed almost to the penny just above the major trendline connecting the prior highs. It will be very interesting to see what price does over the next few days.
What Does These Converging Trendlines Mean?: Think of a trendline like a wall... Depending on how "strong" the trendline is, this wall could be made from wood all the way through to vibranium straight from Captain Americas shield! These two trendlines converging would likely resemble a steel wall and would be extremely hard to penetrate. (Although there are no gurantees in trading)
What To Watch For: I will be watching to see if price can both break and confirm above both resistance trendlines. It will take MEGA buying pressure to accomplish this and would likely mean continuation to the upside. If price cannot break and confirm above then we will likely see a large retrace to support.
Thanks everyone and best of luck on your trading journeys!

EUR/USD Technical Outlook: Bearish Momentum Builds Below Key ResEUR/USD has broken down from its recent highs near the 1.1750 resistance area, which coincides with the 78.6% Fibonacci retracement level. The pair is now trading around the 1.1600 handle, slipping below a short-term support zone near 1.1576. This breakdown signals potential continuation of bearish pressure in the coming sessions.
The 50-day SMA (1.1477) remains upward sloping, but the price action has now decisively turned lower, with a series of lower highs forming after the July peak. The MACD histogram is fading, indicating waning bullish momentum, and the RSI has dropped to 47.7—losing the bullish bias and heading toward bearish territory.
If EUR/USD cannot reclaim the 1.1576–1.1600 zone quickly, a deeper pullback toward the 50-day SMA or even the 1.1450–1.1500 range may unfold. On the upside, bulls would need to push back above the 1.1750 resistance to regain control, but given the loss of momentum and structure, the near-term bias favors the bears.
-MW
CRV ANALYSIS🔮 #CRV Analysis 💰💰
🌟🚀 As we can see that #CRV is trading in a symmetrical triangle and given a perfect breakout. But there is an instant resistance. If #CRV breaks the resistance 1 then we will see a good bullish move in few days . 🚀🚀
🔖 Current Price: $0.7280
⏳ Target Price: $1.0800
#CRV #Cryptocurrency #DYOR

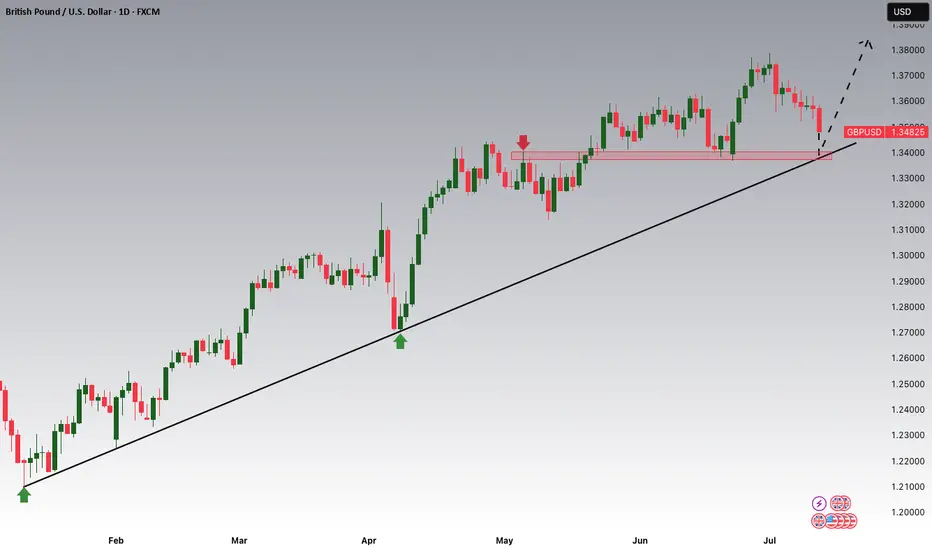
GBPUSD is Nearing the Daily Trend!!!Hey Traders, in tomorrow's trading session we are monitoring GBPUSD for a buying opportunity around 1.34100 zone, GBPUSD is trading in an uptrend and currently is in a correction phase in which it is approaching the trend at 1.34100 support and resistance area.
Trade safe, Joe.
USDCAD Potential DownsidesHey Traders, in today's trading session we are monitoring USDCAD for a selling opportunity around 1.37200 zone, USDCAD is trading in a downtrend and currently is in a correction phase in which it is approaching the trend at 1.37200 support and resistance area.
Trade safe, Joe.
USDJPY 1H - market buy with a confirmed structureThe price has bounced from a key support zone and is showing early signs of recovery. A clear base has formed, and the MA50 is starting to turn upward, indicating a shift in short-term momentum. While the MA200 remains above the price, the overall structure suggests a potential continuation of the bullish move.
Trade #1 — entry at market, target: 145.939, stop below recent local low.
Trade #2 — entry after breakout and retest of 145.939, target: 148.000, stop below the retest zone.
Volume has stabilized, and the reaction from support is clear. As long as price holds above the last swing low, buying remains the preferred strategy.

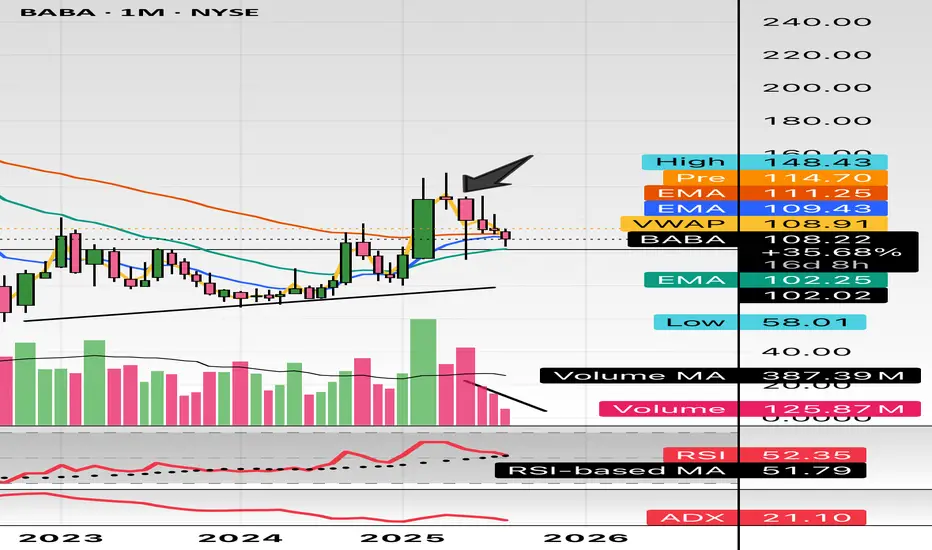
$BABA don’t miss this milky bottle. Called this out at $105 in minds. This Monthly declining volume, support at $100, and uptrend pattern. China will boom into the end of Q3 and early 2026. Target is $180 and $200.
WSL.
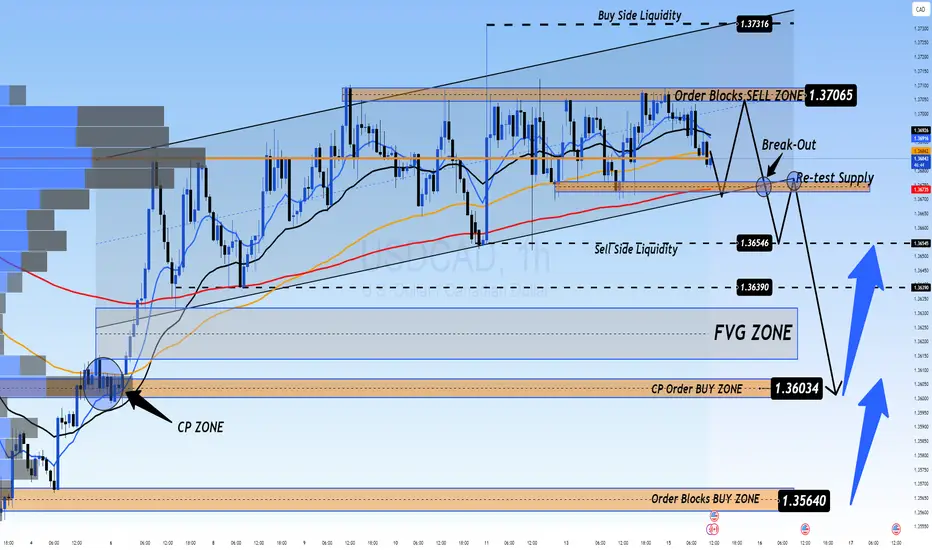
Remains Below 1.3700 Ahead of CPI Data from the US and CADUSD/CAD Remains Below 1.3700 Ahead of CPI Data from the US and Canada
USD/CAD continues to decline ahead of inflation data from both the US and Canada.
The US inflation rate is expected to rise to 2.7% year-over-year in June, up from 2.4% recorded in May.
Meanwhile, Canada’s CPI is forecasted to increase by 1.9% year-over-year in June, up from 1.7% in May.
USD/CAD is trading around 1.3690 during the European session on Tuesday, following two days of gains. The pair is declining as the US dollar (USD) continues to weaken ahead of the June CPI data from the US. The inflation figures will provide new insights into the Federal Reserve's (Fed) monetary outlook.
📉 Market Outlook for USD/CAD – Possible Drop on CPI Release
The USDCAD is still in a downtrend, and a sharp drop could occur with today’s CPI data release. Currently, there are two Buy Side Liquidity zones above and Sell Side Liquidity below, with the price balanced around the VPOC zone, which will soon decide the direction after the CPI announcement today.
Market liquidity still holds a FVG below, and with CPI data expected to favor USD, this could trigger a sharp drop towards this liquidity zone, possibly nearing CP OBS at 1.3600, followed by a potential rebound.
If price breaks CP zone, it may head toward a strong OB zone near 1.35xxx. Therefore, caution is advised when monitoring these OB zones.
🎯 Trading Strategy for Today
🟢 BUY ZONE: 1.36000
SL: 1.35500
TP: 1.36500 → 1.37000 → 1.37500 → ????
💬 What are your thoughts on USD/CAD ahead of the CPI data release? Do you expect a strong bounce or a continued decline? Share your views and join the conversation below!
👉 Follow for more updates and insights, and join the community to discuss real-time market moves!
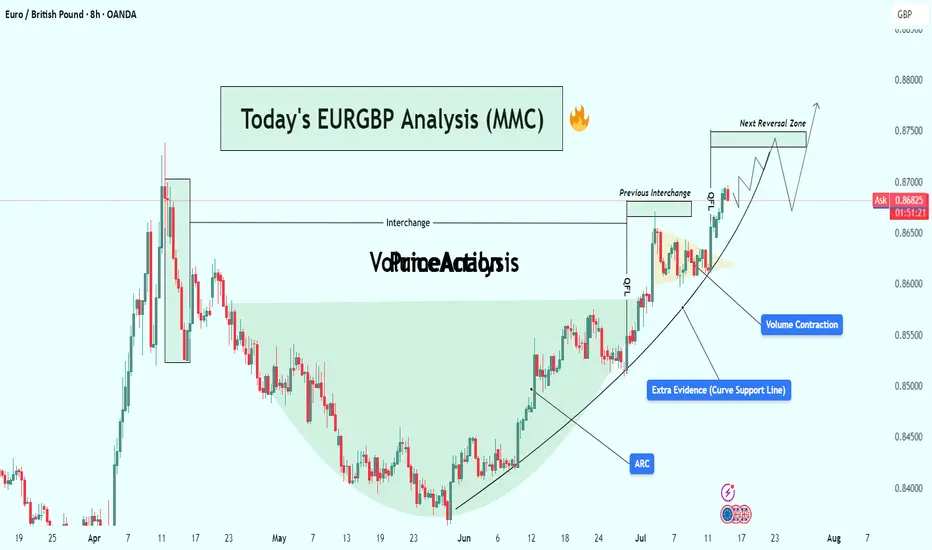
EURGBP Analysis : Bullish Setup + Support & Reversal Zone Ahead🔍 Overview:
This analysis explores a well-developed Mid-Market Cycle (MMC) pattern playing out on the EUR/GBP 8H chart. The price action has transitioned from accumulation to markup, forming a classic cup-shaped recovery structure supported by a parabolic ARC curve. With strong volume contraction, historical interchange zones, and clean breakouts, this setup indicates bullish momentum heading into the next reversal zone.
Let’s walk through each component in detail and build the case for this trade setup.
🧩 1. MMC Cycle Framework
The chart structure aligns with the MMC (Mid-Market Cycle) model:
Phase 1 – Accumulation:
From April to late May, price formed a rounded bottom resembling a "cup" — a known sign of smart money accumulation. The downward momentum stalled, and sellers were gradually absorbed by larger participants.
Phase 2 – Breakout & Expansion:
Early June saw price breaking out of this base, beginning an aggressive uptrend supported by rising structure. This marks the transition to the markup phase of the MMC.
Phase 3 – Pullback & Continuation:
Price pulled back slightly into previous resistance (now turned support), forming a bullish continuation triangle and breaking out again. A textbook MMC continuation.
🧠 2. Technical Confluences
✅ A. ARC Support Curve
The curved support line (ARC) acts as dynamic demand.
Price has bounced multiple times off the curve, reinforcing its strength.
ARC patterns often signal increasing bullish acceleration, reflecting market psychology as traders gain confidence with each higher low.
✅ B. Interchange Zones
The concept of Interchange refers to zones where support becomes resistance or vice versa.
This chart features two key interchange levels:
First interchange formed after the April high.
Second interchange was retested and held cleanly after the breakout.
These areas indicate institutional interest, and their successful retests confirm trend continuation.
✅ C. Volume Contraction
Volume has been shrinking during the markup, which is counterintuitive but strategic.
In Wyckoff theory, this shows absorption of supply — institutions deliberately suppress volatility to accumulate before the next breakout.
Once the contraction ends, explosive moves often follow.
🎯 3. Target Zone: Next Reversal Area
Price is now heading into a clearly defined resistance zone around 0.87400–0.87500.
This level was respected in prior price history (April peak) and may trigger short-term selling or distribution.
The chart shows a possible liquidity grab scenario at the reversal zone, followed by a corrective move (mini bearish ABC).
📈 4. Price Projection & Scenarios
Bullish Case (High Probability)
Breakout Above 0.87500: Triggers a major leg upward.
Potential extension targets:
0.87850 (Fibonacci projection)
0.88200 (next higher timeframe resistance)
Bearish Case (Short-Term Pullback)
Rejection at Reversal Zone:
A corrective leg toward the ARC or prior interchange.
Ideal re-entry for buyers near:
0.86400–0.86600 zone
Or curve retest near 0.86000
🧭 5. Trade Strategy
🔹 Entry Options:
Breakout Entry: Above 0.87500 on strong candle + volume.
Retest Entry: On dip toward ARC curve or interchange.
🔹 Stop-Loss Ideas:
Below ARC line (~0.86000)
Below last bullish engulfing (~0.86250)
🔹 Targets:
TP1: 0.87500
TP2: 0.87850
TP3: 0.88200 (longer-term swing)
💡 6. Trader Psychology in This Chart
This chart represents a controlled bullish structure — a hallmark of smart money participation. Here’s why:
The rounding base was methodically built without sudden volatility.
Each breakout was followed by healthy retests (no fakeouts).
Volume stayed low during markups, reducing retail confidence and allowing institutional loading.
The ARC curve reflects increasing confidence and participation — buyers consistently stepping in on higher lows.
📌 Conclusion
This EUR/GBP setup is a textbook MMC/ARC structure with multiple confirmations:
Smart accumulation
Curve support respected
Volume and structure aligned
Clear next resistance zone
Whether you’re swing trading or monitoring for breakout scalps, this is a high-quality setup worth tracking. Be ready to act at the reversal zone, as it will either confirm continuation or offer a lucrative retest entry.
🔔 Follow for More:
I post regular MMC, structure-based, and Smart Money trade setups. Drop a like, comment your thoughts, or ask questions below!
USDJPY Analysis : Bullish Channel Strategy & FMFR Zone Reaction🧩 Market Structure Overview
USDJPY has been in a strong bullish market structure, forming consistent higher highs and higher lows since the beginning of July. The pair recently created a rising ascending channel, where price action has respected both the upper and lower bounds with clean impulsive and corrective moves.
From the 11th to 15th July, USDJPY moved steadily within this bullish channel, forming minor consolidation zones and reacting to short-term supply-demand levels. However, on the 15th, we witnessed a pullback from the upper channel resistance, indicating short-term profit-taking or internal bearish liquidity sweep.
🧠 Current Price Action
Now, price is pulling back and approaching a high-confluence demand zone, marked as:
FMFR (Fair Market Fill Range): A zone where unfilled buy-side orders are likely resting.
SR Flip (Support-Resistance Interchange): A previous resistance zone, now turned into a potential support base.
This area (between 146.80 – 147.00) has multiple confirmations:
Past supply zone → broken and retested
Strong impulsive bullish move originated here
Mid-point of the current bullish channel
Psychological level (147.00 round number)
The market is now offering a potential buying opportunity from this zone, provided a bullish confirmation pattern is printed on lower timeframes (1H or 30M).
🔍 Key Technical Confluences
Bullish Ascending Channel:
Clearly respected — suggesting institutional accumulation. Price is now retesting mid-level or base structure of this channel.
FMFR Zone:
Typically used to spot unbalanced price areas where limit buy orders may rest. Smart money often returns to fill these zones before moving further.
SR Flip:
The prior supply zone from July 8–10 was broken decisively, and price is now using this same level as support.
Liquidity Sweep & Trap:
The current rejection from the channel top may have liquidated early longs. That opens room for a smart-money reversal from the deeper FMFR zone.
📌 Trading Plan (Execution-Based Strategy)
🔽 Entry Criteria:
Wait for a clear bullish reversal candle within the FMFR zone (e.g., bullish engulfing, pin bar, morning star).
Entry can be refined on the 1H or 30M timeframe using a BOS (Break of Structure) signal.
🟢 Buy Zone:
Between 146.80 – 147.00
🔴 Stop Loss:
Below 146.40, well below the FMFR zone and recent wick lows
🎯 Take Profits:
TP1: 148.20 – Retest of the central channel zone
TP2: 149.60 – Next Major Reversal Zone
TP3 (Optional): 150.00 psychological round level (if bullish continuation breaks structure)
⚠️ Risk Management Tips:
Wait for confirmation — don’t rush into the zone without candle proof.
Risk only 1-2% per trade idea.
Adjust lot size according to stop-loss distance.
Avoid chasing if price closes below 146.40 — structure will be invalid.
🔮 What Could Invalidate This Setup?
Clean break below 146.40 support with bearish structure forming (LL, LH)
Bearish fundamentals from USD side (e.g., CPI, FOMC impact)
A tight channel breakdown without bullish volume
📅 Fundamental Backdrop:
USD is currently reacting to macro data and rate expectations.
JPY remains weak structurally, unless BOJ introduces surprise tightening.
US CPI & Fed commentary may influence short-term volatility and liquidity grabs.
🧠 Conclusion:
USDJPY is presenting a high-probability buy setup as it revisits a strong confluence zone formed by FMFR + SR flip. Smart money often re-engages at these levels after liquidity hunts, especially within a bullish structure. Watch for confirmation on lower timeframes, and manage risk responsibly.
This trade idea is based on price action, structure, and institutional concepts, aiming for a trend continuation with clear invalidation levels.

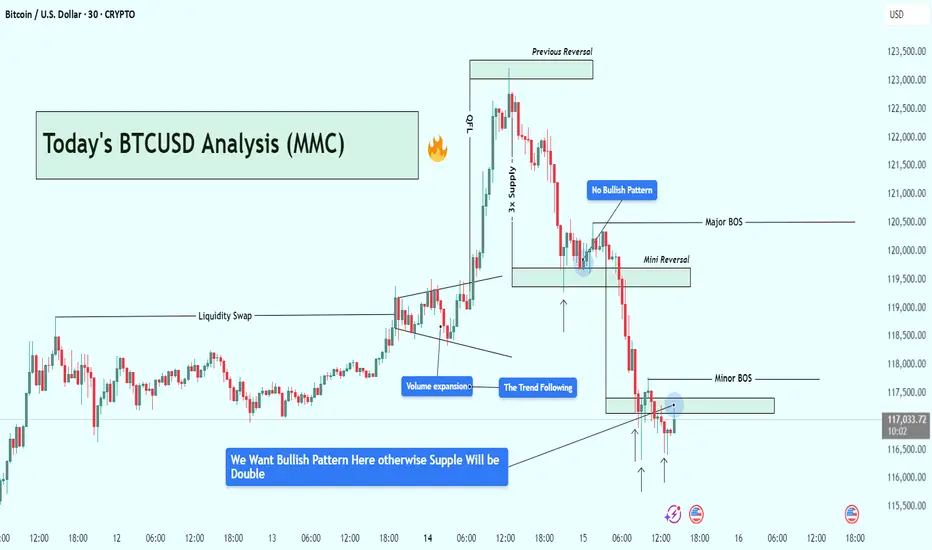
BTCUSD Analysis : Bitcoin Trend Shifted/Bullish Pattern + Target🧭 Overview:
Bitcoin’s recent price action has delivered a textbook sequence of institutional liquidity play, volume-driven breakout, and supply zone rejection. After rallying on increasing volume, BTC tapped into a significant 3x Supply Zone—which also served as a previous reversal point—and was swiftly rejected. The market is now trading around a key decision zone where traders must stay alert for a confirmed bullish reversal, or risk getting caught in further downside.
🔍 Step-by-Step Technical Breakdown:
🔸 Liquidity Grab + Volume Expansion
The move began with a liquidity sweep, as BTC pushed above recent highs, hunting stop-losses and inducing breakout traders. This kind of price manipulation is typical of smart money accumulation/distribution zones.
Immediately following that, we observed a volume expansion—a strong signal that institutional players had stepped in, propelling BTC upward with conviction. This expansion pushed price sharply into the 3x Supply Zone, a critical zone of interest from a previous bearish reversal.
🔸 3x Supply Zone – The Turning Point
Once price entered the 3x Supply Zone, bearish pressure resumed. No bullish continuation pattern appeared on the second attempt into this zone—confirming that sellers were defending it aggressively. This area has now been validated as a strong supply barrier, capable of initiating trend reversals.
🔸 Major BOS – Structural Shift Confirmed
Price broke below key support around $120,500, which marked a Major Break of Structure (BOS). This BOS is crucial—it represents a shift from a bullish to bearish market structure and is often the signal that retail longs are trapped.
This BOS was followed by a mini reversal zone, but again, no bullish confirmation appeared there—highlighting market weakness.
🔸 Minor BOS & Trendline Breakdown
Further downside action led to a Minor BOS near $117,800, reinforcing the bearish sentiment. Additionally, the ascending trendline—which had supported BTC’s rally—was decisively broken and retested from below. This confirms a shift in momentum, now favoring sellers.
📍 Current Price Action – Critical Decision Zone
BTC is currently hovering around $117,000, right at a potential demand zone. While there was a brief bullish reaction, the market hasn’t formed a valid bullish reversal pattern yet.
There’s a clear message from the chart:
“We want a bullish pattern here—otherwise, support will break and supply will double.”
In simple terms, unless bulls step in with structure (higher low, engulfing candle, etc.), sellers will likely take over, and price may test deeper support levels.
🎯 What to Watch Next:
✅ Bullish Case:
If BTC forms a strong reversal pattern (e.g., double bottom, bullish engulfing, or inverse head & shoulders), we can expect a short-term recovery back to:
Target 1: $118,500
Target 2: $120,000–$120,500
❌ Bearish Case:
Failure to hold this zone and no clear bullish pattern = likely continuation to the downside, potentially targeting:
$116,000
Even $114,500 in extended moves
🧠 Trading Insights (Educational):
Volume + Structure = Edge
Don’t rely solely on candlestick signals—combine them with structural breaks and volume to get confluence.
Supply Zones Aren’t Just Rectangles
The 3x Supply Zone was powerful because it had historical context, volume convergence, and psychological resistance. These layered factors make zones more reliable.
BOS Isn’t a Trendline Break
BOS means real structural shift. In this case, lower highs and lower lows confirmed the change.
💡 Final Thoughts:
BTC is at a make-or-break level. The recent rejection at the 3x supply zone has shifted the momentum, and buyers must prove their strength now—or risk watching the price unravel further.
Stay patient, wait for structure, and never fight momentum.
YEXT 1W - breakout confirmed, retest inside bullish channelYext stock just pulled a clean breakout of the weekly downtrend line, retested the buy zone around the 0.5 Fibo level ($7.32), and is now bouncing within a rising channel. The 200MA and 50EMA are both below price, supporting a shift in trend even though the golden cross hasn’t formed yet. The volume increased on breakout, and there's low overhead supply - a classic setup for continuation. The arrow shows the expected move, contingent on confirmation.
Targets: 9.15 - 11.40 - 15.06
Fundamentally, Yext offers enterprise-grade AI-powered search solutions and recently gained attention with new product updates. With AI adoption accelerating, the company may ride the next wave of institutional interest.
When price retests the zone, MA is supportive, and there's no overhead resistance - that’s not noise, that’s a signal.

Technical Analysis Forecast for NIFTY50 (25,191) (UTC+4) 1:11PM
1. Candlestick Patterns
Recent Structure:
If NIFTY50 closed near 25,191 with a long upper wick (shooting star/gravestone doji), it signals rejection at higher levels → bearish reversal potential.
A bullish engulfing/marubozu candle would indicate strength → upside continuation.
Key Observation: Watch for confirmation candles. A close below 25,000 invalidates bullishness.
2. Harmonic Patterns
Potential Setups:
Bullish Bat Pattern: If 25,191 aligns with the 0.886 retracement of a prior up-move (e.g., 24,800 → 25,191), it suggests a reversal zone for longs.
Bearish Crab: If 25,191 is the 1.618 extension of a prior swing, expect resistance → pullback to 24,900-25,000.
Action: Validate with Fibonacci levels. Break above 25,250 negates bearish harmonics.
3. Elliott Wave Theory
Wave Count:
Scenario 1 (Bullish): If in Wave 3 (impulse), 25,191 could extend to 25,500 (Wave 3 = 1.618x Wave 1).
Scenario 2 (Bearish): If in Wave B (corrective), 25,191 may peak → Wave C drop to 24,600 (Wave A = Wave C).
Confirmation: A break below 24,950 supports Wave C; hold above 25,100 favors Wave 3.
4. Wyckoff Method
Phase Analysis:
Distribution?: If volume spiked at 25,191 without further upside, it suggests "upthrust" (smart money exiting) → downside to 24,700 (accumulation zone).
Re-accumulation?: If consolidating near 25,191 on low volume, expect breakout toward 25,400.
Key Sign: Watch for springs (false breakdowns) or upthrusts (false breakouts).
5. W.D. Gann Theory
Price & Time Squaring:
25,191 is near 25,200 (a Gann square number). Close above 25,200 opens 25,500 (next resistance).
Time Cycle: July 15–20 is a potential turning window (watch for reversals).
Gann Angle: Trade above 1x1 angle (e.g., 45° from June low) = bullish momentum.
6. Indicator Synthesis (RSI + BB + VWAP)
RSI (14-period):
>70: Overbought → pullback likely if diverging (e.g., price highs ↑, RSI ↓).
<50: Loss of momentum → risk of deeper correction.
Bollinger Bands (20,2):
Price near upper band → overextended → mean-reversion to middle band (25,000) possible.
"Squeeze" (narrow bands) → impending volatility breakout.
VWAP (Daily):
Price above VWAP = intraday bullish bias. A dip to VWAP (~24,950) is a buy opportunity.
Price below VWAP = bearish control → sell rallies.
Intraday/Swing Outlook
Bullish Case (Hold above 25,100):
Target: 25,400 (Elliott Wave 3 + Gann resistance).
Trigger: Bullish candle close + RSI holding 60.
Bearish Case (Break below 25,000):
Target: 24,700 (Wyckoff accumulation + BB lower band).
Trigger: Bearish harmonic confirmation + RSI divergence.
Key Levels
Type Level Significance
Support 25,000 Psychological + BB middle band
24,700 Wyckoff accumulation zone
Resistance 25,191-25,200 Current price + Gann square
25,400 Elliott Wave 3 target
Trading Strategy
Intraday:
Long if holds 25,050-25,100 with RSI >50. Stop loss: 24,950. Target: 25,250.
Short if breaks 25,000 on high volume. Stop loss: 25,150. Target: 24,800.
Swing:
Wait for daily close above 25,200 (bullish) or below 24,950 (bearish).
Hedge with options: Buy 25,200 Calls + 25,000 Puts for volatility breakout.
Conclusion
25,191 is a pivotal level. The confluence of:
Harmonic resistance + Gann square at 25,200,
RSI near overbought territory,
Price testing BB upper band,
suggests short-term consolidation/pullback is likely. However, a daily close above 25,200 ignites bullish momentum toward 25,500. Trade the breakout/breakdown with confirmation.
*Disclaimer: This analysis is time-sensitive (as of July 15, 2025). Monitor real-time volume/price action for validation.*
For those interested in further developing their trading skills based on these types of analyses, consider exploring the mentoring program offered by Shunya Trade.
I welcome your feedback on this analysis, as it will inform and enhance my future work.
Regards,
Shunya Trade
⚠️ Disclaimer: This post is educational content and does not constitute investment advice, financial advice, or trading recommendations. The views expressed here are based on technical analysis and are shared solely for informational purposes. The stock market is subject to risks, including capital loss, and readers should exercise due diligence before investing. We do not take responsibility for decisions made based on this content. Consult a certified financial advisor for personalized guidance.

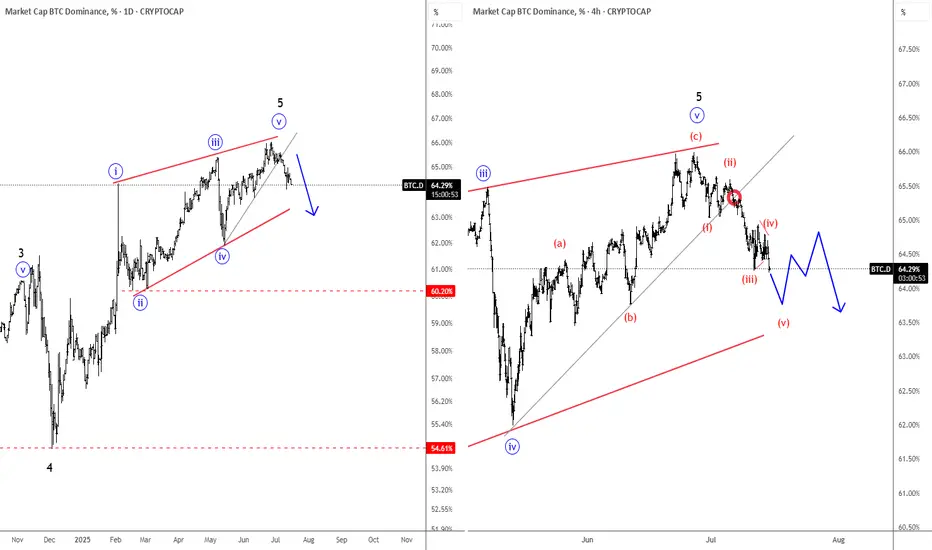
Bitcoin Dominance Found The Top; ALTcoin Dominance Stepping InHello Crypto traders! BTC.Dominance is falling in an impulsive fashion after we spotted the top within the wedge pattern. Now that is trading in wave (v) of a five-wave impulse from the highs, it just confirms a bearish reversal, which indicates that ALTcoin dominance is stepping in. And with still bullish Crypto market, we might be in the ALTseason.
GBPAUD Weekly Trade Setup–Parallel Channel Breakdown Opportunity1. Overview of GBPAUD Technical Setup
As of 15th July 2025, the GBPAUD 4-hour chart reflects a price currently positioned at a critical support level around 2.0470–2.0480, which has held multiple times since early April. The price action leading to this point has formed a classic descending parallel channel, with price making lower highs and testing horizontal support with increased frequency.
Key observations:
Price is well below the 200 EMA (currently around 2.0794), confirming a bearish long-term bias.
The resistance zone at 2.1070–2.1120 has proven strong over time, pushing back multiple rallies.
Price is compressing — getting squeezed into the lower boundary of the channel with shorter pullbacks, often a precursor to breakout.
The setup is aligning for a high-probability short trade, with a potential move toward the next major demand zone around 2.0100.
The Breakdown Thesis – What We See on the Chart
The current structure of GBPAUD tells a very clear story:
After a rally in early April, price has been trading within a consolidation range, failing to make higher highs.
The support around 2.0470 has now been tested repeatedly with lower bounces each time.
Price recently made a lower high and returned to support with momentum, increasing the probability of a breakdown.
We are expecting a bearish breakout of this support level, followed by a re-test of the broken zone, and then a strong downside continuation.
Risk Management Strategy
Every trade setup — no matter how technically perfect — must begin with a strong risk management plan.
For this GBPAUD setup:
Entry Trigger: Breakdown below 2.0470 and successful re-test rejection with bearish candle confirmation
Stop Loss: Above re-test high; ideally, just above 2.0530 (~66 pips risk)
Target 1: 2.0300 (170+ pips)
Target 2: 2.0200
Target 3 / Final: 2.0100 (potential 370+ pip move)
This gives us an excellent Risk:Reward ratio of ~1:5 or more, allowing traders to be wrong several times and still remain profitable over time.
Opportunities in the market don’t come from guessing — they come from waiting. The GBPAUD parallel channel setup is a brilliant example of structure-based trading that combines logic with discipline. Whether you're a full-time FX trader or a part-time swing participant, setups like these are where consistency is built.
Watch the breakdown. Wait for the re-test. Execute only when the market confirms your plan.
Happy Trading!
=================================================================
Disclosure: I am part of Trade Nation's Influencer program and receive a monthly fee for using their TradingView charts in my analysis.
=================================================================

Falling Wedge Formation Ive been bullish on GBPJPY for a couple weeks now and I still believe that it has more upside potential. Here we have a Falling Wedge Formation. we have 4 touches on our pattern already and just waiting for a break and retest to enter again. I am currently in a position based of the retest price gave of the previous resistance (circled on chart). Lets see how it goes.
