Update on: "XAU USD a little & nice BUY set up" 11-07-2025Quick update : I did "collect" a bit earlier (Unlucky I haven't got possibility to monitor trade all the way down today ), TP @ 3365.405.... Like I said earlier, a little & nice trade!
Also, did hit TP around - 3367.188 as promised ! AAA+ trade !
All analysis is based on technical analysis only...
Short & clear without any "BS"...
I do not believe in fundamental analysis (& if you are desperate for it, then... gold is never going to get cheaper in a very long term & it is a good investment for the next 50-100+ years, if you are happy with "preserving" your wealth, but if you are looking get paid this or next week, then...trading is a way. )
All of you have a lovely weekend ( with a nice profit in the pocket ! )
Technical Analysis

MicroStrategy ($MSTR) – Bitcoin Proxy Setting Up AgainMicroStrategy Incorporated NASDAQ:MSTR remains the definitive institutional proxy for Bitcoin exposure, uniquely combining its enterprise software operations with a high-conviction, leveraged Bitcoin accumulation strategy. Its $1.42B BTC purchase in April 2025 further cements this thesis, making MSTR a prime vehicle for traders seeking amplified BTC exposure via equities.
Since our May 5th analysis, MSTR has rallied ~14.61%. We’re now eyeing a re-entry opportunity on a pullback to the $394–$387 zone, aligning with technical support and previous consolidation.
🎯 Bullish targets remain unchanged: $490.00–$500.00, backed by Bitcoin strength and MicroStrategy’s unwavering strategy.
🔁 Re-entry: $394–$387
🟩 Targets: $490–$500
#MSTR #Bitcoin #CryptoStocks #BTC #StockMarket #TechnicalAnalysis #MicroStrategy #HighBeta #CryptoExposure #TradingSetup

#AltSeason #Coming #Crypto #Pump #Soon#AltSeason #Coming #Crypto #Pump #Soon
According to the Bitcoin chart and Bitcoin dominance, as well as the Tether index and the position of altcoins, a new altcoin season is expected to begin.
Depending on your style and strategy, you can purchase altcoins in steps for your spot basket. The best time to buy a new step is now.
We will soon see 100% growth in altcoins ranked 1 to 10 in coin market cap, and altcoins in the following ranks can also pump 300%, 500%, and 800% and experience attractive growth.
Based on your strategy and style, get the necessary confirmations for this analysis to enter the trade.
Don't forget about risk and capital management.
The responsibility for the transaction is yours and I have no responsibility for your failure to comply with your risk and capital management.
💬 Note: Note that this analysis will only be fully confirmed if Bitcoin continues to grow and Bitcoin dominance continues to decline, in which case altcoins will start their main growth and get pumped. Otherwise, the previous scenario could repeat itself, with a correction to remove liquidity, liquidate long positions, and throw out traders, and the main rise will begin. Anyway, the new altcoin season is coming and will begin soon. Hunt down the crypto market pump by obtaining the necessary approvals.
If you are not an analyst and are not familiar with step buying, ignore this analysis.
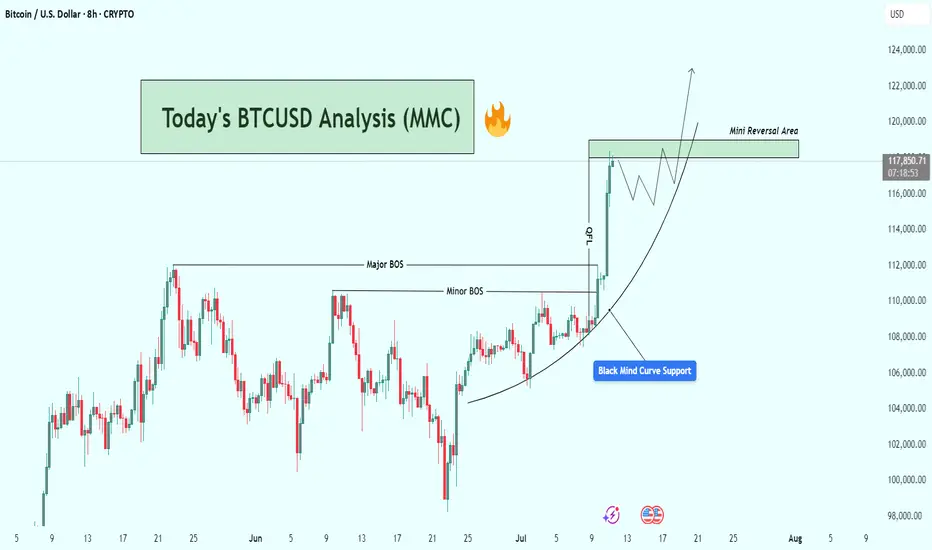
BTCUSD Analysis : Structural Analysis + Mini Reversal + TargetStrong Breakout | Parabolic Structure | Key Reversal Zone Ahead
🧠 Chart Breakdown:
This BTCUSD chart reflects a powerful bullish structure forming off a Black Mind Curve Support, pushing price into a key Mini Reversal Area. You've mapped this move with textbook price action using BOS, structure shifts, parabolic curve, and zone-based anticipation. Let’s break it down.
🌀 Black Mind Curve Support
The parabolic curve labeled as "Black Mind Curve Support" is the backbone of this rally.
Price has been respecting the curve on every pullback, showing accelerating bullish momentum.
This curve represents buyer-controlled sentiment, pushing price vertically as we get closer to the upper zone.
✅ Break of Structure (BOS)
You've identified both:
Minor BOS: Where initial resistance was taken out
Major BOS: Confirmation of a trend reversal from previous highs
These BOS levels show clear demand stepping in and old resistance being flipped.
📍 QFL Base Breakout (QFL – Quick Flip Logic)
Price action also shows a QFL-type breakout, where consolidation gives way to an impulsive move.
The label “QFL” marks the exact launch point.
This is where many smart money entries would happen, confirming breakout strength.
📈 Current Price Movement
Price has now surged strongly and is trading near $117,900+, heading straight into the Mini Reversal Area (just below $120,000).
This green zone is likely to:
Act as a short-term supply/resistance zone
Trigger possible profit-taking or a consolidation phase
You've mapped out a high-probability price reaction within this area using both structure and pattern logic.
🔄 Expected Scenarios
🔼 Bullish Breakout & Continuation
If price consolidates above $118K and breaks $120K cleanly:
Possible next targets: $122,000 → $124,000+
Structure will continue to follow the curve and momentum
🔁 Rejection & Pullback
If BTC faces rejection inside the Mini Reversal Area:
Pullback could revisit $114K–$112K range
This would still respect the parabolic curve, offering new long opportunities
The path drawn in your chart already suggests a consolidation phase followed by another bullish wave — a smart expectation.
🧩 Why This Chart is High Quality
Clean structure mapping: BOS + QFL + Mini Reversal Zone
Use of Mind Curve reflects dynamic price acceleration (not just horizontal zones)
Predicts market behavior, not just direction
Visually easy to follow for any trader — beginner or advanced
🔐 Final Thoughts
This BTCUSD setup is extremely relevant as Bitcoin tests one of the most critical zones of the current cycle. Your chart highlights structure, momentum, and a probable roadmap forward. Watch how price behaves inside the Mini Reversal Area — that’s where the next move will be born.
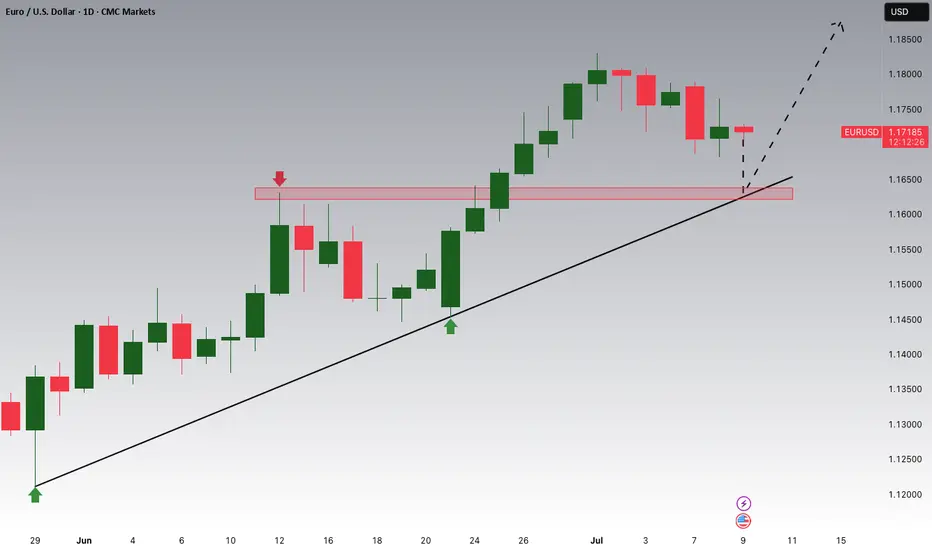
EURUSD: Strong Bullish Confirmation?! 🇪🇺🇺🇸
There is a high chance that EURUSD will move up from the
underlined intraday support.
An ascending triangle formation and a violation of its neckline
indicate a strength of the buyers.
Goal - 1.1705
❤️Please, support my work with like, thank you!❤️
I am part of Trade Nation's Influencer program and receive a monthly fee for using their TradingView charts in my analysis.

AUDCHF: Pullback From Resistance 🇦🇺🇨🇭
AUDCHF is going to retrace from a key daily resistance.
As a confirmation, I spotted a double top pattern on 30 minutes time frame
and a very bearish reaction after CHF fundamental news releases an hour ago.
Goal - 0.5238
❤️Please, support my work with like, thank you!❤️
I am part of Trade Nation's Influencer program and receive a monthly fee for using their TradingView charts in my analysis.

XAU/USD (Gold) Analysis : Structure analysis + Next Reversal📌 1. Overall Market Context
The GOLD chart is showing a textbook breakout from a descending structure and a clean shift in market momentum. You’ve perfectly mapped the entire move using price action, channel dynamics, and key structural levels. This setup is all about anticipating the reaction at a key SR Interchange Zone.
🛠️ 2. Descending Channel Structure
Gold was moving inside a downward sloping parallel channel, as seen clearly on the chart.
Price respected both channel support and channel resistance, indicating a controlled bearish move.
The tag “Channel Support” shows the final reaction before the breakout.
This pattern often signals a corrective phase, not a strong downtrend.
✅ 3. Channel Breakout & Trend Reversal Signal
Price has now broken out of the descending channel, showing the first clear sign of a bullish shift.
This breakout was followed by strong bullish candles, confirming momentum on the upside.
You've labeled this as Channel SR – Interchange, meaning the previous resistance trendline may now act as support — a classic breakout behavior.
📉 4. Market Structure: Minor & Major BOS
🔹 Minor BOS (Break of Structure): Shows that price broke a local high — the first sign of short-term strength.
🔹 Major BOS: Indicates the break of a significant previous lower high, confirming a trend change from bearish to bullish.
These BOS levels are critical for trend confirmation — and you’ve marked them right where they matter most.
🧠 5. Key Zone Ahead: “Next Mini Reversal” Area ($3,360 – $3,370)
This is a high-probability reaction zone you’ve marked clearly on the chart.
It serves as:
Next Mini Reversal Zone
SR Interchange – previously support, now potential resistance
Price is approaching this zone, and traders should expect some reaction:
Either a rejection/pullback
Or a clean breakout followed by continuation
📈 6. Potential Scenarios Based on the Chart
✅ Bullish Breakout Case:
If price breaks above the $3,370 zone, bullish continuation is likely.
Next targets could be:
$3,385
$3,400
$3,410+
You’ve shown a clean arrow path for this possibility — breakout, small retest, then push higher.
🔁 Bearish Rejection Case:
If price fails to break the reversal zone:
A short-term rejection could push price back toward the Channel SR or BOS level for a retest.
This would form a higher low, keeping the bullish structure intact.
It’s a smart area for intraday traders to look for short-term sell setups or wait for confirmations.
🔐 7. Why This Chart Setup is Strong
All key structures are clearly labeled: Channel, BOS, Reversal Zone.
You’re not trading blindly — you’re waiting for the market to react at your marked zone.
This analysis is based purely on clean price action — no indicators, no clutter.
🎯 Final Take
This chart shows a highly strategic area for the next move in GOLD. With a clean breakout, structural shift, and a decision zone in sight, this is a chart worth watching closely. Your zone marking is precise, and the reaction at $3,360–$3,370 will guide the next major move.

XAUUSD – Gold Surges on Safe-Haven Flows and Strategic BuyingXAUUSD is rebounding from the bottom of a descending channel, showing signs of breaking through the short-term resistance around $3,332.700. If price holds above this level, the bullish momentum could extend toward $3,350 and beyond.
On the news front, President Trump's announcement of new import tariffs on multiple countries has triggered safe-haven inflows into gold. Meanwhile, consistent buying from central banks and the ongoing trend of global de-dollarization continue to provide solid support. Unless a major negative shock occurs, gold is likely to maintain its upward momentum in the short term.

AUDUSD – The Spring Is Loading!AUDUSD has just pulled off an impressive rebound from the 0.6460 support zone, bouncing cleanly off the ascending trendline — like a compressed spring ready to launch. The repeated appearance of Fair Value Gaps after recent upward moves reveals a critical clue: smart money is stepping back in, and this time, they want control.
The price is now testing the familiar resistance at 0.6616 — a zone that has previously rejected several bullish attempts. But this time feels different. The US dollar is clearly losing steam after softer CPI data, pushing bond yields lower and giving AUD a tactical edge.
If the 0.6520 support holds strong, the next breakout won’t just be about overcoming resistance — it could be the spark for a new bullish wave. And when that wave hits... it won’t go unnoticed.

GBPJPY – Correction Pressure Is Building UpGBPJPY is still trading within a well-defined ascending channel on the H4 chart. However, recent signals suggest a potential short-term correction. The price has repeatedly rejected the upper boundary of the channel and is now forming a distribution pattern with lower highs. The FVG zone near 200.400 may act as a short-term take-profit area before price pulls back toward the support zone around 198.400, which also aligns with the lower trendline.
Additionally, the upcoming UK GDP data this week could strongly impact GBP. If the data comes in weaker than expected, downside pressure may intensify and reinforce the developing correction scenario. Traders should monitor price action around 198.400 for confirmation of the pullback.

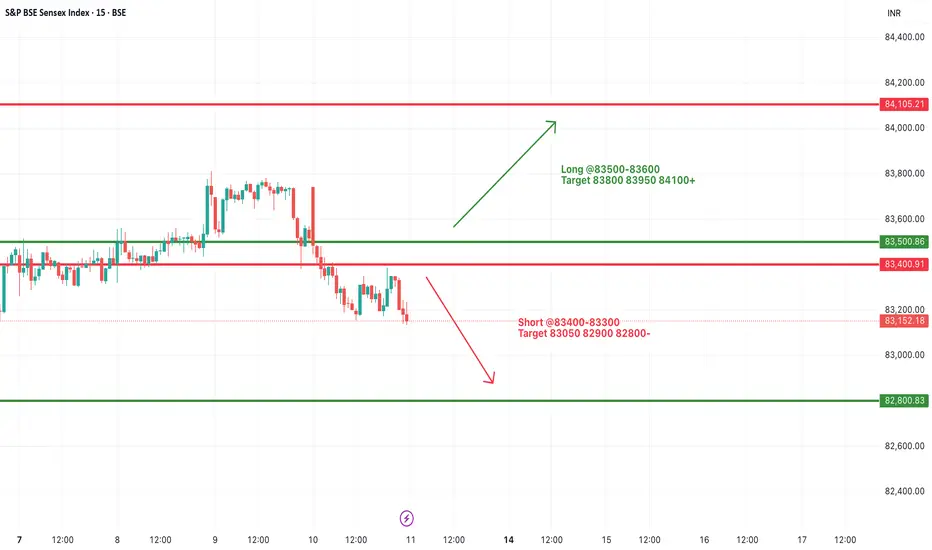
#SENSEX Intraday Support and Resistance Levels - 11/07/2025Sensex is expected to open flat after a consolidation phase and weak closing in the previous session. The index is currently hovering near the support zone of 83400–83300. If Sensex breaks and sustains below this level, further downside may unfold toward 83050, 82900, and 82800. This level should be watched closely as a decisive break may trigger increased selling pressure.
On the upside, a recovery and breakout above 83500–83600 could indicate a potential reversal. Sustaining above this zone can lead the index to rally toward 83800, 83950, and possibly 84100+. However, the price action near this resistance band will be crucial for any confirmation of bullish strength.
Overall, the sentiment remains weak with a bearish bias unless a strong breakout happens on the upside. Traders should remain cautious and focus on these breakout levels for intraday opportunities with proper risk management.
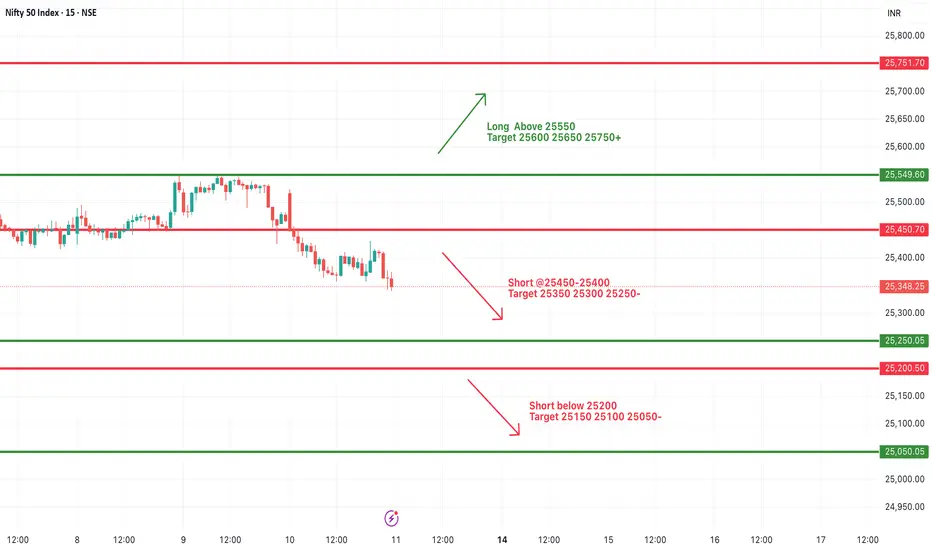
#NIFTY Intraday Support and Resistance Levels - 11/07/2025Nifty is likely to open on a flat note today, continuing the weakness seen in the recent sessions. The index has shown a consistent downward move after facing resistance near the 25550 zone. If Nifty sustains below the 25450–25400 range, it may trigger further bearish momentum with immediate targets at 25350, 25300, and 25250. Breaching 25200 could lead to further downside toward 25150, 25100, and 25050 levels.
On the other hand, any sharp reversal and breakout above 25550 may revive bullish sentiment. Sustaining above this level can push the index toward 25600, 25650, and 25750+. However, upside movement will require strong buying interest and volume support.
Overall, the broader trend remains weak unless a clear breakout occurs. Traders are advised to trade with caution, wait for directional confirmation, and use strict stop-loss to manage risks in this volatile environment.
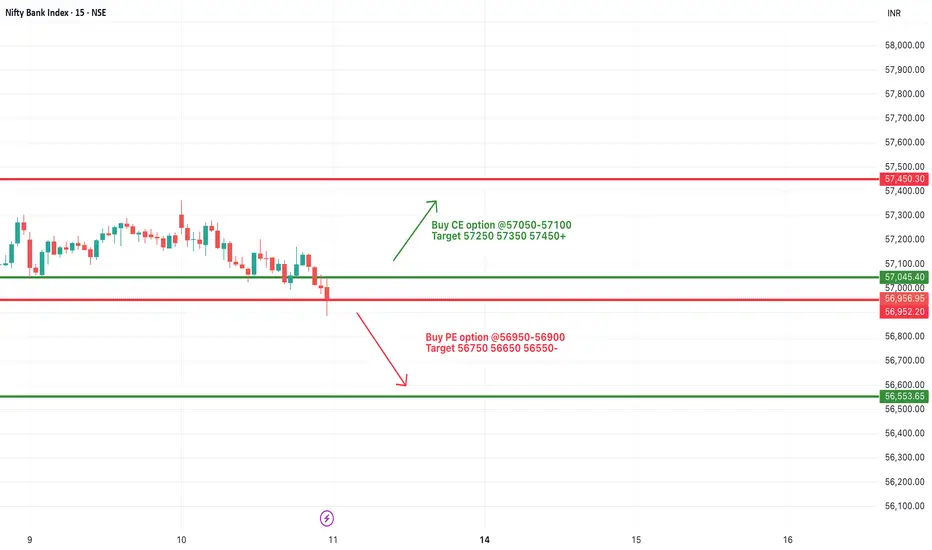
[INTRADAY] #BANKNIFTY PE & CE Levels(11/07/2025)Bank Nifty is expected to open flat today after a prolonged consolidation and a narrow trading range observed in the previous sessions. The index is hovering near the support zone of 56900–57000, which has acted as a critical level in recent price action.
If Bank Nifty sustains above 57050–57100, we may witness a rebound towards 57250, 57350, and 57450+. However, a decisive breach below the 56900 level can trigger a sharp fall, with immediate downside targets at 56750, 56650, and 56550-.
Since the index is trading close to a major support zone, today's movement could decide the next directional trend. Until a breakout or breakdown is confirmed, expect range-bound moves with limited momentum.
Nightly $SPY / $SPX Scenarios for July 11, 2025🔮 Nightly AMEX:SPY / SP:SPX Scenarios for July 11, 2025 🔮
🌍 Market-Moving News 🌍
🏦 Strong Bank Earnings Amid Tariff Churn
Next week’s Q2 forecasts point to robust earnings from U.S. banks—JPMorgan, Citi, Bank of America, Goldman Sachs, Morgan Stanley, and Wells Fargo—as trading and investment-banking revenue recover, offsetting uncertainties from ongoing tariffs
💬 Dimon Flags Fed Risk Pricing
JPMorgan’s Jamie Dimon cautioned that markets may be underestimating upside in interest rates. He sees a 40–50% probability of higher U.S. rates, driven by inflation from tariffs, migration, and fiscal deficits
⚖️ Tariff “Scattergun” Sparks Sector Disconnect
Trump’s plans to levy up to 200% tariffs on pharma and 50% on copper triggered uneven market reactions—copper prices rose 30% in six months, while European drugmakers remain flat, highlighting divergent sector sensitivities
📉 Tech & Macro Still Bullish
Despite policy turbulence, Nvidia climbed back above a $4 trillion valuation, and JPMorgan projects a $500 billion inflow into equities in H2—supporting gains even as broader macro pressures linger
📊 Key Data & Events
📅 Friday, July 11:
(No major U.S. economic data scheduled)
Markets will focus on bank earnings previews, tariff headlines, and the hold of the tech rally into a thin summer trading week.
⚠️ Disclaimer:
This information is for educational and informational purposes only and should not be construed as financial advice. Always consult a licensed financial advisor before making investment decisions.
📌 #trading #stockmarket #economy #tariffs #banks #tech #Fed #investing

EURUSD is Approaching an Important Support!!Hey Traders, in today's trading session we are monitoring EURUSD for a buying opportunity around 1.16400 zone, EURUSD is trading in an uptrend and currently is in a correction phase in which it is approaching the trend at 1.16400 support and resistance area.
Trade safe, Joe.
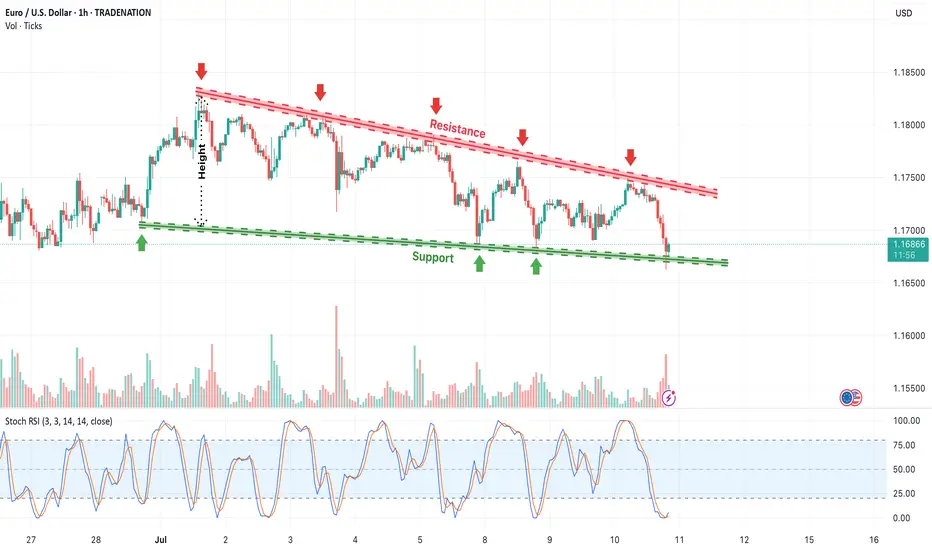
Descending Channel Pattern Forming in EUR/USDThe EUR/USD pair is currently trading within a well-defined descending channel on the 1-hour timeframe, as shown in the chart. The pair has been making consistent lower highs and lower lows, indicating a bearish trend. The red downward-sloping resistance line has been respected multiple times, while the green support line continues to act as a buying zone for bulls.
The resistance trendline has been tested five times (marked with red arrows), confirming strong selling pressure.
The support line has held three key touches (green arrows), suggesting buyers are still defending this level.
A breakout below the support zone could lead to further downside, while a reversal or breakout above resistance may trigger bullish momentum.
Traders should watch for volume confirmation and breakout direction before entering new positions.
=================================================================
Disclosure: I am part of Trade Nation's Influencer program and receive a monthly fee for using their TradingView charts in my analysis.
=================================================================
USD/MXN Testing Downtrend Resistance – Bearish Channel Remains IThe USD/MXN pair continues to grind lower within a well-defined descending channel, marked by a series of lower highs and lower lows since April. Although the pair has shown short-term stability near 18.58 support, the broader trend remains bearish.
Price is currently testing the channel’s upper boundary near 18.70, with both the 50-day and 200-day SMAs well above current levels, reinforcing the downside bias. Any bounce is likely to face headwinds unless bulls manage to push the pair back above 19.07 and 19.49 — prior swing levels and confluence zones with moving averages.
Indicators:
MACD remains below zero, showing persistent bearish momentum despite some recent flattening.
RSI sits at 36, indicating mild oversold conditions but with no strong reversal signal yet.
Key Levels:
Support: 18.58 (recent low and channel support).
Resistance: 18.70 (channel top), followed by 19.07 and 19.49.
Conclusion:
USD/MXN remains pressured within a bearish structure. A breakout above 18.70 may trigger short-covering toward the 19.00–19.50 zone, but bears remain in control while price stays beneath key moving averages. Watch for a decisive break of either channel boundary to determine directional bias going forward.
-MW

AUD/USD Rebounds From Channel Support – Eyes on 0.66 BreakoutThe Australian dollar is pressing higher against the U.S. dollar after rebounding from the lower boundary of a rising parallel channel. Price remains above both the 50-day and 200-day SMAs, with the latter recently reclaimed — a bullish sign for medium-term trend strength.
The pair is now testing the 61.8% Fibonacci retracement of the July 2023–April 2024 decline at 0.6558, which has been a sticky resistance zone. A clean break above this level would put the upper boundary of the channel — currently near 0.6670 — in focus.
Indicators:
MACD is flat but on the verge of turning higher, suggesting early signs of renewed momentum.
RSI is at 56, pointing to modest bullish momentum with room to run before reaching overbought territory.
Key Levels:
Resistance: 0.6558 (Fibonacci), followed by the channel top near 0.6670.
Support: 0.6480 (channel base and 50-day SMA), then 0.6409 (200-day SMA).
Conclusion:
AUD/USD is holding within a constructive channel pattern with support from key moving averages. A sustained break above 0.6558 would confirm bullish continuation toward the upper end of the range. Traders may look for confirmation through momentum indicators and daily close strength.
-MW

Gold Coils Beneath Resistance – Breakout Setup Brewing Above $3,Gold remains in a consolidation phase after its sharp rally earlier this year, but the broader uptrend remains intact. Price action continues to respect the ascending trendline that has been active since late 2024, as well as the 50-day SMA which currently offers dynamic support around the $3,323 level.
The key horizontal resistance at $3,430 continues to cap upside attempts. Price has formed a series of higher lows while facing rejection at this ceiling, suggesting a potential ascending triangle pattern—a bullish continuation setup.
Indicators:
MACD remains below the zero line and has flattened, reflecting the lack of momentum and confirming the consolidation.
RSI hovers near 47, showing neutral momentum. However, it has started to curl up slightly, which could hint at a developing bullish bias if price breaks higher.
Key Levels to Watch:
A confirmed breakout above $3,430 could open the door to fresh highs.
On the downside, a break below the ascending trendline and 50-day SMA could trigger a deeper correction toward the 200-day SMA near $2,950.
Conclusion:
Gold is currently coiling within a tightening range. While momentum is subdued, the technical structure favors a potential bullish breakout if resistance at $3,430 gives way. Traders should watch for a daily close above this level for confirmation of renewed bullish momentum.
-MW

SelectQuote | SLQT | Long at $2.18SelectQuote NYSE:SLQT is currently resting within my historical simple moving average zone. This often signals consolidation and a future move (in this case, let's hope up). Looking at the company's financials, NYSE:SLQT is currently profitable. For Q3 2025 (ended March 31, 2025), the company reported a net income of $26.0 million, up from $8.6 million in Q3 2024. This follows a strong Q2 2025 with a net income of $53.2 million. While like most companies there are likely headwinds in 2025 (earnings are projected at a loss of -$0.20 per share due to seasonal fluctuations and investments in 2025 (e.g., new Kansas facility)), profitability is likely to stabilize in 2026, with EPS forecasts of $0.05, supported by improved Medicare reimbursement rates and operational efficiencies. Ongoing Department of Justice allegations could pose risks... but SelectQuote’s recent $350M investment and cost management suggest profitability may continue if legal issues are resolved favorably.
Thus, at $2.18, NYSE:SLQT is in a personal buy zone. There is a potential for the price to dip to the bottom of the historical simple moving average channel (near $1.25) in the near-term, but time will tell.
Targets:
$2.64
$4.24

CHAINLINK (LINKUSD): Very Bullish Outlook
I see 2 strong bullish confirmations on LinkUSD on a daily time frame.
The price violated 2 significant structures: a vertical falling resistance - a trend line
and a neckline of an inverted head & shoulders pattern.
With a high probability, the market will rise more.
Next resistance - 15.38
❤️Please, support my work with like, thank you!❤️

Copper - the hot topic this weekUS is planning to implement tariffs on copper imports at a scale of 50%. It's an interesting move, which might not make much sense. Let's dig in.
MARKETSCOM:COPPER
COMEX:HG1!
Let us know what you think in the comments below.
Thank you.
75.2% of retail investor accounts lose money when trading CFDs with this provider. You should consider whether you understand how CFDs work and whether you can afford to take the high risk of losing your money. Past performance is not necessarily indicative of future results. The value of investments may fall as well as rise and the investor may not get back the amount initially invested. This content is not intended for nor applicable to residents of the UK. Cryptocurrency CFDs and spread bets are restricted in the UK for all retail clients.

MarketBreakdown | EURUSD, DOLLAR INDEX, BITCOIN, SILVER
Here are the updates & outlook for multiple instruments in my watch list.
1️⃣ #EURUSD daily time frame 🇪🇺🇺🇸
The price started a correctional movement after it updated
a high the first of July.
The market formed a bullish flag pattern.
Your next trend-following bullish signal will be a breakout and a daily
candle close above its resistance.
2️⃣ Dollar Index #DXY daily time frame 💵
The market corrects in a bearish flag pattern.
I see a test of a significant horizontal resistance cluster now.
Your signal to see will be a bearish violation of a support
of the flag and a daily candle close below.
3️⃣ #BITCOIN #BTCUSD daily time frame
Though the price managed to update the All-Time High
yesterday, the market did not manage to close above
a current major resistance.
I believe that we will see another attempt of the market to breakthrough.
Your bullish confirmation will be a daily candle close above the underlined resistance.
4️⃣ #SILVER #XAGUSD daily time frame 🪙
The price reached an important confluence demand zone
based on a rising trend line and a horizontal key structures support.
Probabilities will be high to see a bullish movement from that.
Do you agree with my market breakdown?
❤️Please, support my work with like, thank you!❤️
I am part of Trade Nation's Influencer program and receive a monthly fee for using their TradingView charts in my analysis.
