Surprise halt by the RBA. A positive for the AUD.After a surprise halt by the RBA, where the Bank kept the cash rate unchanged, MARKETSCOM:AUDUSD reversed sharply higher. Where it may go next? Let's dig in.
FX_IDC:AUDUSD
Let us know what you think in the comments below.
Thank you.
77.3% of retail investor accounts lose money when trading CFDs with this provider. You should consider whether you understand how CFDs work and whether you can afford to take the high risk of losing your money. Past performance is not necessarily indicative of future results. The value of investments may fall as well as rise and the investor may not get back the amount initially invested. This content is not intended for nor applicable to residents of the UK. Cryptocurrency CFDs and spread bets are restricted in the UK for all retail clients.
Technical Analysis

A Buying Opportunity or Sign of a Bigger Correction?Gold Breaks Below 3300 – A Buying Opportunity or Sign of a Bigger Correction?
🧭 Market Update: Is the Sell-off Truly Dangerous?
Gold saw a surprising reversal at the close of the US session yesterday after a sharp decline targeting the 329x liquidity zone, followed by a strong buying momentum that pushed the price back above this level.
After testing the liquidity zone below 3300, significant buying volumes emerged at this price point, pushing the price back up. However, the market is still undecided about whether the bulls or bears will dominate at this stage. We are currently in an accumulation phase, with liquidity sweeps occurring at both the highs and lows, meaning traders should exercise caution and look for scalping points for appropriate entry and exit.
Short-Term Outlook: Buy Bias Dominates Today
In the short term, the buy bias appears stronger compared to yesterday. Focus on buying early at continuation patterns to capture the market's movement. The D1 candle from yesterday formed a wick rejection, showing that selling pressure has been absorbed and the buying momentum has returned in the short term. Therefore, be proactive and look for early buy opportunities.
In the M30 timeframe, there is a solid continuation pattern forming in the 16-14 zone, which could serve as a good entry point today. If the price continues to drop, we’ll wait for a retest of the previous bottom at 03-00, and monitor for any strong downward momentum to confirm if the bearish trend will continue. On the other hand, if you’re considering sell positions, proceed with caution. As mentioned with the D1 wick rejection, the SELL pressure may have been absorbed, and BUY momentum could take over in the coming days. Avoid rushing into sell positions.
Key Support & Resistance Levels:
Key Resistance: 3342 – 3353 – 3362 – 3381
Key Support: 3330 – 3314 – 3303 – 3295
Scalping Opportunities and Buy Zones:
BUY SCALP:
3316 – 3314
Stop Loss: 3310
Take Profit: 3320 → 3325 → 3330 → 3335 → 3340 → 3350
BUY ZONE:
3303 – 3301
Stop Loss: 3297
Take Profit: 3306 → 3310 → 3315 → 3320 → 3330 → 3340 → ????
Sell Opportunities and Caution on Bears:
SELL SCALP:
3362 – 3364
Stop Loss: 3368
Take Profit: 3358 → 3354 → 3350 → 3345 → 3340 → 3330
SELL ZONE:
3380 – 3382
Stop Loss: 3386
Take Profit: 3376 → 3372 → 3368 → 3364 → 3360 → 3350
Key Takeaway:
We are at a critical stage where both bulls and bears are vying for control. Will gold bounce from the support and continue its bullish trend, or will the sellers regain control and drag prices lower? Be patient and wait for clear price action signals before entering any trades.
The market is currently in an accumulation phase, so avoid rushing into decisions. Focus on buying when clear confirmations appear at support zones and stay alert for sell rejections at key resistance levels.
Good luck with your trades!
💬 What’s Your View on Gold Today?
Do you believe gold is set to break 3390 and continue its bullish momentum?
Or are we looking at a deeper correction towards 3270 in the coming days?
👇 Share your analysis and thoughts in the comments below! We’d love to hear your take on where gold is headed next!

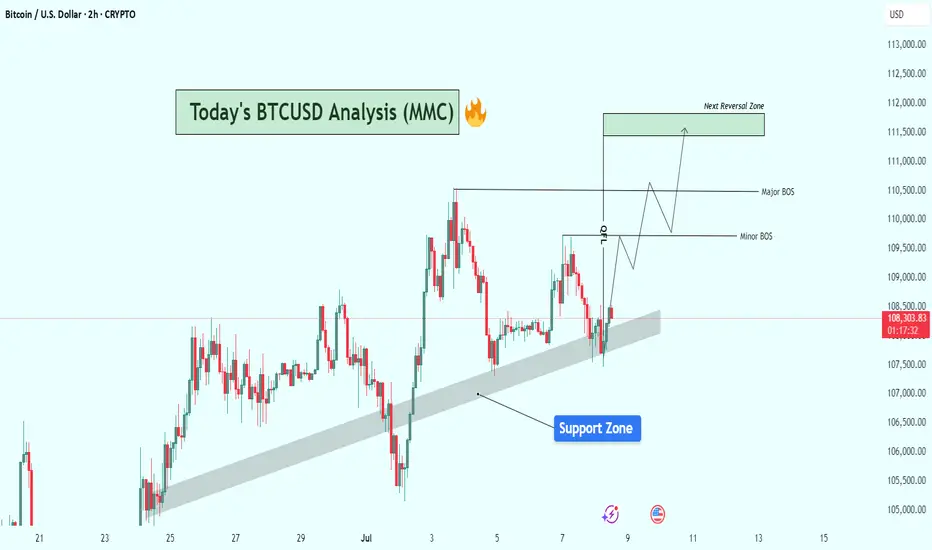
BTCUSD Structure Analysis : Bullish Zone From Support + Target🔍 Current Market Structure Overview:
Bitcoin is currently trading around $108,375, hovering just above a clearly respected rising support zone (shaded area). This dynamic support has held price multiple times and continues to act as a springboard for short-term bullish moves.
The chart illustrates a classic bullish continuation setup forming, with key structural levels marked as Minor BOS (Break of Structure) and Major BOS, indicating potential areas of trend validation and momentum acceleration.
🔹 Key Technical Elements:
✅ Support Zone:
The shaded diagonal support zone has acted as a bullish trendline base, holding up since late June.
BTC recently dipped into this area, found buyers, and is now attempting a reversal from this level.
This reinforces market interest and confirms the accumulation behavior in this zone.
⚠️ Break of Structure (BOS) Levels:
Minor BOS is marked near $109,800, signaling the first key intraday resistance.
A break above this level would signal bullish intent and open the way for price expansion.
Major BOS around $110,600–$110,800 is critical. A clean break here will likely validate a trend continuation toward the next objective.
🟩 Next Reversal Zone (Target Area):
Highlighted around $111,500–$112,000, this green zone represents a potential liquidity grab/reversal area where sellers could re-enter.
This zone aligns with previous price exhaustion levels and may trigger consolidation or a short-term pullback.
📈 Projected Price Path (Wave Schematic):
The chart outlines a wave structure projection, suggesting:
A possible retest of the minor BOS.
Follow-through into the major BOS area.
Final push into the reversal zone before potential rejection or sideways action.
🔧 Bias & Strategy:
Bias: Moderately Bullish as long as BTC respects the support zone.
Invalidation: A decisive breakdown below the trendline support and close under $107,500 would invalidate this bullish setup and shift bias to neutral/bearish short-term.
Trading Plan Ideas:
📥 Buy Opportunity: On minor dips within the support zone, targeting BOS levels.
📤 Sell Watch: Near reversal zone ($111.5K–$112K) if signs of exhaustion or bearish divergence appear.
📌 Final Notes:
BTC appears to be gearing up for a breakout from consolidation, and price action is coiling with higher lows. Market participants should watch closely how BTC reacts at the minor and major BOS zones, as they could define the next leg for either bullish continuation or rejection.
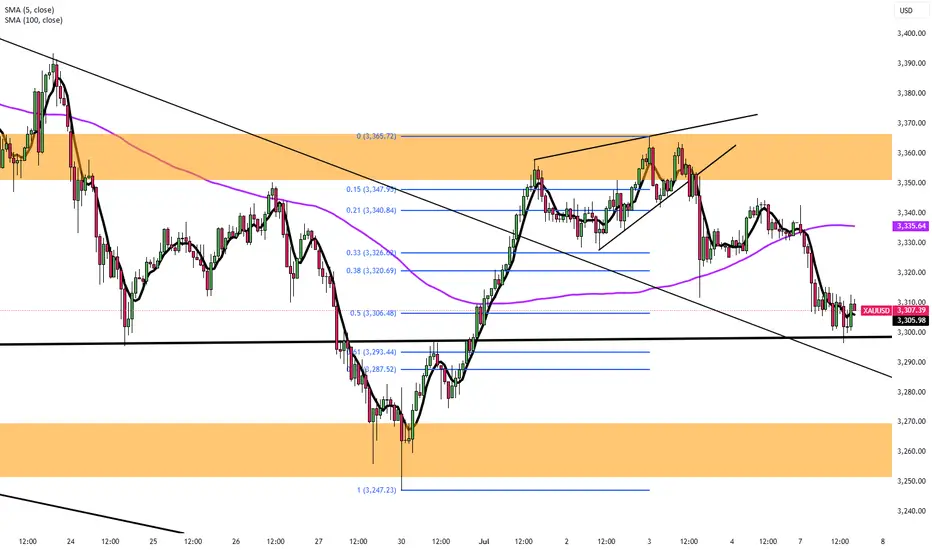
Gold (XAU/USD) Structure Analysis : Trendline Break + TargetGold is trading around $3,338, positioned at a decisive point where both bullish momentum and bearish pressure are converging. The price action over the past few weeks suggests a brewing breakout, supported by multiple technical factors. This analysis provides a complete breakdown of what’s happening and what to anticipate next based on the current structure.
🔹 Market Structure & Context
Since mid-May, XAU/USD has been trading within a rising price channel, respecting a well-defined ascending trendline support. This rising support zone has provided a floor for buyers to step in, especially during pullbacks, which demonstrates consistent buying interest and underlying bullish sentiment.
At the same time, gold has also been respecting a descending trendline resistance formed by multiple lower highs. This forms a squeeze pattern, suggesting that the market is building energy for a breakout. As price compresses within this wedge-like structure, the tension between bulls and bears grows, setting the stage for a sharp directional move.
This is a classic accumulation vs. compression scenario, where the outcome of the breakout will dictate short-to-medium-term direction.
🔹 Channel Support Zone – Buyer’s Stronghold
The channel support zone is critical here. This area, visible as a bold upward sloping line, has provided reliable support through repeated market cycles. It acts as a dynamic line where institutions and swing traders accumulate long positions during dips. The fact that price has respected this trendline for over a month signals the importance of this structure in current market psychology.
Any break below this zone would invalidate the bullish bias and open the door for a steeper decline. However, as long as price stays above this line, the buyers retain control.
🔹 Trendline Resistance – Key Barrier to Break
The descending trendline resistance, drawn from mid-June highs, has been a significant cap on upward moves. Each test of this trendline has resulted in a rejection, pushing price back into the range. Now, gold is testing this level again — and this time, the setup is stronger for a potential breakout due to growing momentum and multiple rejections weakening the resistance.
From a technical standpoint, the more a resistance level is tested, the weaker it becomes, and the higher the probability of a breakout.
🔹 Break of Structure (BOS) Zones – Momentum Confirmation
The chart marks both Minor BOS and Major BOS zones. These are crucial areas to watch for price confirmation.
The Minor BOS, just above the current price (around $3,360), represents a short-term structural shift. A clean break above this with strong candles and volume could trigger a momentum rally.
The Major BOS, located in the $3,400–$3,420 area, is more significant. This is the last major swing high. If gold manages to break and hold above this zone, it would confirm a complete bullish reversal in market structure — turning what was once a lower-high pattern into a potential new uptrend.
These BOS levels act as validation checkpoints for trend direction. Without a clean break, the move is unconfirmed and prone to reversal.
🔹 Next Reversal Zone – Anticipated Reaction Area
Above the BOS zones lies the Next Reversal Zone, marked in green. This is a potential area of resistance or profit-taking, based on historical price reactions, Fibonacci confluence, and psychological levels. This area spans approximately $3,420 to $3,440, which is where price might pause, consolidate, or reverse depending on momentum.
This zone doesn’t necessarily mean price will reverse immediately, but it’s a smart area for traders to monitor reactions or start managing their risk.
🔹 Price Action Flow – What Could Happen Next?
Currently, gold is testing both the trendline and the minor BOS, building momentum around this critical zone. There are two primary paths forward:
If gold breaks the descending trendline and confirms above the minor BOS:
Expect a move toward the major BOS at $3,400.
A successful break of this zone opens the path to the next reversal zone ($3,420–$3,440).
Bulls gain clear control and the market may attempt a sustained breakout continuation.
If gold gets rejected again at the trendline:
Price could drop back toward the channel support, between $3,280 and $3,250.
This would maintain the current consolidation range, with further testing likely before a breakout.
Bears may gain temporary control, but only a break below the ascending channel would signal a trend shift to the downside.
🔹 Why This Setup Matters
This chart captures a textbook breakout setup — compression at a trendline, rising channel support, and BOS zones layered in. These kinds of technical setups often precede strong moves because:
Volume typically increases after breakout zones are breached.
Market participants are watching the same structure, making reactions more predictable.
Risk-to-reward becomes favorable with tight invalidation points.
For disciplined traders, this is a high-probability environment to wait for confirmation and trade the reaction, not the anticipation.
🔹 Risk Management Reminder
It’s essential not to chase breakouts prematurely. Look for:
Strong bullish candles breaking key resistance.
Retests of broken trendlines turning into support.
Volume confirmation (spikes can signal genuine breakout vs. fakeout).
Also, be prepared for false breakouts, especially during overlapping macroeconomic events or low liquidity sessions.
🧭 Final Thoughts
This is a powerful confluence zone for gold, and whichever side breaks it will likely control the next leg. Whether you're a day trader or a swing trader, this is a must-watch area on your chart.
Stay alert, trade with confirmation, and respect your risk parameters.

Gold Holds Above $3,300 Amid Trade Policy UncertaintyMacro approach:
- Gold traded defensively this week, consolidating above the $3,300 level amid shifting risk sentiment and anticipation of significant trade policy developments. The yellow metal's performance was pressured by a firmer US dollar and easing geopolitical tensions, as optimism around potential trade deals and tariff suspensions reduced safe-haven demand.
- Market drivers included resilient US economic data, the Fed's cautious stance on rate cuts, and ongoing trade negotiations. The 9 Jul deadline for suspended US tariffs and President Trump's threats of new levies on BRICS countries kept investors on edge, while the release of FOMC minutes and strong NFP further dampened expectations for imminent Fed easing. Despite these headwinds, underlying concerns over US fiscal deficits and global policy uncertainty supported Gold's longer-term appeal.
- Gold may remain volatile as markets await clarity on US trade policy and the 15 July US CPI release. Both could influence Fed rate expectations and risk appetite. Any escalation in trade tensions or disappointing economic data could revive safe-haven flows into Gold.
Technical approach:
- XAUUSD consolidated within a tight range of 3285-3560, just lightly above the ascending channel's lower bound. The price is at EMA21, indicating that a bullish momentum is still intact. The market is waiting for an apparent breakout to determine the trend.
- If XAUUSD breaks above 3560, the price may retest the following resistance at 3430.
- On the contrary, closing below support at 3285 may allow Gold to retest the following support at 3165.
Analysis by: Dat Tong, Senior Financial Markets Strategist at Exness

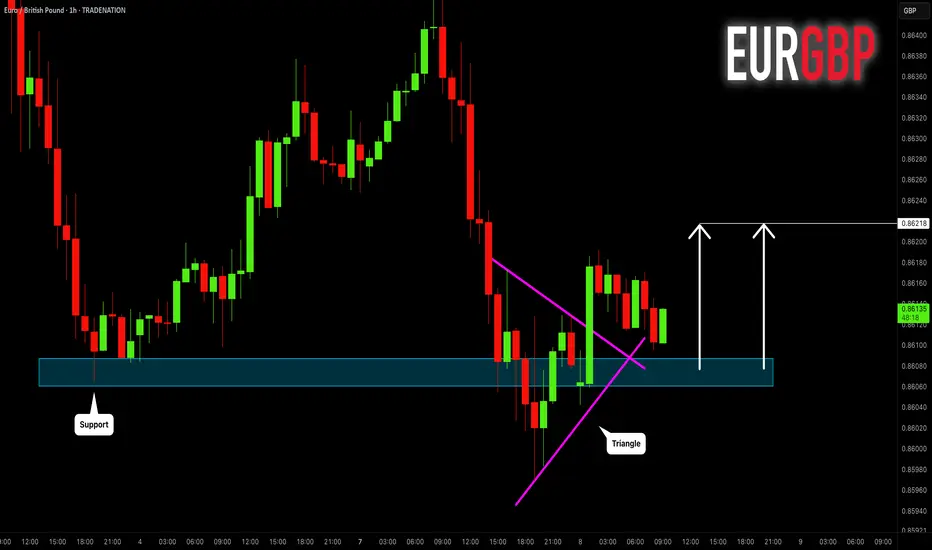
EURGBP: Bullish Move After False Breakout 🇪🇺🇬🇧
EURGBP will likely go up from a key daily/intraday support,
following a bullish breakout of a resistance line
of a bullish triangle on an hourly time frame.
The price may go up to 0.86218 level then.
❤️Please, support my work with like, thank you!❤️
I am part of Trade Nation's Influencer program and receive a monthly fee for using their TradingView charts in my analysis.
#SENSEX Intraday Support and Resistance Levels - 08/07/2025Sensex is expected to open flat today around the 83400 zone, showing no major gap or volatility at the open. The index continues to move in a tight consolidation range between 83300 and 83500. A decisive move outside this zone is likely to give direction to the market.
If the index sustains above 83500, it could lead to a bullish breakout, pushing prices towards 83700, 83800, and eventually 83950+. This breakout may indicate fresh buying interest after a prolonged sideways phase.
However, if Sensex breaches the 83300 level on the downside, it could trigger selling pressure with targets at 83050, 82900, and 82800-. Traders are advised to wait for a clear breakout or breakdown before entering any trades, as the current zone lacks momentum.

#NIFTY Intraday Support and Resistance Levels - 08/07/2025Nifty is expected to open flat with no major change in the overall levels compared to the previous session. The index continues to hover near a crucial resistance zone around 25450–25500. A breakout above 25550 will indicate bullish strength and may lead to an upward move toward 25600, 25650, and even 25750+. This zone has been tested multiple times, and a decisive break can attract further buying.
On the downside, the support remains at 25450. A break below this level can invite selling pressure, with immediate targets at 25350, 25300, and 25250-. The market is clearly respecting this consolidation band, so any directional move will depend on a confirmed breakout or breakdown from these levels.
Traders should remain cautious and avoid early entries unless a clean move is seen beyond the 25550 or below the 25450 levels.

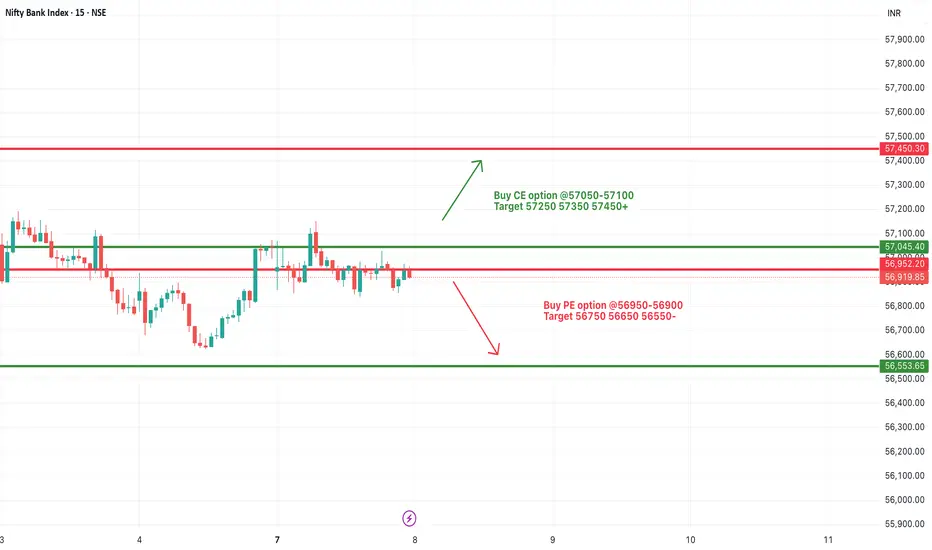
[INTRADAY] #BANKNIFTY PE & CE Levels(08/07/2025)Bank Nifty is expected to open flat with no significant change in levels compared to the previous session. The price action continues to remain within a consolidation range between 56950 and 57050. A breakout above the 57050 level could trigger bullish momentum, with potential upside targets at 57250, 57350, and 57450+. This resistance zone has been tested multiple times, and a clean breakout could attract fresh buying interest.
On the other hand, if Bank Nifty slips below the 56950–56900 support zone, it may lead to fresh selling pressure. In that case, we may see targets of 56750, 56650, and 56550 being achieved on the downside.
Since the market is currently range-bound and trading near the breakout/breakdown zones, traders are advised to stay cautious and wait for a confirmed move above 57050 or below 56950 for directional trades. Risk management is key, especially in this narrow consolidation phase.
EURUSD – Rounded Top Signals Bearish Reversal The EURUSD pair is showing clear signs of weakness after forming a rounded top pattern near the 1.18100 resistance zone. Price has broken out of a short-term sideways range and may retest the FVG area near 1.17500 before continuing its downward move.
If the support at 1.17118 is breached, EURUSD could head toward the 1.16200 level – a key demand zone on the chart. The bearish momentum is being reinforced by recent news:
Yesterday: U.S. employment data exceeded expectations, strengthening the USD.
Today: The euro is under pressure due to EU recession concerns and political instability in France.
Coming up: The FOMC minutes may continue to reflect a hawkish stance, which could further weigh on EURUSD.

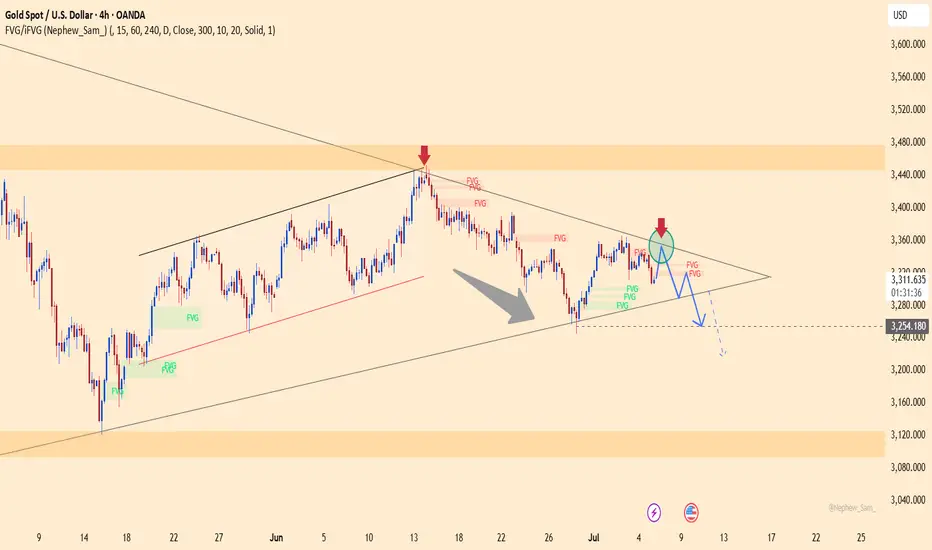
The Upper Edge Trap: Is Gold’s Breakdown Scripted?Gold is showing clear signs of weakness after being firmly rejected at the upper boundary of a symmetrical triangle around the $3,330–$3,340 zone. Sellers have regained control, pushing price toward the key support at $3,254 – a level that previously marked a short-term bottom.
If this support breaks, the bearish structure could extend further toward the $3,120 region. The downward pressure is reinforced by stronger-than-expected U.S. employment data and hawkish FOMC minutes, which have strengthened the dollar and diminished gold's appeal.
Nightly $SPY / $SPX Scenarios for July 8, 2025🔮 Nightly AMEX:SPY / SP:SPX Scenarios for July 8, 2025 🔮
🌍 Market-Moving News 🌍
📉 U.S. Stocks Slip on New Tariff Threats
President Trump announced plans to impose 25% tariffs on imports from Japan, South Korea, Malaysia, Kazakhstan, South Africa, Laos, and Myanmar starting August 1, reigniting trade jitters. The Dow fell ~0.9%, the S&P 500 dropped ~0.8%, and the Nasdaq slid ~0.9% on the news, while bond futures rallied and the dollar strengthened
⚖️ Tariff Pause Deadline Looms
Markets are focused on the July 9 deadline for the current tariff pause, which now hinges on imminent trade negotiations. Investors are balancing the risk of reimposition against progress with agreements involving the U.K., Vietnam, and Canada
💵 Consumer Credit Moderates
June’s consumer credit increase slowed to $10.60 billion vs. April’s $17.87 billion—still strong, but a cooling sign in household borrowing patterns. This tempered the dollar’s rise amid mixed signals on consumer resilience.
🛢️ Oil Drops on Rising OPEC+ Supply
Oil prices fell, with Brent dipping to ~$68.00/barrel and WTI to ~$65.30, after confirmation of OPEC+’s August supply hike—adding to bearish cues for energy stocks .
📊 Key Data Releases & Events 📊
📅 Tuesday, July 8:
3:00 PM ET – Consumer Credit (June)
Moderation in borrowing signals possible easing in consumer-driven growth.
4:30 PM ET – API Weekly Crude Inventories
A key indicator for energy markets; lower inventories lift oil prices, while builds push them down.
Throughout the Day – Tariff Pause Deadline
Market stability hinges on whether trade agreements materialize before the break expires.
⚠️ Disclaimer:
This information is for educational and informational purposes only and should not be construed as financial advice. Always consult a licensed financial advisor before making investment decisions.
📌 #trading #stockmarket #economy #tariffs #consumercredit #oil #technicalanalysis

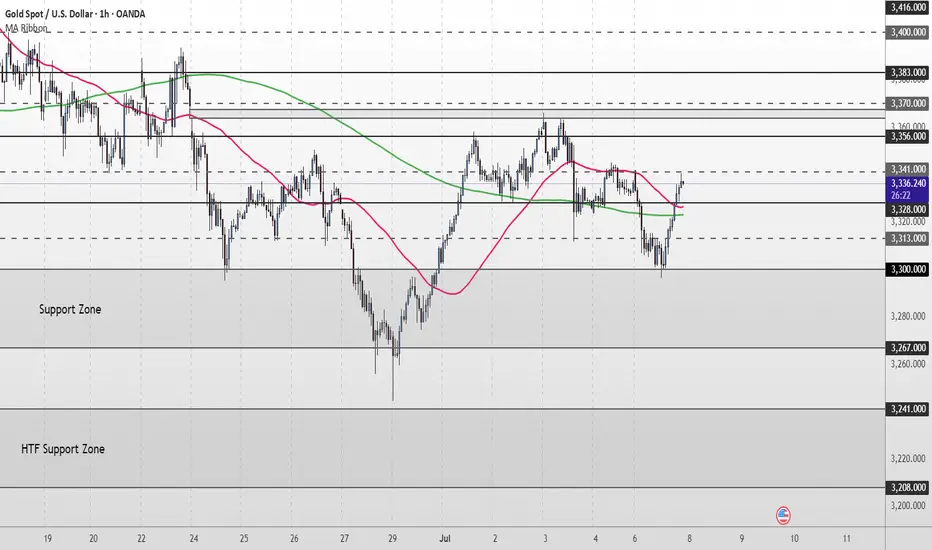
Gold Short Term OutlookGold dipped earlier in the session as the $3,328 support level failed, pushing price into the upper boundary of the broader Support Zone. From there, we’ve seen a strong bounce, with price now trending around the $3,341 minor resistance.
Price has reclaimed both the 50MA and 200MA, suggesting bullish momentum may be returning. A clean break and hold above $3,356 would likely open the path toward higher resistance levels, including $3,370 and $3,383.
However, failure to break and hold above $3,356 could lead to another pullback toward the Support Zone. If that zone fails to hold, we may see a deeper move into the higher timeframe (HTF) support area below $3,300.
📌 Key Levels to watch:
Resistance:
$3,356 ‣ $3,383 ‣ $3,400 ‣ $3,416
Support:
$3,328 ‣ $3,300 ‣ $3,267 ‣ $3,241 ‣ $3,208 (HTF Support)
USDCAD Potential UpsidesHey Traders, in tomorrow's trading session we are monitoring USDCAD for a buying opportunity around 1.35750 zone, USDCAD is trading in an uptrend and currently is in a correction phase in which it is approaching the trend at 1.35750 support and resistance area.
Trade safe, Joe.

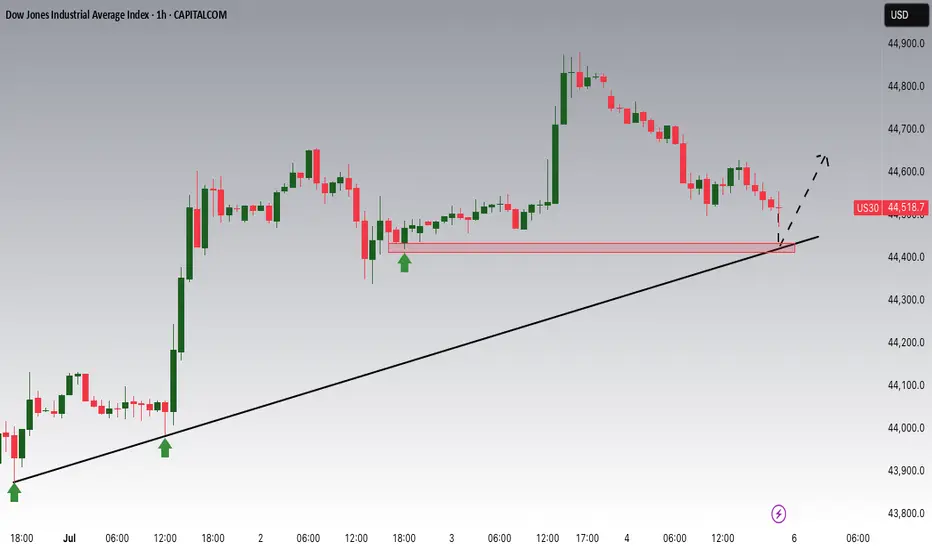
Dow Jones Potential UpsidesHey Traders, in tomorrow's trading session we are monitoring US30 for a buying opportunity around 44,400 zone, Dow Jones is trading in an uptrend and currently is in a correction phase in which it is approaching the trend 44,400 support and resistance area.
Trade safe, Joe.
$1 to $7 in minutes +488% vertical $MBIO$1 to $7 in minutes 🚀🤑
Week barely started, already sitting on +30% realized profit from 3 sniper trades NASDAQ:MBIO 2x and NYSE:WOLF

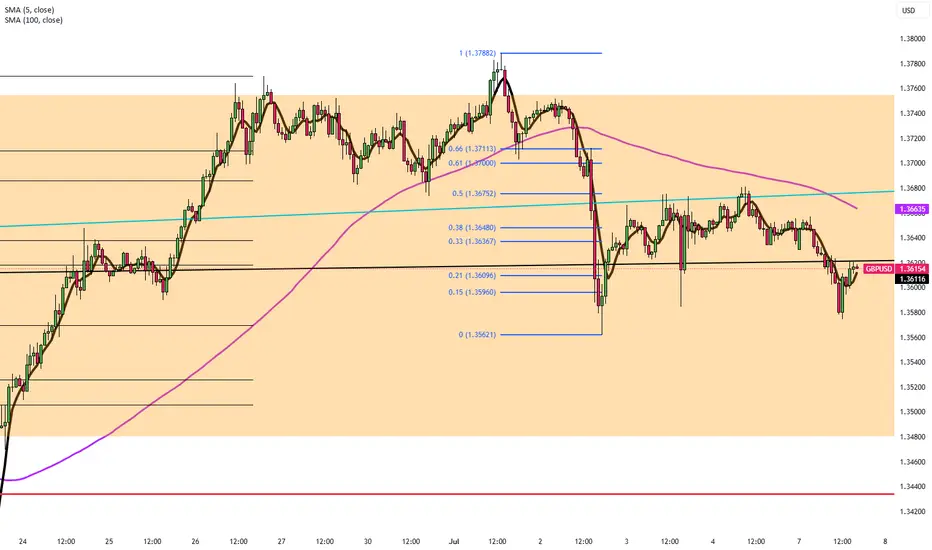
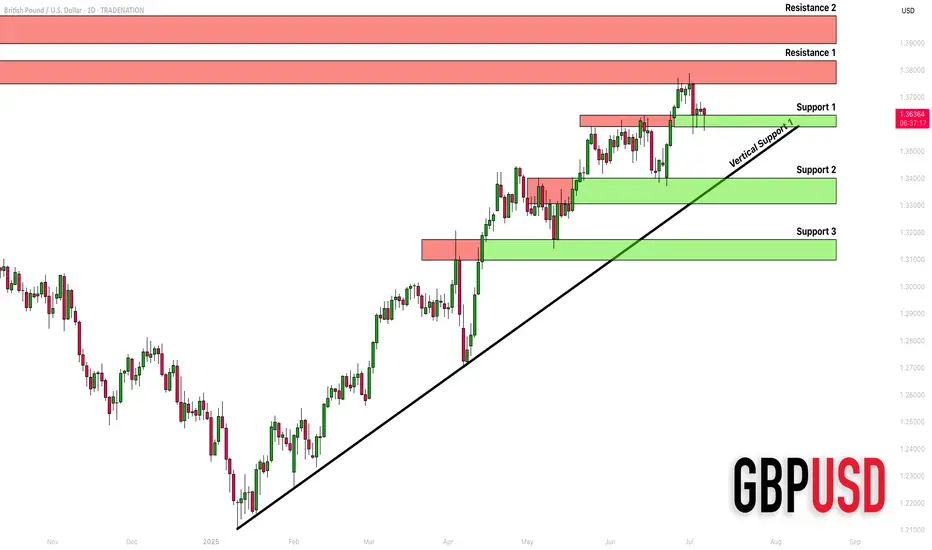
GBPUSD: Detailed Support & Resistance Analysis 🇬🇧🇺🇸
Here is my structure analysis for GBPUSD.
Horizontal Structures
Support 1: 1.3588 - 1.3633 area
Support 2: 1.3305 - 1.3400 area
Support 3: 1.3097 - 1.3175 area
Resistance 1: 1.3748 - 1.3835 area
Resistance 2: 1.3900 - 1.3400 area
Vertical Structures
Vertical Support 1: rising trend line
Consider these structures for pullback/breakout trading.
❤️Please, support my work with like, thank you!❤️
I am part of Trade Nation's Influencer program and receive a monthly fee for using their TradingView charts in my analysis.
XRP is ready ?XRP has been consolidating since last high from Jan this year. MACD shows that the momentum is picking up and I see it is ready for next move.
A weekly close will confirm it.

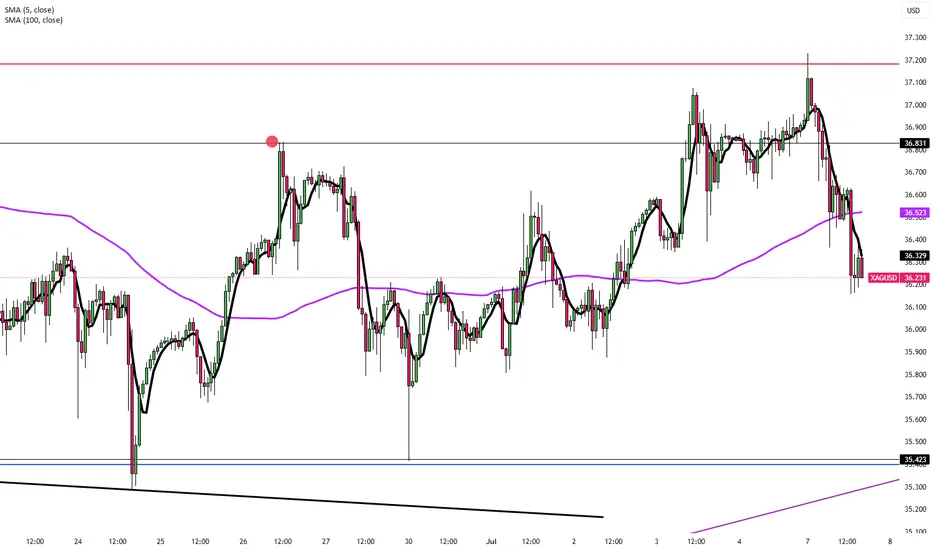
Silver Holds Near 13-Year High Amid Tariff UncertaintySilver held above $36.80 Friday, near 13-year highs, as renewed trade tensions supported safe-haven demand. Markets grew cautious after Trump announced plans to send tariff letters, and as the House passed his tax and spending bill, expected to widen the deficit by over $3 trillion. Silver’s gains were capped by a surprisingly stronger June US jobs report, which eased recession fears and reduced near-term Fed rate cut pressure.
Resistance is at 37.50, while support holds at 35.40.
Gold Recovers After Two-Week DeclineGold Recovers After Two-Week Decline
Gold rose slightly to around $3,330 on Friday, set for a weekly gain as US deficit worries and tariff uncertainties increased safe-haven demand. The House passed Trump’s tax and spending cuts, expected to add over $3 trillion to the deficit in ten years. Trump also said he would begin issuing formal tariff notices Friday. Gold’s gains were capped by strong US jobs data, with 147,000 jobs added in June and unemployment falling to 4.1%, supporting the Fed’s current rate stance.
Gold is on track to end the week up over 1%, recovering after two weeks of declines.
Resistance is at $3,365, while support holds at $3,300.
Pound Holds Gains on UK Fiscal StabilityGBP/USD held around 1.3660 during Friday’s Asian session, marking a second day of consolidation as the dollar weakened on caution over Trump’s planned tariffs. Trump said he would start sending tariff letters Friday, targeting ten countries with rates of 20–30%. The pound was supported after PM Starmer backed Chancellor Reeves, easing market concerns over a possible replacement with looser fiscal policies.
The BoE is expected to cut rates in August, likely to 4%, following dovish signals from officials, including Governor Bailey, who said rates should gradually decline as inflation eases.
Resistance is at 1.3700, while support holds at 1.3600.