CRUDE OIL (WTI): Move Up Ahead!
Last week, I already shared a bullish setup on WTI Crude Oil
on a daily time frame.
I see a strong intraday bullish confirmation today.
After a test of an underlined blue support area,
the price went up strongly and violated a resistance line
of a bullish flag pattern on a 4H time frame.
The market is going to rise more.
Goal - 68.2
❤️Please, support my work with like, thank you!❤️
I am part of Trade Nation's Influencer program and receive a monthly fee for using their TradingView charts in my analysis.
Technical Analysis

Bullish Breakout Anticipation on Gold (XAU/USD)Bullish Breakout Anticipation on Gold (XAU/USD)
On the 30-minute chart, Gold is forming a classic falling wedge pattern, typically seen as a bullish reversal setup. We've just touched the lower support trendline, and early breakout signs are emerging.
📍 Entry: 3,309.500
🎯 Target: 3,335.500
🛑 Stop Loss: 3,299.000
The risk-to-reward ratio looks favorable, and a breakout above the wedge resistance could push price towards the 3,335+ region. Let’s watch for confirmation and volume on breakout.
👇 Drop your thoughts below and let’s discuss!
✅ If you find this analysis helpful, please support by giving a like and following — your support means a lot! 🙌 🟡

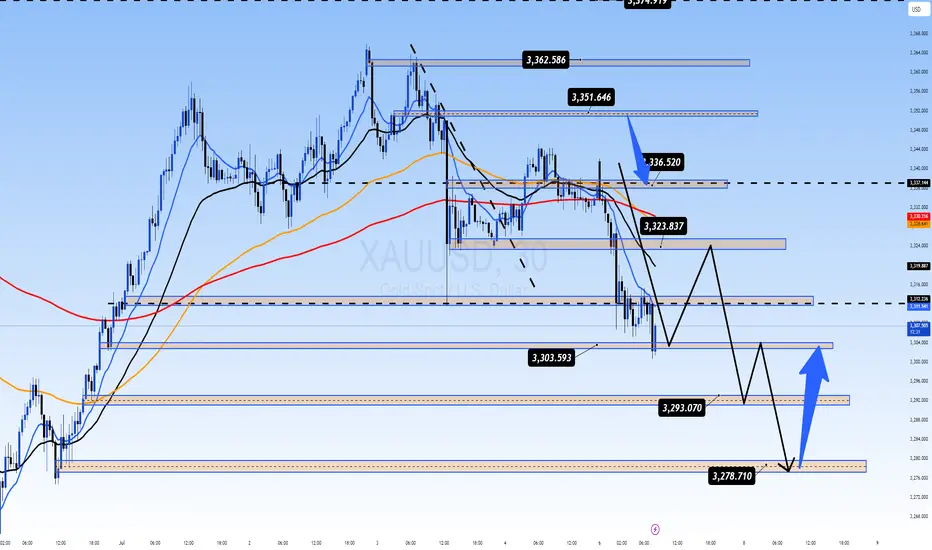
XAUUSD Below 3300 – Buying Opportunity or Trap? Gold Breaks Below 3300 – A Buying Opportunity or Sign of Deeper Correction?
🧭 Weekly Kickoff: Is the Sell-off Really That Dangerous?
At the start of the week, gold experienced a sharp drop to 3306 USD, breaking through the psychological 3300 support level and testing the 329x region. However, this isn't necessarily a sign of a sustainable downtrend — it's more likely a liquidity sweep before the market consolidates again for a bigger move.
🌐 Macro Updates Impacting Gold:
US inflation continues to ease, providing space for the Fed to loosen policy if needed.
FOMC minutes due soon — markets will be closely watching for clues about possible rate cuts.
Tensions in Gaza de-escalate temporarily, leading to a slight reduction in demand for safe-haven assets.
Trump's new tax bill has been passed, adding pressure to US public debt.
US–China trade war may be delayed — reducing short-term geopolitical pressure.
In summary, we are in a consolidation phase, with a high probability of a breakout in the coming days.
📉 Technical Analysis – CP Pattern in Focus
We are seeing a Continuation Pattern (CP), which generally signals that the current correction is a pause before the trend continues.
After rejecting resistance at 3336, gold fell, breaking through the 3323 support and quickly testing the 3303 zone, a key short-term support.
If gold breaks below 3293, the next target will be the 3278 USD liquidity zone, where strong buying could emerge.
📌 Key Trading Plan – 04 July
🔵 BUY ZONE
3294 – 3292
Stop Loss: 3288
Take Profit: 3298 → 3302 → 3306 → 3310 → 3315 → 3320 → 3330
🔴 SELL SCALP
3324 – 3326
Stop Loss: 3330
Take Profit: 3320 → 3316 → 3312 → 3308 → 3304 → 3300
🔴 SELL ZONE
3350 – 3352
Stop Loss: 3356
Take Profit: 3346 → 3340 → 3335 → 3330 → 3320
🧠 Market Sentiment Today
The market is currently in a consolidation phase, likely trading sideways between 3320 and 3340. A breakout seems likely once the liquidity from the US holiday subsides.
✅ Primary Bias: Look to buy dips into support zones.
⚠️ Alternative View: Only consider selling if price clearly rejects key resistance levels.
💬 What’s Your View on Gold Today?
Do you think gold will break through 3390 soon, or is there more room for a deeper correction towards 3270?
👇 Share your thoughts and analysis in the comments below!
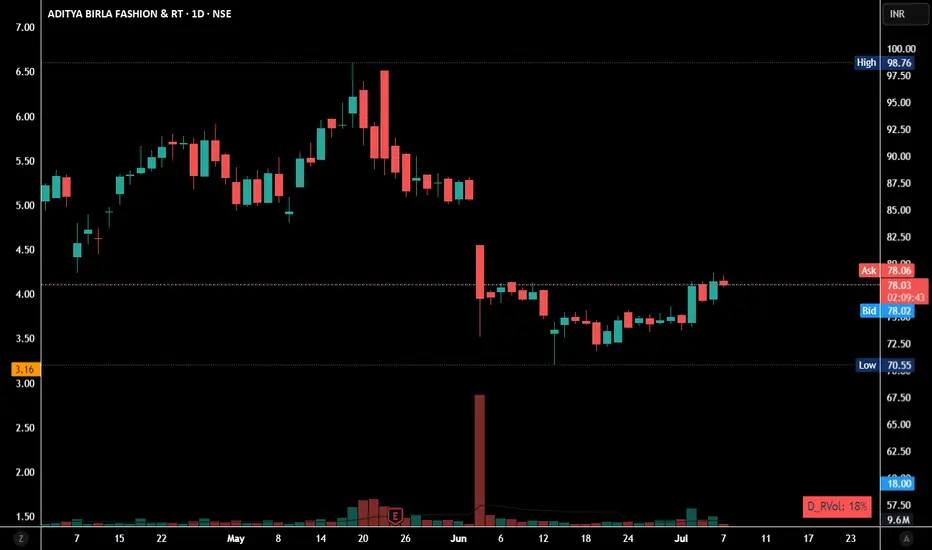
Rising Institutional Buying
Rising Institutional buying has been seen in this stock. This quarter is full of their accumulation it seems. It'll be interesting to see whether it holds 80-90 level.
Chart is for educational purpose, not a Buy/Sell Reco.
CADJPY: Bullish Move From Support Confirmed?! 🇨🇦🇯🇵
CADJPY may bounce from a key daily horizontal support cluster.
As a confirmation signal, I spotted a bullish imbalance candle
on a 4H time frame after its deep test.
I expect a pullback to 106.65
❤️Please, support my work with like, thank you!❤️
I am part of Trade Nation's Influencer program and receive a monthly fee for using their TradingView charts in my analysis.

XAUUSD – Clear Sideways Movement in a Narrow Price ChannelXAUUSD is moving within a parallel price channel, fluctuating between the 3,320–3,345 zone. Both the EMA 34 and EMA 89 are running flat and close together, indicating a balanced market with no strong momentum in either direction.
Recent highs and lows have formed within a narrow range, reflecting indecision from both buyers and sellers. The latest bounce also stalled at the channel resistance, lacking the strength to break out.
As long as price remains below 3,345 and above 3,320, the sideways trend is likely to continue. During this phase, a range-trading strategy is preferred – selling near the top, buying near the bottom – while waiting for a clear breakout to determine the next directional move.

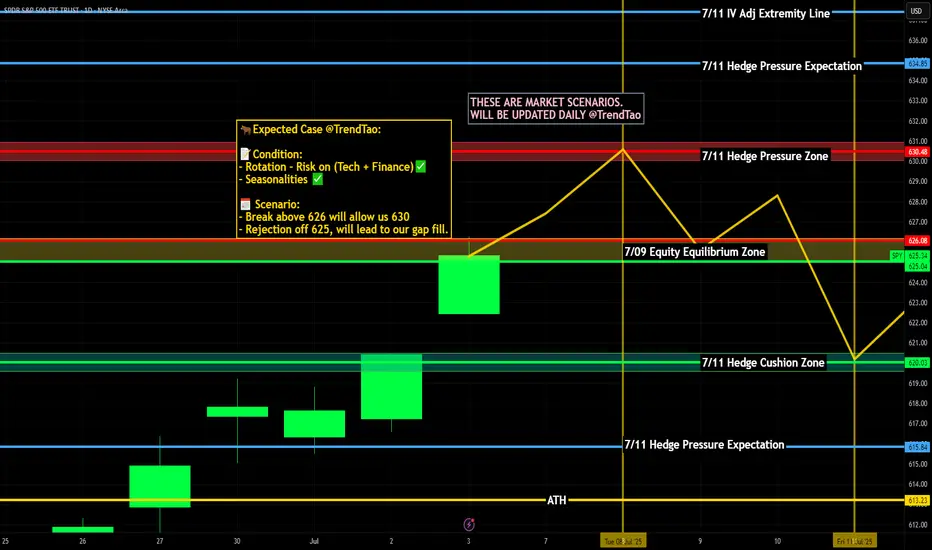
Weekly $SPY / $SPX Scenarios for July 7–11, 2025🔮 Weekly AMEX:SPY / SP:SPX Scenarios for July 7–11, 2025 🔮
🌍 Market‑Moving News 🌍
📈 From Panic to "Goldilocks" Rally
The S&P 500 and Nasdaq hit fresh record highs, surging ~20% from April lows. Markets rallied on a combination of easing Middle East tensions, the 90‑day tariff pause, a new fiscal bill in Washington, and strong June jobs data. Still, strategists caution that optimism may be ahead of fundamentals, especially if trade volatility returns
💱 Dollar Weakness & Bond Market Watch
The U.S. dollar remains near 3.5‑year lows amid rate‑cut speculation and trade progress. Treasury yields are volatile this week, impacted by concerns over escalating debt issuance, upcoming tariff deadlines (July 9), and the Federal Reserve’s stance .
🏢 Tech Leadership Shifts
With the “Magnificent Seven” tech stocks near heights, growth is spreading: cyclical sectors, small‑caps, and industrials are gaining momentum. AI remains the primary engine, but resilience across a broader stock base is signaling a potentially sustainable rally
⚠️ Tariff Truce Deadline Looms (July 9)
The April tariff pause expires mid‑week. U.S. plans to extend exemptions via trade talks with partners like UK, Vietnam, and Canada—yet any delay or failure may shock markets. Watch for headlines that may trigger spillover effects .
📊 Key Data Releases & Events 📊
📅 Monday, July 7:
Independence Day markets resume. Light trading expected ahead of data and tariff deadline.
📅 Tuesday, July 8:
10:00 AM ET – Consumer Credit (June)
Gauges borrowing trends—an indicator of household health in a low‑rate environment.
📅 Wednesday, July 9:
EIA Crude Oil Inventories & MBA Mortgage Apps & Wholesale Inventories
Key mid‑week data points; oil builds may pressure energy stocks.
Tariff Pause Deadline – Expect market volatility on news of extension or reimposition.
📅 Thursday, July 10:
8:30 AM ET – Initial & Continuing Jobless Claims
10:00 AM ET – Natural Gas Inventories
Markets focus on labor health and energy trends.
📅 Friday, July 11:
10:00 AM ET – Treasury Budget Statement
Details on government borrowing and fiscal outlook—markets sensitive to deficit risks.
⚠️ Disclaimer:
These insights are for educational purposes only—not financial advice. Consult a licensed advisor before making investing decisions.
📌 #trading #stockmarket #economy #news #tariffs #Fed #AI #technicalanalysis
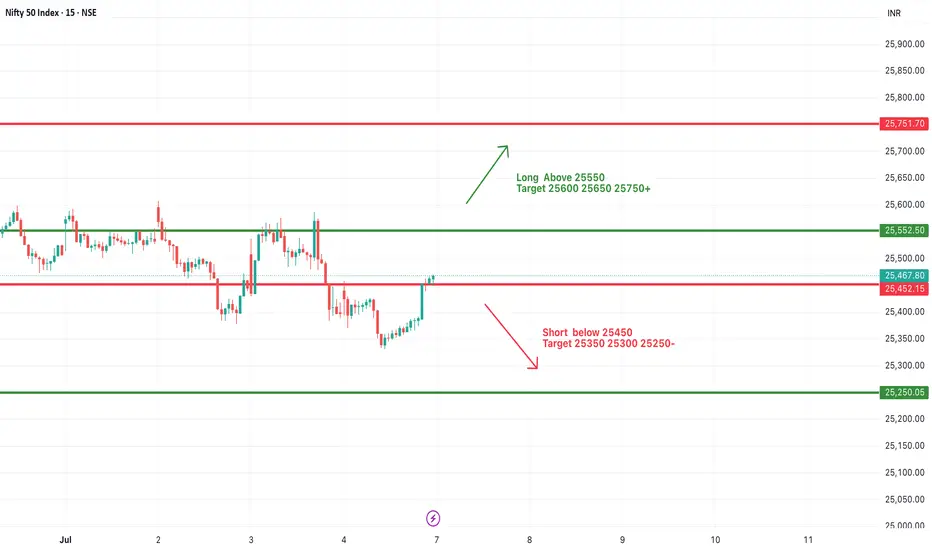
#NIFTY Intraday Support and Resistance Levels - 07/07/2025Nifty is expected to open flat near the 25450–25500 zone, which lies close to an important decision area. If Nifty manages to sustain above the 25550 level, we can expect bullish momentum to resume with upside targets of 25600, 25650, and possibly 25750+. This level marks a potential breakout zone, and holding above it could bring back buyers’ interest.
On the downside, a breakdown below 25450 may trigger fresh selling pressure, leading to downside targets of 25350, 25300, and 25250. The 25450 level has acted as both a support and resistance in recent sessions, making it a key pivot point for intraday direction.
Traders should be patient and wait for a clear breakout or breakdown above or below these levels. Volatility may be witnessed around the opening range, so it's advisable to trade with strict stop losses and manage risk through partial profit booking near targets.
An Inverted head and shoulder pattern gives opportunity-ForexBDAn inverted head and shoulders pattern has formed on the GBPAUD D-1 timeframe. The market has formed a second shoulder, so if the price goes up and breaks the neckline or resistance line, the market will go into an uptrend.
⭕️Risk Warning : Trading on financial markets carries risks!
©FXBD Official Team

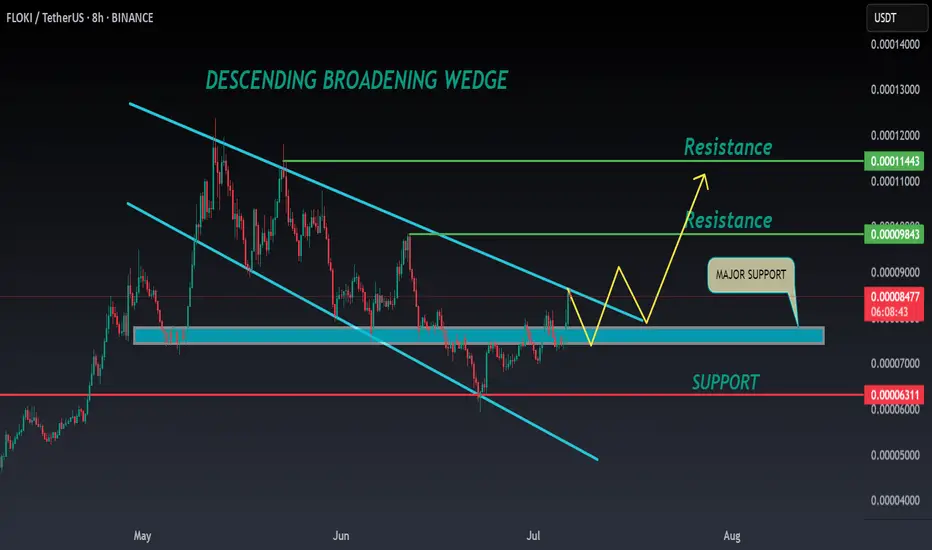
FLOKI ANALYSIS🔮 #FLOKI Analysis 🚀🚀
💲💲 #FLOKI was trading in a Descending Broadening Wedge Pattern, and trying to breakout the pattern. Also there is a instant support zone and after the breakout of resistance zone we will see a bullish move. 📈📈
💸Current Price -- $0.00008540
📈Target Price -- $0.00009840
⁉️ What to do?
- We have marked crucial levels in the chart . We can trade according to the chart and make some profits. 🚀💸
#FLOKI #Cryptocurrency #Breakout #DYOR
Apple Is Climbing the Fibonacci Channel Ladder – Step 5 Ahead?On the monthly chart, Apple (AAPL) is steadily moving within a well-defined ascending Fibonacci channel, like climbing a ladder — step by step.
The price is currently testing Step 4 , a zone that has acted as a strong resistance barrier.
Despite the pressure here, the structure still appears bullish, and even a minor pullback might simply be a pause before the next move.
If momentum picks up, we could soon see a breakout toward the next step — targeting 234 at Step 5.
The trend remains technically intact unless the channel is broken, and the overall formation still leans toward continuation.

EURUSD: Support & Resistance Analysis For Next Week 🇪🇺🇺🇸
Here is my recent structure analysis and important
supports and resistances for EURUSD for next week.
Consider these structures for pullback/breakout trading.
❤️Please, support my work with like, thank you!❤️
I am part of Trade Nation's Influencer program and receive a monthly fee for using their TradingView charts in my analysis.

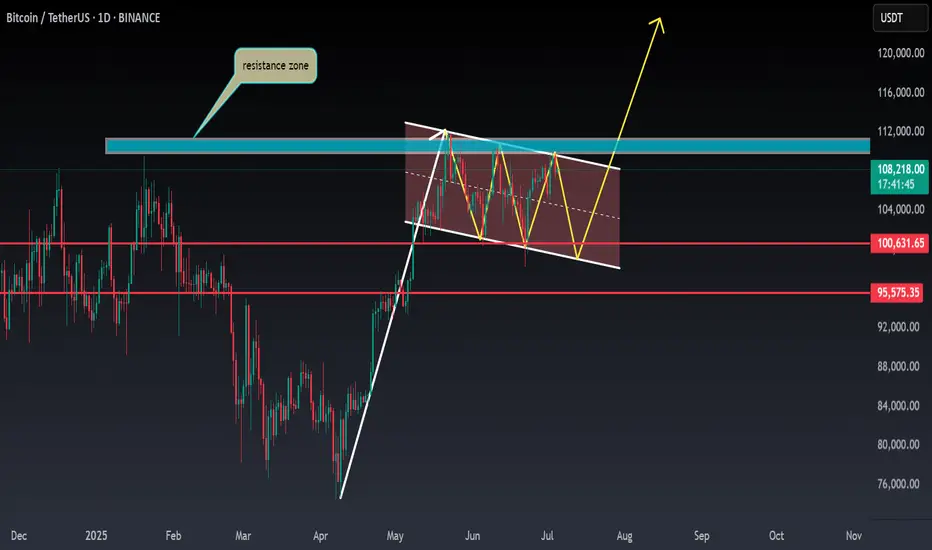
BTC ANALYSIS🌸#BTC Analysis : Bullish Trend 🚀🚀
🚀As we can see that there is a formation of Flag & Pole Pattern in #BTC in daily time frame. Right now we can see that #BTC again retest from the resistance zone and we can see a bounce back from its support zone 💪
🔖 Current Price: $1,08,050
⏳ Target Price: $1,20,000
⁉️ What to do?
- We can trade according to the #BTC chart and make some profits. Keep your eyes on chart price action, observe trading volume. Always observe market sentiments and update yourself everyday.🔰🔰
#BTC #Cryptocurrency #Breakout #TechnicalAnalysis #DYOR
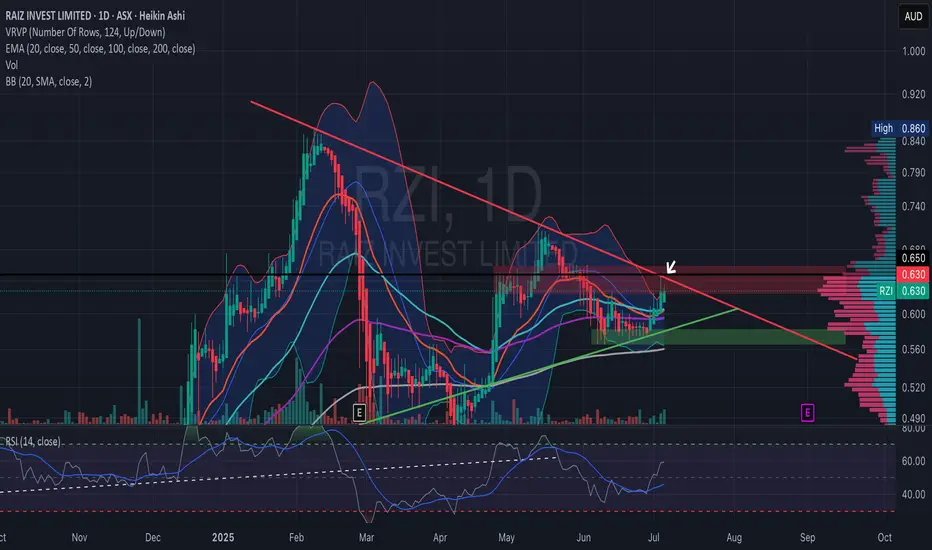
RZI Bullish BreakoutThe price is currently testing resistance around 0.63, after rising from 0.575. The volume profile indicates high activity around 0.58-0.62, showing strong interest.
The EMAs reflect a bullish shift, with the 20 EMA approaching a crossover above the 50 EMA.
After a period of squeeze inside the triangle, the bands are beginning to open.
The RSI is neutral to bullish, trending upward around 50. Overall, the chart suggests a potential breakout. No clear over-bought yet, there is room to run if bulls stay in control.
Key Scenarios
Bullish Breakout: A daily close above the red trendline + A$0.63–0.65 resistance zone would confirm.
First target: A$0.70–0.72 (next volume-profile “valley” and previous swing highs)
Secondary: A$0.80+ (upper Bollinger band confluence from the Feb top)
False Break / Rejection:
Look for a swift pullback into the green ascending line (~A$0.60) or the broader support box around A$0.57–0.58.
Watch EMAs for signs of rolling over (20 EMA crossing back below 50 EMA would turn neutral-to-bearish).
BTC monthly yelling at us for something interesting ?We read daily news about ETF, accumulation by institutes and scarcity in the exchanges, but I recognize something different in the chart based on multiple indicators. Historically, BTC boomed after touching 50 EMA and whenever it is extended it traces back to 50 EMA on monthly chart. As per current data, BTC is extended far from it. Also RSI and MACD indicating that it is losing momentum with -ve divergence. Volume as well descreasing since last leg, though price moved up. So, I expect price to retrace to 50 EMA which coincides with previous high at 60K. Let us see how it unfolds.

$SNAP -- accumulation $8 into $9. big move brewing into earningsHello, extensive chart here: Daily and Weekly. Looking at this name I like the setup here. The Daily and Weekly chart shows strength in this area, $8 to $9 with heavy accumulation and support. The Weekly chart shows about 13 weeks of this bottoming area with tons of buying from previous years as well. NYSE:SNAP has earnings July 25th and I will be looking to enter $10 calls with a date of 8/15. The premiums could spike just into earnings since it is a popular name to play around that time and it has plenty of daily volume. The SMA and EMA on the weekly honestly is my target -- it is a big sell zone. We are in the liquidity area and have been. Will be starting a position on these contracts this coming week. This name should see $10 with relative strength but my first target is mid $12 before earnings. I would like to shed some contracts into the earnings date and see if we can make an extra buck or two on profited contracts so when earnings comes it can be a risk free stress free play.
WSL.

Dow Could Be Gearing Up for a Run Toward 50,000We’ve seen it before—and we might be seeing it again . The Dow Jones is showing a familiar pattern, and here’s what’s happening:
The index has been repeatedly hitting the 1.618 Fibonacci extension from previous ranges.
Right now, we’re approaching the 100% extension between the last swing high (~45,000) and swing low (~36,600).
If the Dow breaks above that previous high at 45,000, there's a good chance we’ll see the pattern repeat—with 50,000 as the next target.
It’s all about that breakout confirmation. Until then, we watch and wait.
This market has a memory—let’s see if it chooses to repeat it again.

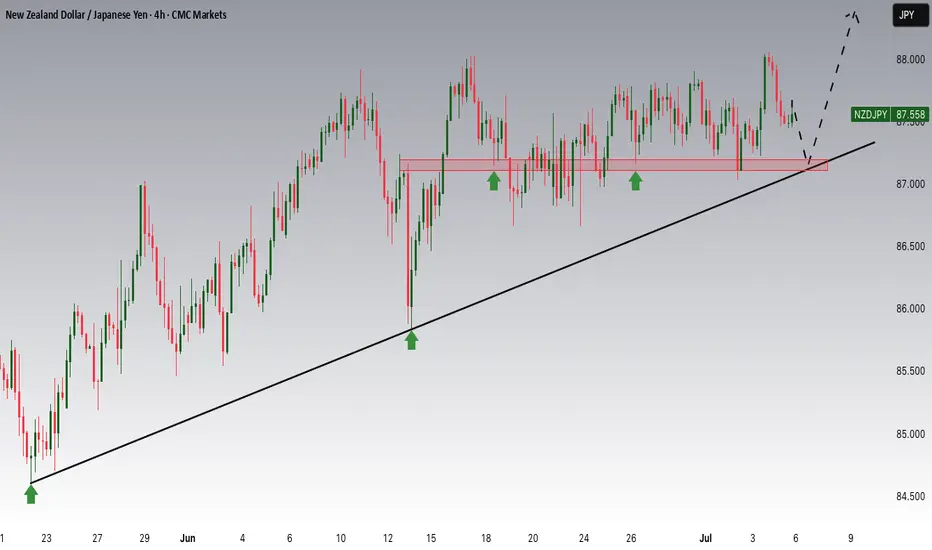
NZDJPY Potential UpsidesHey Traders, in the coming week we are monitoring NZDJPY for a buying opportunity around 87.200 zone, NZDJPY is trading in an uptrend and currently is in a correction phase in which it is approaching the trend at 87.200 support and resistance area.
Trade safe, Joe.
EURJPY: Bullish Outlook Explained 🇪🇺🇯🇵
There is a high chance that EURJPY will continue rising
from an underlined horizontal support.
I see 2 strong price action confirmations:
the price violated a resistance line of a bullish flag
and a neckline of a double bottom pattern.
Goal - 170.4
❤️Please, support my work with like, thank you!❤️
I am part of Trade Nation's Influencer program and receive a monthly fee for using their TradingView charts in my analysis.

My Ideal Elliott Wave Entry ModelThe IMSETT 3/C Entry Model.
Every trader wants to catch the big moves the ones that pay quickly and decisively. In Elliott Wave, those moves often come during Wave 3. It's the strongest part of the trend, and when you're positioned early, the risk-to-reward is unmatched.
But not every opportunity hands you a clean Wave 3 on a silver platter. Sometimes you’re looking at a Wave C instead. That’s where the 3/C Entry Model comes in. It’s designed to get you aligned with high-conviction moves—whether the market is in a trend or a zig zag.
Here’s the edge: both Wave 3 and Wave C often start the same way—a strong, motive push off an AOI (area of interest), followed by a retracement. That shared structure gives us an anchor. Whether we’re labeling it a 3 or a C doesn’t change the fact that the initial impulse gives us clarity, direction, and a place to manage risk.
That’s what the IMSETT Model is built around:
Identify
Motive
Scout
Entry Plan
Track
Trade
Each step is focused, actionable, and repeatable. You're not trying to outguess the market—you’re reacting to structure, preparing for common behavior, and executing with intent.
I do have a video with a walk through.
This just the way I look for clarity in setups. As with everything in trading, nothing will work every time so do your own research this is not financial advice.
Cheers!
Trade Safe, Trade Clarity.

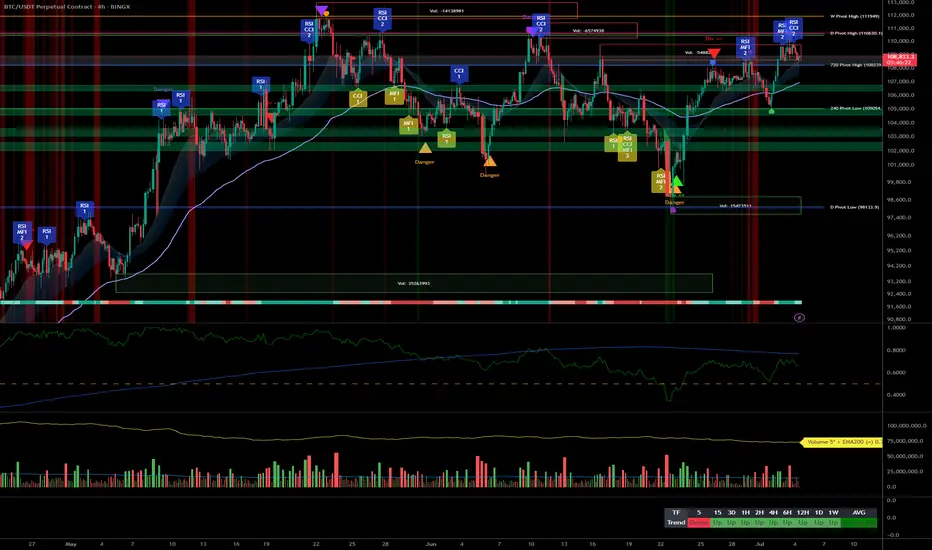
Bitcoin Analysis: Risk under 108k, aiming 111k+ in continuation__________________________________________________________________________________
Technical Overview – Summary Points
__________________________________________________________________________________
Momentum: Strong uptrend across all major timeframes (MTFTI “up”). Buyers remain in control; daily/4H/1H structure robust.
Key supports: 108,239.1 (720min Pivot, critical transversal support), 105,054.7 (240min Pivot), 99,581 (240min Pivot). Active defense seen on 108,239.1 at all timeframes.
Main resistances: 110,630.1 (1D), 110,483.1 (240min), 111,949 (W). The 110–111k area acts as the short-term ceiling.
Volume: Moderate activity, no spikes or climaxes, slight intensification noted on the 30min during key tests.
Risk On / Risk Off Indicator: “STRONG BUY” signal on all Tfs ≥30min, contributing to marked bullish momentum. Minor short-term divergence only on 15min.
Multi-TF behavior: ISPD DIV and Investor Satisfaction are neutral, no extreme behavioral stress; psychology is balanced, neither panic nor euphoria.
__________________________________________________________________________________
Strategic Summary
__________________________________________________________________________________
Overall bias: Bullish, synchronized multi-timeframes, dominant bullish liquidity.
Opportunities: Optimal long entries on validated pullback to 108,239.1, add on breakout of 110,630–111,949. Gradual partial take profit recommended in the 111k area.
Risk zones: Invalidation below 108,239.1 (confirmed H2 close), risk of further correction toward 105k then 99.5k; suggested swing stop under 108,000.
Macro catalysts: No major event, global markets stable. Geopolitical tensions monitored, low short-term impact.
Action plan: Prioritize “buy the dip” on pivots, active monitoring for any breakout/failure. Dynamic stop management, partial profit-taking on extension.
__________________________________________________________________________________
Multi-Timeframe Analysis
__________________________________________________________________________________
1D: Very strong daily structure, high momentum, intermediate supports near 98k/100.5k. Watch for major resistances at 108–111k.
12H/6H/4H: Ranging below 110–111k resistance, no fragility. Supports 108,239.1 and 105,054.7 holding, no selling pressure detected. Watch for breakout/impulse.
2H/1H: Buy zone if maintained >108,239.1, risk of sell-off below this pivot toward 105k. Price is ranging, momentum remains positive.
30min/15min: Consolidation on supports. 15min: temporary divergence on the Risk On / Risk Off Indicator but bullish structure intact unless a clean break below 108,239.1.
Risk On / Risk Off summaries: Dominant “strong buy” tone, synchronized momentum, only weak short-term divergence. No behavioral stress (ISPD DIV neutral everywhere).
__________________________________________________________________________________
Cross-analysis and recommendations
__________________________________________________________________________________
Momentum: Bullish environment sustained as long as >108,239.1. Continued upside bias if breakout above 110–111k is confirmed.
Risks: No major vulnerabilities detected. Very low probability of a local top, except in the case of exogenous macro shock.
Macro & On-chain: Stable newsflow, no distribution from HODLers or significant new inflows. Preferred strategy: swing trading in trend direction, tight stop under the main pivot.
__________________________________________________________________________________
Decision summary
__________________________________________________________________________________
Preferred scenario: Hold long >108,239.1, add on validated pullback, look for breakout with volume extension to 111k+.
Risk management: Stop under 108,000, partial profit-taking in the 110,630–111,949 area.
No immediate macro constraints: Use this calm window to ride the trend.
Monitoring: Resilience of the main support, any sudden geopolitical shocks.
BTC/USDT keeps a clear bullish bias, favoring swing or trend-following strategies as long as key pivots hold. Buy the dips remains optimal while technical structure holds; strict stop management is advised pending any “breakout fail”.
CRUDEOIL1! at Best Support Zone !!This is the Daily Chart of CRUDEOIL1!.
CRUDEOIL1! having a good law of polarity at 5500-5600 level .
CRUDEOIL1! is currently trading between its quarterly pivot 5603 level and monthly pivot 5805 levels , indicating a range-bound movement."
Once the Crudeoil1! sustains above the monthly pivot, it may trigger a potential upside rally."
If this lop is sustain , then we may see higher prices in CRUDEOIL1!
Thank You !!

Gold Consolidating Ahead of Next Move Gold Consolidating Ahead of Next Move – Is 3390 the Bull Target or a False Breakout Trap?
🧭 Fundamental Outlook
Gold has entered a tight consolidation phase following a wave of high-impact macroeconomic events:
The US House of Representatives has passed Trump's “Super Bill”, raising expectations of increased fiscal spending and long-term inflationary pressures. In theory, this is supportive of gold prices.
However, strong NFP and Unemployment Rate figures released recently have reinforced dollar strength in the short term, suggesting the Fed may delay rate cuts → a temporary headwind for gold.
With Independence Day in the US, liquidity across global markets is expected to drop, increasing the risk of false moves or stop-hunt volatility.
🟡 The lack of immediate upside doesn’t mean bullish momentum has disappeared. Price may simply be building energy before its next leg.
📉 Technical Overview – XAU/USD
Gold has broken out of a minor descending trendline and is now testing a key supply zone around 3344–3345, which could determine the intraday trajectory.
🔍 Key Levels
Resistance Zones: 3345 – 3362 – 3374 – 3388 – 3390
Support Zones: 3330 – 3312 – 3304 – 3302 – 3298
🟢 Bullish Scenarios (Buy Setups)
📍 Intraday Buy Zone:
3313 – 3311
Stop Loss: 3307
Take Profit: 3316 – 3320 – 3325 – 3330 – 3335 – 3340 – 3345 – 3350
📍 Deep Pullback Buy Zone:
3304 – 3302
Stop Loss: 3298
Take Profit: 3308 – 3312 – 3316 – 3320 – 3330 – 3340
These zones are ideal for trend-continuation entries, especially if supported by bullish candles or price action on lower timeframes.
🔴 Bearish Scenarios (Short-Term Only)
📍 Intraday Sell Zone:
3362 – 3364
Stop Loss: 3368
Take Profit: 3358 – 3354 – 3350 – 3346 – 3340 – 3335 – 3330
📍 High-Risk Sell Zone:
3388 – 3390
Stop Loss: 3394
Take Profit: 3384 – 3380 – 3376 – 3370 – 3365 – 3360
Bearish positions should be reserved for signs of exhaustion or rejection patterns at resistance levels.
🧠 Trading Bias for Today
With limited liquidity due to the US holiday, price may remain trapped in a sideways range between 3320 and 3340. Traders should stay nimble and avoid overexposure.
✅ Primary bias: Buy dips near major support
⚠️ Alternative view: Only short if price confirms reversal at resistance
💬 What’s Your Take on Gold Today?
Will gold break through the 3390 barrier this week?
Or are we looking at one more dip before a true bullish continuation?
👇 Share your thoughts and trading ideas in the comments!
