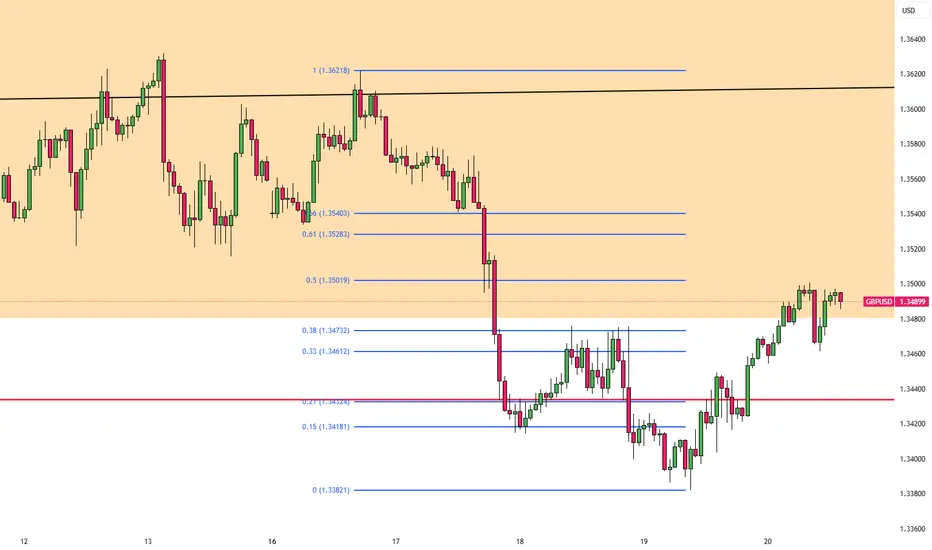
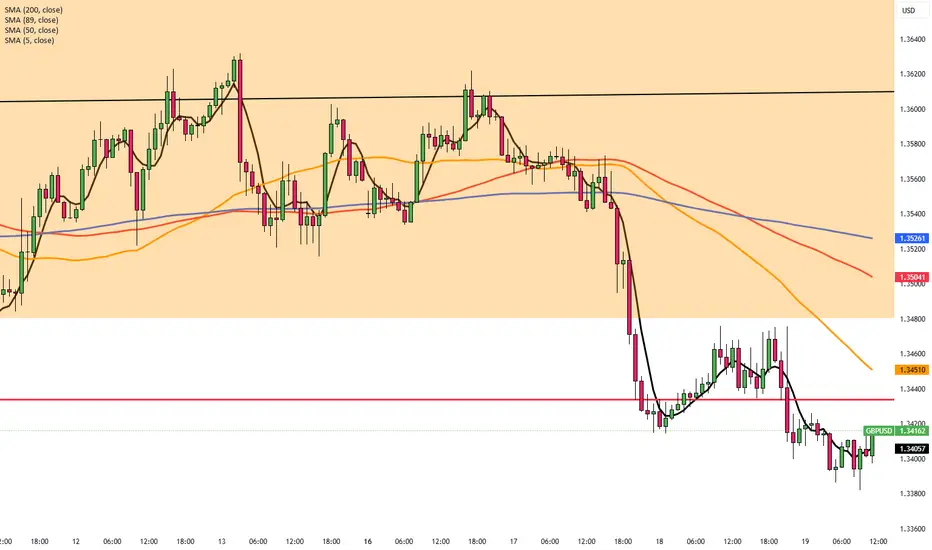
GBP/USD Stable as BoE Vote SplitsThe pound steadied near 1.34 following the Bank of England’s decision to hold rates. The vote revealed deeper division than expected, with six members supporting a hold and three pushing for a 25 basis point cut, contrary to forecasts of a 7-2 split.
The BoE faces a tough balancing act as it weighs sticky inflation, geopolitical risks, and the economic drag of US tariffs.
Resistance is seen at 1.3500, while support holds at 1.3415.
Technical Analysis
Litecoin Is Forming A Bullish PatternLitecoin with ticker LTCUSD made nice and clean five-wave recovery back to 100 area in the 4-hour chart, which confirms support in place and bullish reversal, so it can be a higher degree wave (1), thus more upside is expected for a higher degree wave (3) after current complex W-X-Y correction in wave (2) that can be in final stages. First support is here around 90-85 area, while second deeper one would be at 80 area.

GateChain Slows Down Within An Impulsive Bullish TrendGateChain with ticker GTUSD came slightly lower, but we still see it trading in a higher degree wave »iv« correction that can resume the bullish trend for wave »v«. It can be actually finishing final subwave (c) of a three-wave (a)(b)(c) corrective decline, so keep an eye on strong support here at the former wave (iv) swing low and 38,2% Fibonacci retracement. If we get sharp rebound and impulsive rise back above channel resistance line near 20 bullish confirmation level, then we can easily expect further rally within final wave »v« of 5 this year, which can push the price even up to 35 – 40 target area.

Polkadot (DOTUSD) is getting closer to a scary levelPolkadot ( MARKETSCOM:DOTUSD ) is coming closer to the current lowest point of this year. If it surpasses that area, then this would place the crypto in the area, last seen five years ago, bringing it closer to inception price.
Let's dig in...
CRYPTO:DOTUSD
Let us know what you think in the comments below.
Thank you.
77.3% of retail investor accounts lose money when trading CFDs with this provider. You should consider whether you understand how CFDs work and whether you can afford to take the high risk of losing your money. Past performance is not necessarily indicative of future results. The value of investments may fall as well as rise and the investor may not get back the amount initially invested. This content is not intended for nor applicable to residents of the UK. Cryptocurrency CFDs and spread bets are restricted in the UK for all retail clients.

Gold on the Edge: Will US Debt Fears Spark a Breakout?XAUUSD – Gold on the Edge: Will US Debt Fears Spark a Breakout?
After weeks of muted movement, gold is coiling within a bearish channel — but a fresh warning from Goldman Sachs may be the trigger that changes everything. With concerns mounting over America’s fiscal future, gold could be preparing for a decisive shift.
🌐 Macro View – Goldman Sachs Sounds the Alarm
🔺 Goldman Sachs recently issued a critical warning:
US national debt is expected to exceed WWII levels, with interest payments topping $1 trillion by 2025, outpacing spending on defense and healthcare.
If urgent fiscal reforms aren’t implemented, the US could face a tightening cycle that slows GDP growth without reducing the debt-to-GDP ratio.
The root causes? Excessive spending, rising interest rates, and deep political gridlock.
📌 For global investors, this type of uncertainty is often bullish for gold — especially as a hedge against both inflation and US dollar instability.
📉 Technical Outlook (Updated – M30 to H1)
Gold is still trading inside a well-defined descending channel, with sellers firmly in control.
Price is currently hovering around the pivot zone at 3,338.42, with a possible short-term bounce toward 3,368.04, the upper edge of the channel.
EMA ribbons (13–200) are sharply aligned to the downside, signaling strong bearish momentum.
If the price fails to break above 3,368, the next key support zones lie at 3,325.78, and potentially 3,309.25, where unfilled fair value gaps (FVG) await.
✅ Trade Plan
🟢 BUY ZONE: 3310 – 3308
Stop-Loss: 3303
Targets: 3314 → 3318 → 3322 → 3326 → 3330 → 3340 → 3350 → 3360 →
🟢 BUY SCALP: 3325 – 3323
Stop-Loss: 3318
Targets: 3330 → 3334 → 3338 → 3342 → 3346 → 3350 → 3360 → 3370 →
🔴 SELL ZONE: 3418 – 3420
Stop-Loss: 3424
Targets: 3414 → 3410 → 3405 → 3400 → 3396 → 3390 → 3385 → 3380
🔻 SELL SCALP: 3396 – 3398
Stop-Loss: 3403
Targets: 3392 → 3388 → 3384 → 3380 → 3375 → 3370
💬 Closing Thoughts – A Volatile End to the Week?
With US markets returning from a bank holiday and macro pressure rising, volatility could spike to close the week.
✅ Stick to disciplined SL/TP levels. Avoid premature entries and let price confirm direction.
Gold remains technically bearish — but the global debt narrative could turn this market on its head.
Prepare. Observe. Strike only when the structure aligns.

GOLD XAUUSD 1H Chart Idea"Gold is forming a descending triangle pattern, signaling bearish pressure. Price is testing the lower support zone, and a confirmed breakdown below this level could trigger a strong downside move. Bears are likely to dominate if the support breaks with volume confirmation. Watch closely for a retest of the broken support turning into resistance for possible short entries. Risk management is crucial in this setup."

#NIFTY Intraday Support and Resistance Levels - 20/06/2025A flat opening is expected in Nifty today. After the open, all eyes will be on the 24,700 level, which has acted as a key support zone recently.
🔽 If Nifty starts trading below 24,700, downside momentum may pick up, with potential targets at 24,650 → 24,600 → 24,550-. Sustained weakness below 24,700 could attract short positions.
🔼 On the upside, if Nifty reclaims 24,750–24,800 and sustains, a bullish move may trigger toward 24,850 → 24,900 → 24,950+. However, 24,950 remains a strong resistance area from the past sessions.
⚠️ Strategy Note:
Market remains in a range-bound zone; wait for a decisive breakout for positional trades.
Use strict stop-losses and manage risk actively.
Ideal approach: scalp the range with quick profit booking unless a directional move confirms.

[INTRADAY] #BANKNIFTY PE & CE Levels(20/06/2025)Today, a flat opening is expected in Bank Nifty, with price action likely to begin around 55,500 levels. There are no major changes in the key levels compared to yesterday, and the market has remained in a consolidation phase.
🔽 If Bank Nifty starts trading below 55,450, it may trigger further downside toward 55,250 → 55,150 → 55,050-. This zone has acted as intraday support recently.
🔼 On the other hand, a move above 55,550–55600 may lead to upward momentum toward 55,750 → 55,850 → 55,950+. A breakout above 56,050 could open the path toward 56,250 → 56,350 → 56,450+.
⚠️ Key Takeaways:
Consolidation continues, so avoid aggressive positions until a breakout occurs.
Watch for range breakouts above 56,050 or below 55,450 for directional moves.
Use tight stop-losses and trail profits smartly to protect against volatility spikes.

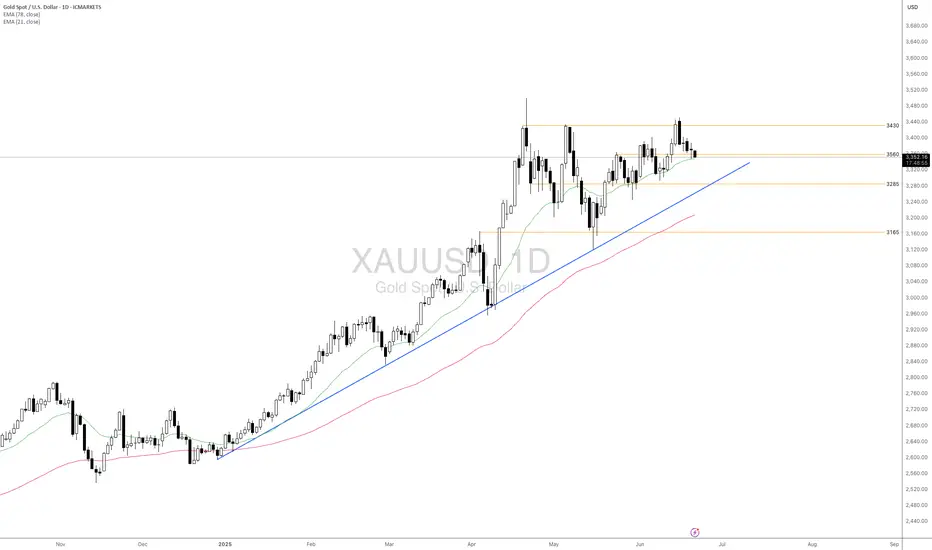
Gold Prices Pull Back Amid Profit-Taking and Unchanged Fed ratesMacro approach:
- Gold prices have recently pulled back as investors took profits at elevated levels to offset losses elsewhere amid rising geopolitical tensions in the Middle East and steady Fed holding rates.
- Speculation is mounting that the US may involve into the Middle East conflicts, raising fears of a broader regional tensions.
- Meanwhile, a dovish Fed outlook signaling two potential rate cuts this year and concerns over growing US debt continues to provide underlying support for gold prices.
Technical approach:
- XAUUSD is retesting EMA21, and the support level is around 3560. The price is above both EMAs, indicating that the upward momentum is intact.
- If XAUUSD closes below EMA21, it may continue to plunge and retest the following support at 3285, which is the confluence with the ascending trendline.
- On the contrary, remaining above 3560 may prompt a potential retest of the key resistance at around 3430.
Analysis by: Dat Tong, Senior Financial Markets Strategist at Exness
Nightly $SPY / $SPX Scenarios for June 20, 2025🔮 Nightly AMEX:SPY / SP:SPX Scenarios for June 20, 2025 🔮
🌍 Market-Moving News 🌍
🏦 Fed Holds Rates, Warns on Tariffs
Fed kept interest rates steady on June 19, cautioning that tariffs could stoke inflation and slow growth. Inflation projections were raised from 2.7% to 3.0%, while growth estimates were revised lower to 1.4%
🌍 Middle East Risk Drags Markets
Global stocks fell and safe-haven assets surged after U.S. futures weakened amid heightened tensions in the Israel–Iran conflict. Yields were mixed: gold weakened and bonds gained, while oil held steady near seven-week highs
📈 Treasury Yields Edge Higher
Despite safe-haven demand, U.S. 10‑year yields ticked up as markets absorbed the Fed’s updated rate outlook. The yield curve remains elevated ahead of next week’s $38 bn auction of long-dated notes
📊 Key Data Releases 📊
📅 Friday, June 20:
(No major U.S. economic reports)
Markets will be driven by Fed commentary follow-ups and geopolitical headlines over the weekend.
⚠️ Disclaimer:
This information is for educational and informational purposes only and should not be construed as financial advice. Always consult a licensed financial advisor before making investment decisions.
📌 #trading #stockmarket #economy #geopolitics #fixedincome #inflation #charting #technicalanalysis

Apple Near Key Support — Long Setup DevelopingIntroduction:
Apple NASDAQ:AAPL is approaching a critical support zone that has consistently held over the past two months. As price retraces toward this level, it presents a potential long opportunity for traders looking to position ahead of the next bullish leg.
Technical Setup:
Support Zone: $193 – $196
This area has acted as a strong demand zone, providing multiple bounce points since April.
Price is now pulling back into this region, offering a potential entry for a long trade.
Trade Idea:
Entry: $193 – $196 (on confirmation of support holding)
Take Profit Targets:
First Target: $210 – $215
Second Target: $225 – $233
Stop Loss: Just below $184 (to protect against a breakdown from support)
#AAPL #Apple #Stocks #TechnicalAnalysis #SupportZone #LongSetup #TradingStrategy #NASDAQ #TechStocks #RiskReward

GBPJPY Potential DownsidesHey Traders, in tomorrow's trading session we are monitoring GBPJPY for a selling opportunity around 195.600 zone, GBPJPY is trading in a downtrend and currently is in a correction phase in which in which it is approaching the trend at 195.600 support and resistance area.
Trade safe, Joe.

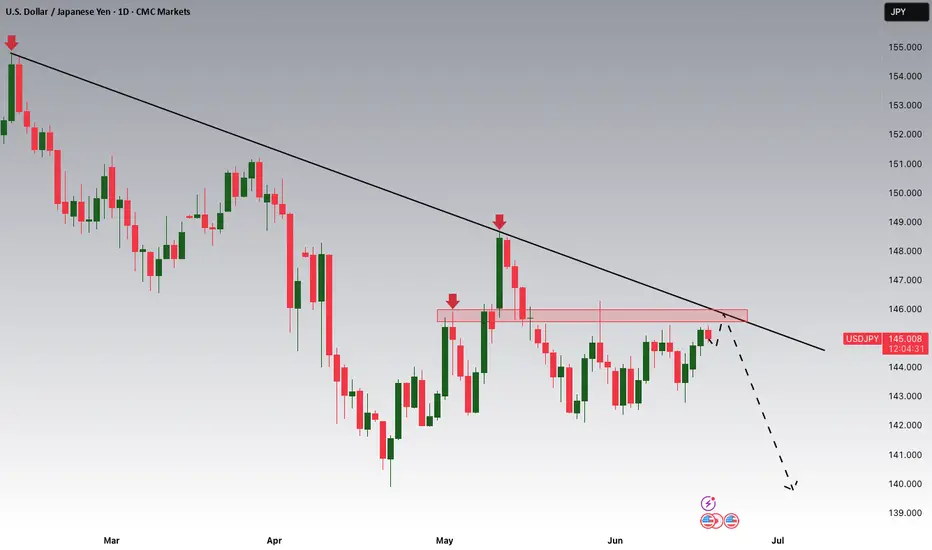
USDJPY Potential DownsidesHey Traders, in today's trading session we are monitoringUSDJPY for a selling opportunity around 145.700 zone, USDJPY is trading in a downtrend and currently is in a correction phase in which it is approaching the trend at 145.700 support and resistance area.
Trade safe, Joe.
AUDNZD: Intraday Bearish Move Ahead?! 🇦🇺🇳🇿
AUDNZD nicely reacted to a key horizontal resistance level.
The price formed a bearish CHoCH on an hourly time frame
after its test.
I expect a retracement to 1.086 level.
❤️Please, support my work with like, thank you!❤️
I am part of Trade Nation's Influencer program and receive a monthly fee for using their TradingView charts in my analysis.

Nifty 50 Trapped in a Tight Range – Breakout or Breakdown Ahead?📍 Market Overview:
For over a month now, the Nifty 50 Index has been moving sideways in a tight consolidation range, frustrating both bulls and bears. Since May 12, 2025, the index has fluctuated between 24,350 on the lower side and 25,250 on the upper side, forming a classic rectangular pattern often associated with accumulation or distribution phases.
This zone is now becoming a crucial battlefield that could define the index’s direction for the coming sessions.
🔲 The Consolidation Zone
Support Zone: 24,350 – 24,450
Resistance Zone: 25,150 – 25,250
Consolidation Duration: ~30+ days
Current Price: 24,793.25
This range has seen multiple rejections at the top and bottom, reflecting indecisiveness in broader market sentiment. Traders are waiting for a trigger — either fundamental or technical — that could push the index out of this range with strength.
📈 Bullish Scenario: Breakout Above 25,350
If Nifty 50 breaks and sustains above 25,350, especially with higher volume and a strong daily close, it could signal a bullish continuation pattern. This scenario would be supported by:
A potential breakout from the rectangle consolidation.
Positive sentiment from global markets or domestic catalysts (monsoon, earnings, policy announcements, etc.)
A shift in FII or DII buying behavior.
📌 Breakout Target:
👉 26,000 – 26,100 (Based on measured move projection)
📌 Next Resistance Zone:
👉 26,050 – 26,200
In this case, traders may look for long opportunities with trailing stop-losses under the breakout zone.
📉 Bearish Scenario: Breakdown Below 24,350
On the flip side, a decisive breakdown below the 24,350 mark, especially with increased selling pressure and bearish candles, may lead to a quick decline toward the next major support levels.
📌 Breakdown Target:
👉 23,550 – 23,400
📌 Next Support Zone:
👉 23,500 – 23,300
This could trigger panic selling or profit-booking in frontline stocks. Caution is advised in such scenarios, and shorting opportunities may arise for experienced traders.
🧠 Strategic Insights for Traders
Avoid trading within the range: Unless you're scalping, wait for breakout/breakdown.
Watch global cues and FII flows: They often align with large breakouts.
Stick to risk management: Whichever direction the index moves, always set a stop loss.
🚀 Final Thoughts
The market is clearly in a wait-and-watch phase, but such consolidation periods often precede large moves. Nifty’s current structure suggests a breakout or breakdown is imminent — and being positioned correctly can make a big difference in returns.
Stay alert. Don’t predict — prepare.
⚠️ Disclaimer
This article is for educational and informational purposes only and does not constitute financial advice or a recommendation to buy or sell any securities. Trading and investing in the stock market involve risk, including the risk of losing capital. Always conduct your own research or consult with a qualified financial advisor before making any trading decisions. We are not responsible for any losses incurred from decisions based on this analysis.

$FET 4Hr Time frame DUMP before PUMP? $1 Recovery!FET/USDT – 4H Time Frame Analysis
Pattern Formation: A rounding top is clearly visible, suggesting weakening bullish momentum and potential trend reversal.
Trend Structure: Price is forming lower highs and lower lows, confirming a bearish trend.
Key Zones:
Supply Zone: $0.85 – $0.975
Demand Zone: $0.35 – $0.45
Neckline Support: Price is approaching a critical neckline level. A break below this could trigger strong downside movement.
Weekly FVG & Fib Confluence:
Below the neckline lies a weekly Fair Value Gap (FVG).
The 0.618 Fibonacci retracement aligns with this zone, forming a golden pocket — a key support area.
Scenario 1 – Bullish Reversal:
If price holds above the golden pocket, a bounce could push it back toward psychological levels (e.g., $0.70 and $0.80)
Scenario 2 – Bearish Continuation:
If price fails to hold the FVG/GP zone, this invalidates bullish setups.
Expect a breakdown targeting the $0.35–$0.45 demand zone.

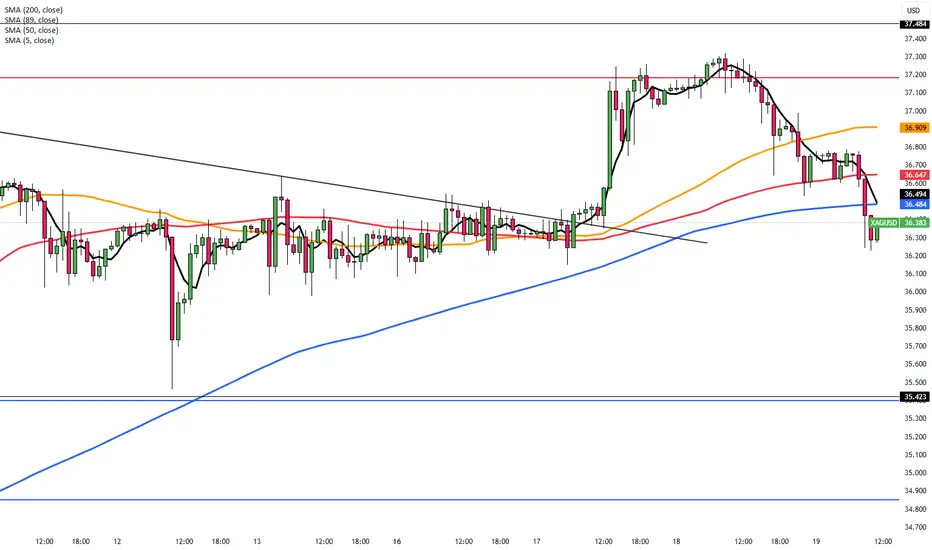
Silver Consolidates After Hitting Multi-Year HighSilver holds near $36.75 in Thursday’s Asian session, steady after a slight pullback from its highest level since February 2012. The trend remains bullish, suggesting more upside. A sustained move above $36.45–$36.50 confirmed a breakout from a descending channel, forming a bullish flag. The RSI has eased from overbought, and momentum indicators support a positive near-term outlook.
The first resistance is seen at 37.50, while the support starts at 35.40.
Gold Climbs as Israel-Iran Conflict DeepensGold rose toward $3,380 on Thursday, recovering earlier losses as safe-haven demand grew amid the escalating Israel-Iran conflict, now in its seventh day. Reports say Israel hit over 20 sites near Tehran, including nuclear and missile facilities, while the U.S. may join the strikes, raising fears of a broader war.
Meanwhile, the Fed held rates steady Wednesday but signaled two possible cuts this year, despite high inflation and slowing growth. The move followed renewed pressure from President Trump for deeper cuts.
Resistance is seen at $3,370, while support holds at $3,316

BoE in Focus as GBP/USD Nears 1.3410GBP/USD remains under pressure for a third day, trading near 1.3410 in Thursday’s Asian session, as safe-haven demand strengthens the US Dollar amid Israel-Iran tensions. The BoE is expected to hold rates at 4.25% today. UK inflation eased to 3.4% in May from 3.5%, in line with forecasts but still above the 2% target. Markets still price in about 48 basis points of BoE cuts by year-end.
Resistance is seen at 1.3440, while support holds at 1.3260.
EUR/USD Slips as Fed Stays HawkishEUR/USD fell toward 1.1465 in Thursday’s Asian session, pressured by a risk-off mood as Middle East tensions rise. The focus shifts to speeches from ECB officials Lagarde, Nagel, and de Guindos for further guidance.
On Wednesday, the Fed held rates at 4.25%–4.50% and signaled a slower pace of cuts, citing inflation risks from Trump’s new tariffs. The FOMC still projects two cuts in 2025
Bloomberg reported the US may strike Iran in the coming days, raising safe-haven demand for the dollar and adding pressure on the euro. ECB’s Lagarde said rate cuts are nearly done and that the ECB is well-positioned to manage current uncertainties.
Resistance is located at 1.1475, while support is seen at 1.1415

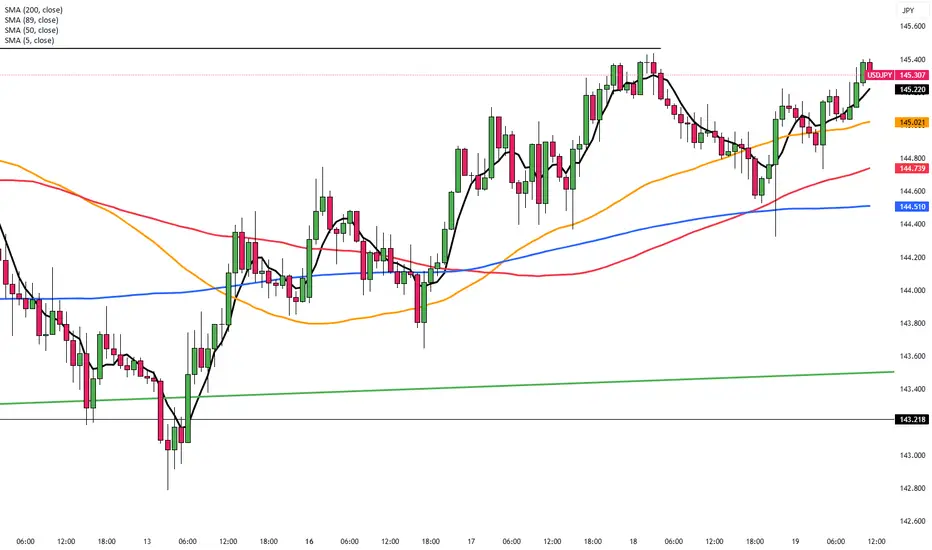
Yen Slips as Fed Holds and Risks MountThe yen weakened past 145 on Thursday, nearing a three-week low as the stronger U.S. dollar gained support from the Fed’s steady rate decision and cautious outlook. Concerns over Trump’s tariffs and Middle East tensions increased safe-haven demand for the dollar over the yen.
The BOJ also kept rates unchanged Tuesday and signaled a gradual asset reduction. Governor Ueda noted that rate hikes remain possible if inflation rises.
The key resistance is at $145.30 meanwhile the major support is located at $142.50.
Dow Jones Potential UpsidesHey Traders, in today's trading session we are monitoring US30 for a buying opportunity around 41,900 zone, US30 is trading in an uptrend and currently is in a correction phase in which it is approaching the trend at 41,900 support and resistance area.
Trade safe, Joe.

Gold Breaks the Range: Trend Reversal or Just a Fakeout?XAUUSD – Gold Breaks the Range: Trend Reversal or Just a Fakeout?
After several days of sideways action, gold has finally broken out of its consolidation channel — but not upward. The price action signals uncertainty, while underlying global risks suggest a larger move may be brewing. With US markets closed for a bank holiday, low liquidity could lead to sharp, unexpected spikes — traders, stay alert.
🌍 Macro & Fundamental Outlook
📌 As widely expected, the Federal Reserve held rates steady, but Fed Chair Powell maintained a hawkish tone, warning that inflation risks remain due to ongoing geopolitical instability and rising commodity costs.
🔥 The gold market now hinges on two major geopolitical scenarios in the Middle East:
If the US intervenes diplomatically to ease tensions between Iran and Israel, gold may continue to correct further — possibly into the 3,325 – 3,300 range or lower.
However, if reports are accurate that Trump is coordinating with Israel for potential strikes on Iran, gold could spike aggressively as safe-haven demand surges toward 3,417 – 3,440.
📊 Technical Breakdown (M30 – H1)
Price has broken below the range-bound structure, suggesting a potential momentum shift to the downside.
The EMA cluster (13–34–89–200) is sloping downward, confirming bearish short-term pressure.
The 3,345 level has acted as support, but if it gives way, 3,325 becomes a critical liquidity zone where buyers may step in.
✅ Trading Plan
🟢 BUY ZONE 1: 3,325 – 3,328
Entry: Only after a clear bullish reversal (pin bar / bullish engulfing candle)
SL: Below 3,320
TP: 3,345 → 3,360 → 3,373 → 3,384
🟢 BUY ZONE 2: 3,345 – 3,348
Entry: On price retest and bullish confirmation
SL: Below 3,340
TP: 3,360 → 3,373 → 3,384 → 3,403
🔴 SELL ZONE: 3,417 – 3,440
Entry: If price rallies into resistance with no supporting fundamentals
SL: Above 3,445
TP: 3,403 → 3,384 → 3,360 → 3,345
💬 Final Thoughts
Gold is at a pivotal point. While today’s break could indicate a new leg down, we’ve seen countless false breakouts during low liquidity sessions. Only trade on confirmation — not emotion. Watch for geopolitical headlines and let price action guide your risk-adjusted decisions.
Stay patient. Stay sharp. Let the market prove itself before you do.
