EURUSD 16 June – Technical Rebound or Liquidity Trap? EURUSD 16 June – Technical Rebound or Liquidity Trap?
The EURUSD pair has shown sharp movements after testing key resistance near 1.1607. While the price action may appear bullish at first glance, deeper analysis suggests we might be facing either a continuation of the uptrend or a strategic liquidity hunt.
🌍 Macro & Fundamental Overview
The ECB remains hawkish with rates still high, but recent commentary hints at a more dovish tone possibly leading to rate cuts in late Q3 2025.
Meanwhile, the Federal Reserve maintains its cautious stance, holding off on rate cuts due to sticky core inflation.
This divergence in policy expectations creates a neutral to slightly USD-favorable bias, depending on upcoming economic data.
⏳ Bottom line: EURUSD remains in a choppy environment with compression–expansion cycles, and no confirmed macro-driven trend yet.
📉 Technical Outlook (H1 Chart)
Price Structure: The pair is moving within a short-term ascending channel, but current price is testing the upper boundary.
EMA Analysis (13/34/89/200): Still supports an uptrend, but flattening out — potential bearish crossover if price fails to hold.
Key Resistance:
1.1607: Major resistance and local top (double rejection zone).
Critical Support Zones:
1.15540: Minor structural support — a decisive level for intraday direction.
1.15261 & 1.14807: Unfilled FVG zones and liquidity pools that may get targeted if the price breaks lower.
🎯 Trade Setup Ideas
📘 Scenario A – BUY from 1.15540 support (bullish continuation)
Entry: 1.15540 (upon bullish candle confirmation or strong bounce)
Stop Loss: 1.15200
Take Profits: 1.15850 → 1.16070 → 1.16300+
✅ Ideal if European sentiment remains positive or if USD weakens across the board.
📕 Scenario B – SELL if price breaks and retests 1.15540
Entry: 1.15540 (after a breakdown + rejection retest)
Stop Loss: 1.15720
Take Profits: 1.15261 → 1.14807 → possibly 1.1450
✅ Best used if USD gains strength or EUR shows weakness after economic releases.
🧠 Market Psychology
The market is currently reactive to any shift in tone from ECB and Fed, causing price whipsaws near key zones.
Smart traders will avoid chasing breakouts and instead focus on reaction zones like 1.15540 for confirmation-based trades.
Watch for fakeouts, as institutional players may be hunting liquidity before choosing direction.
📌 Final Thoughts
EURUSD is in a sensitive zone, and 1.15540 is the intraday pivot. Holding above could trigger a push toward 1.1607 and higher. But failure to hold would likely attract sellers toward the 1.1480–1.1450 liquidity range.
🎯 Discipline is key. Avoid emotional entries. Let the market come to your level — and execute only with confirmation.
Technical Analysis

Silver Gains on Tensions, Eyes on FedFriday’s strong U.S. data may support the dollar, as the University of Michigan’s Consumer Sentiment Index rose to 60.5 in June from 52.2, beating forecasts of 53.5 and marking the first gain in six months.
Geopolitical tensions continue to drive safe-haven demand, especially for silver. Israel struck Iranian nuclear and missile sites Friday, killing military officials. On Sunday, Iran began its fourth phase of response, warning of firm retaliation to further Israeli actions.
Markets now turn to Wednesday’s Fed meeting. While rates are expected to stay unchanged, futures still price in two cuts this year, possibly starting in September, supported by last week’s soft inflation data.
Resistance is set at 36.90, while support stands at 35.40.

Safe-Haven Demand Lifts Gold Above $3,440Gold rose to around $3,440 per ounce on Monday, staying near April’s record highs, as escalating Middle East tensions increased safe-haven demand. Weekend clashes between Israel and Iran raised fears of broader conflict.
Markets now look ahead to upcoming central bank meetings, especially the U.S. Federal Reserve. While rates are expected to remain unchanged, investors are watching for signals on future cuts. Last week’s weaker inflation data has increased expectations for a potential rate cut by September.
Traders are also awaiting details on President Donald Trump’s upcoming tariff decisions, expected in the coming weeks.
Resistance is seen at $3,430, while support holds at $3,392.
Pound Stable as Markets Eye BoE, Fed MovesGBP/USD remains below Friday’s three-year high, trading around the mid-1.3500s in a narrow range during Monday’s Asian session. The pair shows limited downside as traders await a busy week of key data and central bank decisions.
Markets are watching the UK CPI on Wednesday and the Bank of England’s policy announcement on Thursday, both crucial for the Pound. The US Federal Reserve will also decide on rates Wednesday, likely guiding the dollar’s short-term path.
Friday’s UK GDP showed a 0.3% contraction in April, increasing bets on faster BoE rate cuts. The USD is supported by safe-haven flows due to Middle East tensions, though soft US inflation data has raised expectations for Fed cuts by September. A broadly positive global risk mood is offering some support to GBP/USD.
Resistance is at 1.3600, with support around 1.3425.
ECB’s De Guindos Sees Balanced Inflation RisksEuropean Central Bank Vice President Luis de Guindos said Monday that the EUR/USD at 1.15 does not hinder the ECB’s inflation goal, noting the euro’s gradual rise and stable volatility.
He stated inflation risks are balanced, with little chance of falling short of the target, and that markets have clearly understood the ECB’s recent policy signals. De Guindos reaffirmed the ECB is close to its inflation objective
Looking ahead, he warned that tariffs could slow growth and inflation in the medium term but expressed confidence in the Fed maintaining swap line arrangements. He also confirmed there have been no discussions about repatriating gold reserves from New York.
At the time, EUR/USD was down 0.09%, trading near 1.1537.
Resistance is located at 1.1580, while support is seen at 1.1460.

Stronger Dollar Pressures Yen on Geopolitical RisksThe Japanese yen fell past 144.2 per dollar on Monday, marking a second day of losses, as the U.S. dollar strengthened on increased safe-haven demand. This followed renewed conflict between Israel and Iran, with both sides targeting energy facilities and pushing oil prices higher. The rise in energy costs may reduce the chances of a near-term Fed rate cut as inflation and trade risks persist. Meanwhile, focus turns to the Bank of Japan’s upcoming policy meeting, where it is expected to keep rates unchanged while assessing the inflation impact of rising oil prices amid global uncertainty.
Resistance is at 145.30, while support stands near 142.50.

AUDCAD: The Real Move Happens After the TrapNot every trade needs to be flashy.
This one was clean. Simple. Intentional.
And it came after most traders got taken out.
What I Saw :
Price swept PDL: textbook sell-side liquidity.
But instead of jumping in too early, I waited.
Why?
Because I’ve learned something:
👉 The first reaction is often just noise.
👉 The second one, the one that fills into structure. That’s where clarity lives.
My Entry Logic:
After the sweep, price broke minor structure. That was my Change of Character. I will just have to wait for price to pull into the FVG below 50% fibs retracement. Stop below the low. Target at the PDH.
Nothing fancy. Just discipline .
Psychology Check:
I’ve taken this setup before and watched it run without me. Why? Because I used to hesitate. I wanted more confirmation… or feared being wrong.
But here’s the truth:
Your edge is only real if you’re willing to take the shot when it appears .
This wasn’t a guess.
It was system + structure + emotional control.

GBPCAD: Pullback After a Trap 🇬🇧🇨🇦
There is a high chance that GBPCAD will pull back
from the underlined support.
The price started to grow after a false violation of that and a confirmed bearish trap.
Goal - 1.8458
❤️Please, support my work with like, thank you!❤️
I am part of Trade Nation's Influencer program and receive a monthly fee for using their TradingView charts in my analysis.

NZDUSD Potential UpsidesHey Traders, in today's trading session we are monitoring NZDUSD for a buying opportunity around 0.60000 zone, NZDUSD is trading in an uptrend and currently is in a correction phase in which it is approaching the trend at 0.600000 support and resistance area.
Trade safe, Joe.

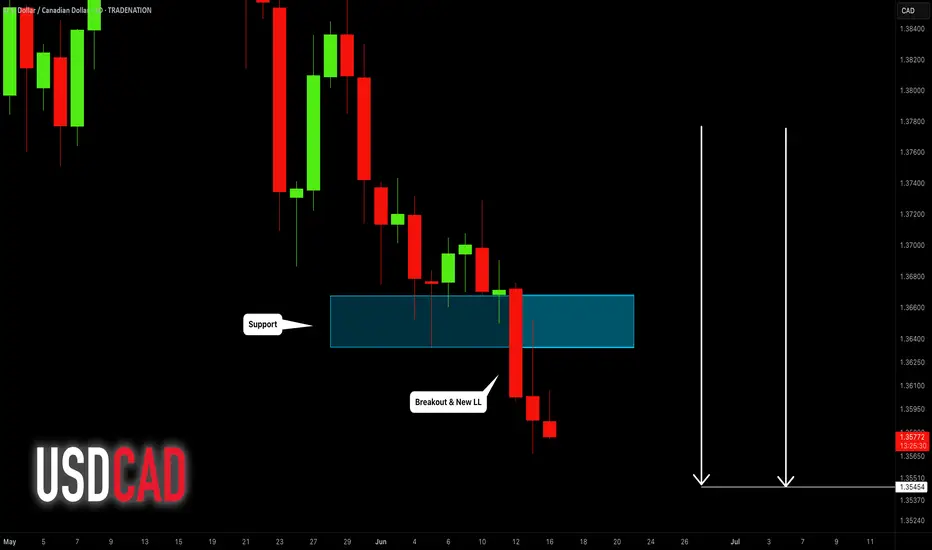
USDCAD: Bearish Trend Continues 🇺🇸🇨🇦
Amid the geopolitical tensions and a bullish rally on Crude Oil,
USDCAD is going to drop more.
The closest support that I see is 1.3545.
It will be the next goal for the sellers.
❤️Please, support my work with like, thank you!❤️
I am part of Trade Nation's Influencer program and receive a monthly fee for using their TradingView charts in my analysis.
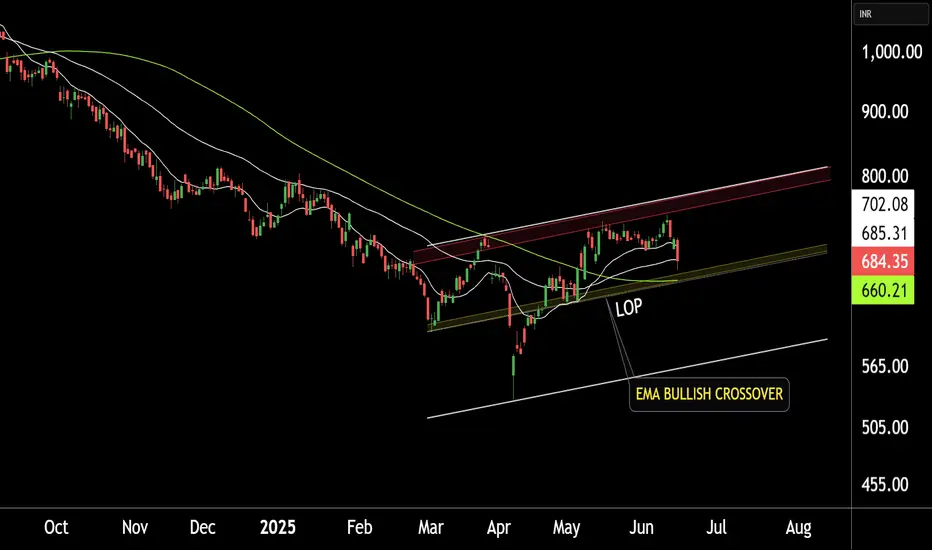
TATA MOTORS LTD at BEST SUPPORT !!This is the Daily chart of TATA MOTORS LTD.
TATA MOTORS having good law of polarity at 660 range.
TATAMOTORS has given a positive EMA crossover, with its support range lying around 660-680.
If this level is sustain , then We may see higher price in TATAMOTORS.
Thank you !!
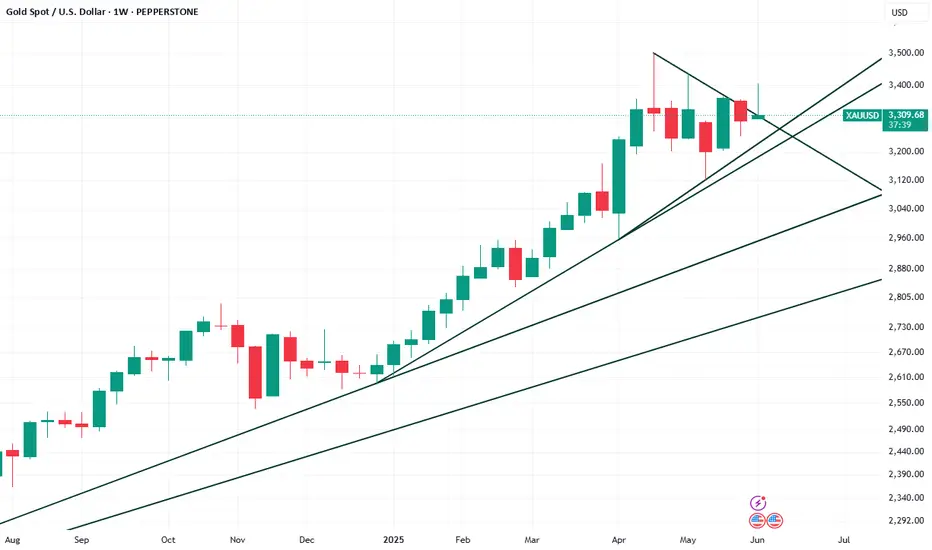
The Uncertainty of Gold Gold exhibited considerable uncertainty, as sellers pushed the price back to nearly its starting point this week. Is it profit taking? What do institutions know that we don't, as they increased their long positions this week? 81% of institutions are long. So, where the whales are is where I want to be.
Note: This is not advice. This is for educational purposes only. Past performance is not indicative of future results.
Weekly $SPY / $SPX Scenarios for June 16–20, 2025 🔮 Weekly AMEX:SPY / SP:SPX Scenarios for June 16–20, 2025 🔮
🌍 Market-Moving News 🌍
🏦 Fed Holds Rates, Powell Expresses Caution
The Federal Reserve is widely expected to keep rates at 4.25–4.50%, though Chair Powell likely won’t provide fresh guidance. Markets see limited upside without stronger inflation or growth cues
💱 Dollar Strengthens on Geopolitical Risk
The U.S. dollar rose slightly as investors flocked to safe assets amid global tensions with Iran. Treasury yields eased slightly on risk-off flows
🛢️ Oil Near Multi-Week Highs on Mideast & OPEC Dynamics
Oil held near seven-week highs (~$67–70/barrel), buoyed by Iran-Israel tensions and OPEC+ output hikes (411K bpd added from May–July), offset by demand concerns .
⚠️ G7 Summit Faces Heightened Stakes
G7 finance ministers meet in Canada under pressure from Middle East escalation. Watch for policy coordination and commentary on trade, inflation, and global economic risks .
📊 Key Data Releases & Events 📊
📅 Monday, June 16
Regular markets open after Juneteenth holiday
Quiet day; oil & geopolitical headlines dominate
📅 Tuesday, June 17
8:30 AM ET – Retail Sales (May): Signals consumer spending strength/duration
8:30 AM ET – CPI (May): Confirms inflation trend post-CPI cooler reading
10:00 AM ET – Housing Starts & Building Permits (May): Gauges housing market demand
Unexpected Tesla Robotaxi Demo (Austin): Watch for surprise developments this week
📅 Wednesday, June 18
Global Central Bank Day: FOMC, BoE, BoJ policy updates; U.S. Fed will most likely hold steady
📅 Thursday, June 19 – Juneteenth Holiday – U.S. markets closed
📅 Friday, June 20
8:30 AM ET – Existing Home Sales (May): Measures U.S. housing activity
10:00 AM ET – Leading Economic Indicators (May): Early snapshot of economic momentum
⚠️ Disclaimer:
This information is for educational and informational purposes only and should not be construed as financial advice. Always consult a licensed financial advisor before making investment decisions.
📌 #trading #stockmarket #economy #news #trendtao #charting #technicalanalysis

#NIFTY Intraday Support and Resistance Levels - 16/06/2025Today, a slightly gap-up opening is expected in Nifty near the 24,735 level. If Nifty sustains above the 24,750–24,800 zone after the opening, it may lead to a continuation of the upside move toward 24,850, 24,900, and potentially 24,950+ during the day. This zone can attract intraday buying interest, especially if supported by volume and momentum.
However, any rally approaching the 24,950 level should be watched cautiously, as it may act as a reversal zone, triggering profit booking or intraday resistance.
On the other hand, if Nifty fails to hold 24,700 levels and starts drifting lower, fresh selling pressure could emerge, pushing the index toward 24,650, 24,600, and even 24,550 during the session.

[INTRADAY] #BANKNIFTY PE & CE Levels(16/06/2025)Today, a slightly gap-up opening is expected in Bank Nifty near the 55,550–55,600 zone. If Bank Nifty sustains above this zone, it may attempt an upside move toward 55,750, 55,850, and potentially 55,950+ levels during the session.
If Bank Nifty starts trading above 56,050, a further bullish rally can be seen, taking it higher toward the 56,250, 56,350, and 56,450+ zones.
On the downside, if Bank Nifty slips below the 55,450–55,400 zone, it may face further selling pressure, leading to a possible move toward 55,250, 55,150, and 55,050 levels.

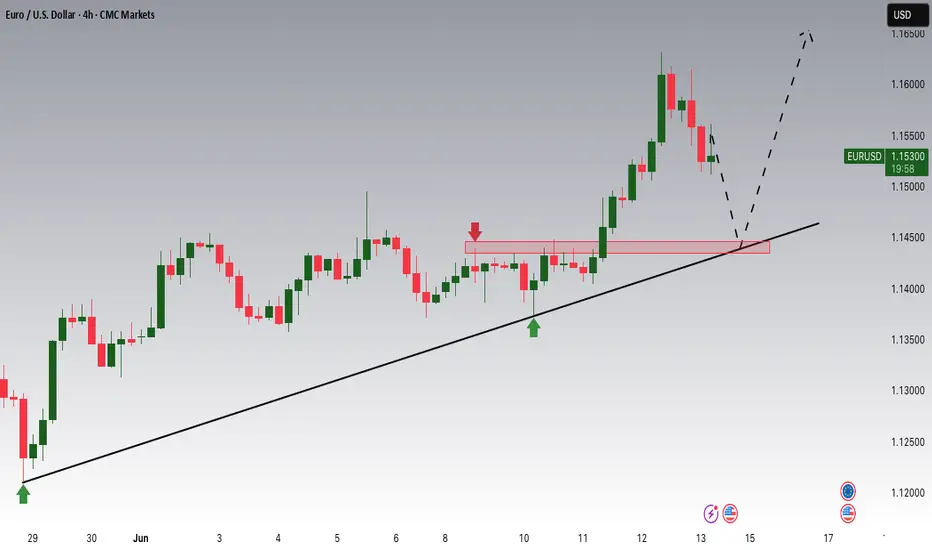
EURUSD Potential UpsidesHey Traders, in today's trading session we are monitoring EURUSD for a buying opportunity around 1.14500 zone, EURUSD is trading in an uptrend and currently is in a correction phase in which it is approaching the trend at 1.14500 support and resistance area.
Trade safe, Joe.
Forex Weekly Portfolio Selection – Top Trade SetupsWeekly Forex Portfolio Selection – H1 Chart Analysis
Using the Weekly & Daily Currency Strength Index, we’ve identified the strongest and weakest currencies to build a focused trading portfolio for the week.
📊 Currency Strength Ranking (1 = Weakest, 8 = Strongest):
EUR: 8
CHF: 7
CAD: 6
GBP: 5
AUD: 4
NZD: 3
USD: 2
JPY: 1
➡️ The Euro (EUR) is currently the strongest, while the Japanese Yen (JPY) is the weakest.
🔍 Analysed Pairs (H1 Timeframe):
EURJPY
EURUSD
CADJPY
GBPUSD
This selection focuses on high-probability setups aligned with trend and strength analysis.

EURUSD: Move Up Ahead?! 🇪🇺🇺🇸
EURUSD nicely respected the underlined key horizontal support.
A strong rejection from that and a formation of a bullish imbalance candle
indicate a highly probably bullish continuation next week.
Goal - 1.1608
❤️Please, support my work with like, thank you!❤️
I am part of Trade Nation's Influencer program and receive a monthly fee for using their TradingView charts in my analysis.

NASDAQ Breakout and Potential RetraceHey Traders, in tomorrow's trading session we are monitoring NAS100 for a selling opportunity around 21,700 zone, NASDAQ was trading in an uptrend and successfully managed to break it out. Currently is in a correction phase in which it is approaching the retrace area at 21,700 support and resistance zone.
Trade safe, Joe.

GBP/JPY Tests 196.4FenzoFx—GBP/JPY is testing the 196.4 monthly high, a fragile resistance after four previous attempts.
On Friday, bulls pushed higher with a long-wick candlestick, but the Stochastic Oscillator signals an overbought market.
The bullish trend remains intact if GBP/JPY holds above 193.8 support. A breakout above 196.4 may target 198.3, while closing below support could shift momentum downward.

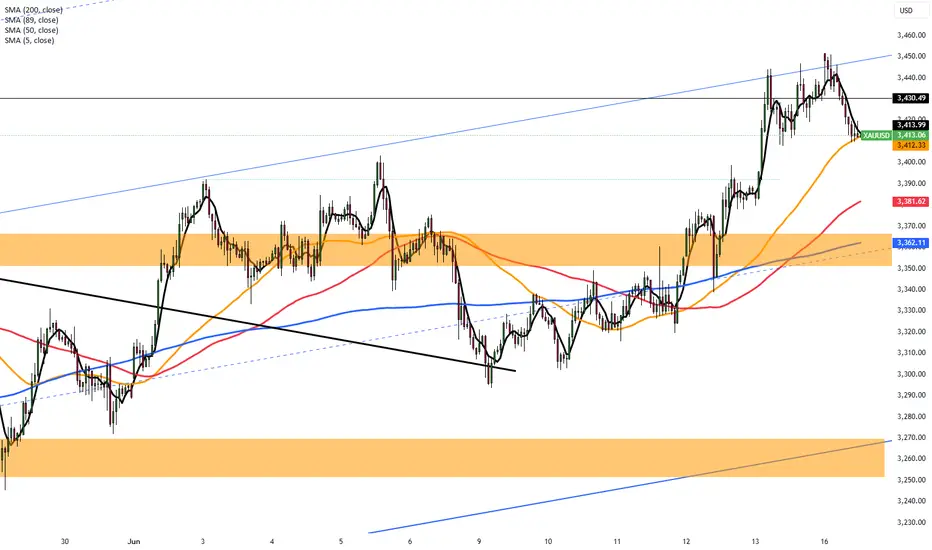
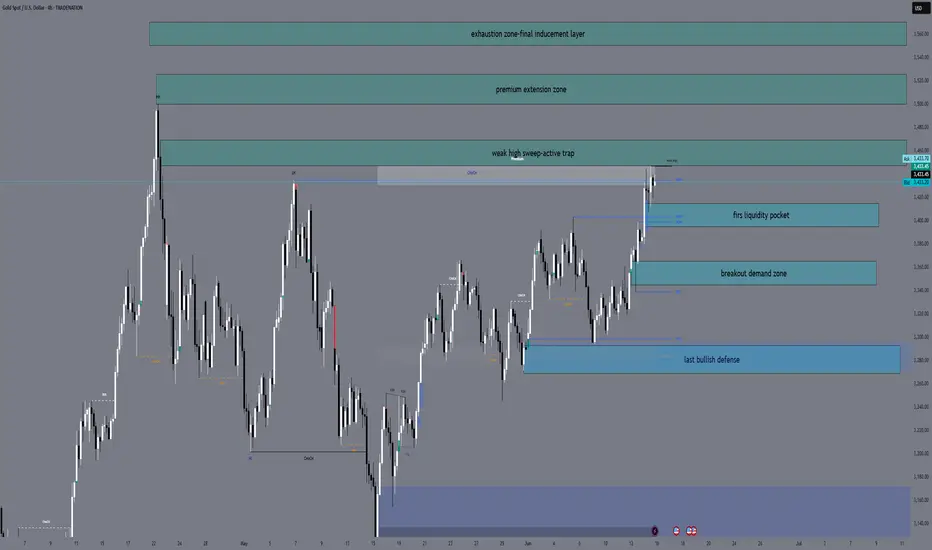
XAUUSD H4 Outlook — 16 June 2025👋 Hello team, here’s where we stand before the upcoming key week:
🔎 The Narrative
Gold remains in bullish control after weeks of controlled expansion.
The clean breakout above previous major highs triggered liquidity resets that cleared significant weak-handed positions.
Last week’s sweep into 3447 activated premium liquidity, trapping late buyers at the edge of impulsive highs. But the game is far from over — smart money continues to rotate liquidity at these extreme levels, using premium expansion to build further trap pockets both above and below.
Behind this technical expansion, macro tensions continue to fuel underlying gold demand. Geopolitical uncertainties remain elevated with the Middle East escalation risk growing, while recent Fed positioning keeps rate path expectations flexible.
The upcoming FOMC decision later this week will likely act as the true liquidity catalyst — until then, gold remains positioned for further inducement cycles as both buyers and sellers continue to get baited into traps.
🔼 Premium Supply Zones
Price Zone Description
3447 – 3470 Weak high sweep — premium liquidity trap fully active
3500 – 3525 Main extension liquidity pocket — Fibonacci cluster (1.272 & 1.414 extensions)
3550 – 3570 Exhaustion inducement — full 1.618 premium extension stack
🔽 Demand Defense Zones
Price Zone Description
3415 – 3395 Minor imbalance recalibration — short-term liquidity refill zone
3365 – 3345 Core breakout OB + FVG overlap — main recalibration zone if pullbacks extend
3285 – 3265 HTF bullish structure base — BOS origin + deep recalibration defense level
🎯 Where We Stand Right Now
✅ Smart money holds full control inside premium expansion.
✅ Inducement layers remain open both above and below current price.
✅ We expect short-term liquidity sweeps before any major expansion unfolds.
✅ No change in bias — bullish structure remains valid while 3285 holds.
🔐 The Mindset
👉 This is not the place for aggressive chasing.
👉 Liquidity will continue to hunt both sides into key events ahead.
👉 Our job is not to predict, but to position with discipline once liquidity confirms displacement inside the calibrated zones.
🚀 If this breakdown helps you stay locked:
💬 Drop a 🚀, leave your thoughts & follow for full sniper-level updates as we approach a volatile week ahead.
Stay sharp — the trap is already in play.
— GoldFxMinds
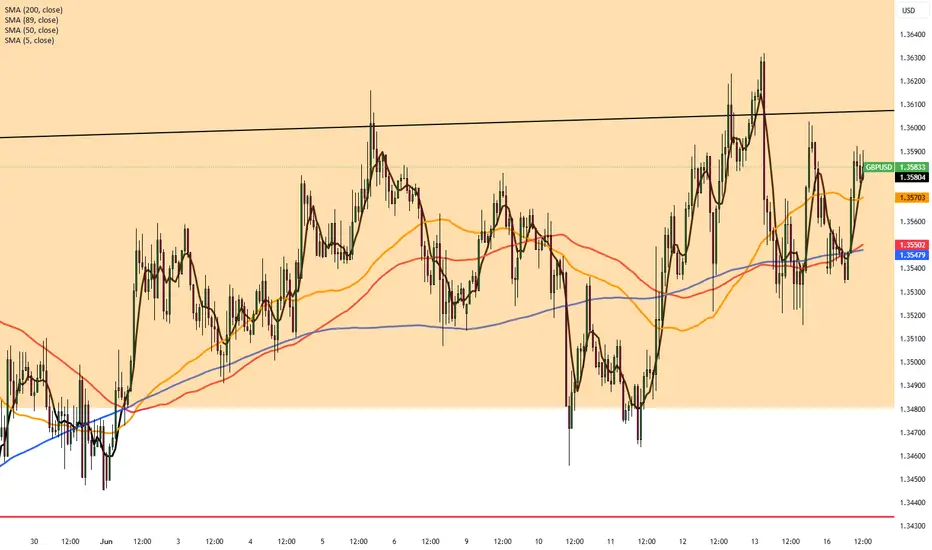
GBPUSD: Your Trading Plan For Next Week 🇬🇧🇺🇸
GBPUSD formed an ascending triangle pattern on a daily time frame.
Your next signal to buy will be a bullish violation of its neckline.
To confirm a breakout, we will need a daily candle close above 1.362.
A bullish continuation will be expected to 1.37 level then.
❤️Please, support my work with like, thank you!❤️
I am part of Trade Nation's Influencer program and receive a monthly fee for using their TradingView charts in my analysis.

AUDUSD Potential UpsidesHey Traders, in the coming week we are monitoring AUDUSD for a buying opportunity around 0.64500 zone, AUDUSD is trading in an uptrend and currently is in a correction phase in which it is approaching the trend at 0.64500 support and resistance area.
Trade safe, Joe.
