DOLLAR INDEX (DXY): Bearish Again?!
Dollar Index leaves clear bearish clues after a test
of a significant intraday/daily supply area.
I think that the market will continue falling at reach at least 98.04 level.
❤️Please, support my work with like, thank you!❤️
Technical Analysis

Bearish Bias Holds as Oil Rises & Rate Differentials NarrowUSDCAD – Bearish Bias Holds as Oil Rises & Rate Differentials Narrow
🌍 Macro & Fundamental Outlook
The Canadian Dollar (CAD) continues to gain ground this week, supported by two key drivers:
Crude oil prices surged due to Middle East tensions and renewed demand optimism — boosting CAD as a commodity-linked currency.
US-Canada yield spreads narrowed, following revised expectations that the Bank of Canada (BoC) may keep rates higher for longer, while the Fed is seen pausing.
Short-term event risks to watch:
🇨🇦 Canadian Manufacturing Sales data today at 13:30 GMT
🇨🇦 G7 Summit in Alberta from June 15–17, which may influence oil and energy policy sentiment
Our latest fair value estimate for USDCAD has shifted lower to 1.3613, reflecting tighter rate spreads and stronger oil. Technical structure remains tilted to the downside.
📉 Technical Outlook – M30 Chart
🔹 Structure:
Price remains in a short-term downtrend, with a well-defined descending trendline capping upside attempts.
The pair recently tested the EMA 89–200 zone and failed, suggesting continued bearish pressure.
🔹 Key Zones:
Dynamic Resistance: 1.3638 – 1.3660 (trendline + EMA cluster)
Support Area: 1.3592 → 1.3578
A break below 1.3578 could expose deeper downside toward 1.3420 (September lows)
🔹 Momentum Indicators:
RSI has bounced from oversold (30) but remains in bearish territory.
The current rebound looks corrective — potentially a dead cat bounce.
🧠 Market Sentiment
Flows favour commodity-backed currencies like CAD, especially with energy prices rising.
USD has weakened slightly as the Fed is expected to hold rates steady next week.
Sentiment is leaning toward "sell the rallies" on USDCAD for now.
🎯 Trade Setup Scenarios
🔻 SELL SCENARIO – If price retests and rejects 1.3638 – 1.3660
Entry: 1.3640 – 1.3655
Stop-Loss: 1.3685
Targets: 1.3592 → 1.3578 → 1.3510
🔺 BUY SCENARIO – If strong bullish reaction occurs at 1.3592 – 1.3578
Entry: 1.3580
Stop-Loss: 1.3545
Targets: 1.3620 → 1.3640
⚠️ Focus on trend continuation. Only consider buys if clear rejection or bullish confirmation appears at support.
✅ Conclusion
The current trend in USDCAD favours sellers, with fundamental momentum supporting CAD via higher oil and narrowing yield differentials. Key resistance at 1.3638–1.3660 remains the pivot zone to monitor. With Canadian data and the G7 Summit ahead, volatility could increase.

Dollar Momentum Fades | Can 143.07 Hold as Support?USDJPY – Dollar Momentum Fades | Can 143.07 Hold as Support?
🌍 Fundamental & Macro Outlook
USDJPY has faced strong downside pressure recently as risk-off sentiment boosts demand for the Japanese Yen, following escalating tensions between Israel and Iran.
The US Dollar Index (DXY) rallied on geopolitical concerns but is struggling to sustain momentum near the 98.30 resistance zone.
Despite the Bank of Japan's ultra-loose monetary policy, JPY is acting as a safe haven in current global risk conditions.
Traders are awaiting next week’s monetary policy decisions from both the Federal Reserve and the Bank of Japan. Both central banks are expected to keep rates unchanged, but forward guidance could spark major volatility.
According to UOB Group, the dollar's recovery potential is weakening, and further downside toward 142.20 is possible, unless price reclaims the 144.60–144.95 resistance zone.
📉 Technical Analysis – H1 Chart
🔸 Trend Structure
USDJPY remains in a mild downtrend, but price has bounced from the 143.074 key support zone.
A recovery towards 144.624 is in play, but that zone must be cleared for bullish continuation.
🔸 EMA Outlook
Price is currently testing the EMA 89 and 200 — a rejection from this area could trigger another move down.
EMA 13 & 34 are now acting as short-term dynamic support.
🔸 Key Price Zones
Resistance: 144.60 – 145.26
Support: 143.07 – 142.20
🧠 Market Sentiment
Risk aversion continues to dominate as geopolitical headlines drive sentiment.
The Yen is benefitting from capital protection flows despite Japan’s dovish stance.
Large funds may be starting to hedge by rotating into JPY from elevated USD levels.
🎯 Trading Scenarios for June 13
📌 Scenario 1 – Short Setup (Rejection at Resistance)
Entry: 144.60 – 144.90
Stop-Loss: 145.30
Take-Profit: 143.60 → 143.07 → 142.50
📌 Scenario 2 – Long Setup (Rebound from Support)
Entry: 143.10 – 143.20
Stop-Loss: 142.70
Take-Profit: 144.00 → 144.60
✅ Wait for confirmation at key levels — avoid trading in the middle of the range when volatility is headline-driven.
✅ Conclusion
USDJPY remains trapped between strong resistance at 145.26 and buying interest at 143.07. If risk sentiment persists, the Yen may continue to strengthen. However, central bank decisions next week (Fed & BoJ) will be the major catalysts for any medium-term breakout.

GBPUSD – Sterling Slips Amid Geopolitical Risk |GBPUSD – Sterling Slips Amid Geopolitical Risk | Will Support Hold for a Bounce?
🌍 Macro & Geopolitical Overview
The British Pound (GBP) is under pressure as risk sentiment deteriorates following a sharp escalation between Israel and Iran.
Israel launched a major military campaign, striking dozens of nuclear and military facilities in northeastern Tehran.
PM Netanyahu announced the start of "Operation Rising Lion", aimed at eliminating the Iranian nuclear threat.
US President Donald Trump voiced support, stating that Iran “must never have a nuclear bomb.”
Investors reacted by fleeing to safe-haven assets, pushing the US Dollar (DXY) from 97.60 to nearly 98.30.
Meanwhile, next week’s Bank of England (BoE) and Federal Reserve meetings are in focus. Both are expected to hold rates steady, but weak UK economic data may pressure the BoE to adopt a more cautious or dovish tone.
📉 Technical Analysis – H1 Chart
🔸 Trend Structure
GBPUSD broke down from its recent high at 1.36288 and is now approaching key support between 1.35350 and 1.34957.
As long as 1.3495 holds, the move appears to be a technical correction, not a reversal.
🔸 Fibonacci & Moving Averages
Current price sits near Fibonacci 0.236 retracement of the recent swing.
Price is trading below the EMA 13 & 34, but EMA 200 near 1.353x still acts as potential support.
🔸 Resistance to Watch
The next upside target sits at 1.3588, followed by the previous high at 1.3628.
🧠 Market Sentiment
Risk aversion is dominating due to geopolitical headlines.
GBP is vulnerable as a risk-sensitive currency.
However, if tensions ease and central bank decisions next week come in line with expectations, GBP could rebound from its currently discounted levels.
🎯 Trade Setup Suggestion
✅ BUY ZONE: 1.35350 – 1.34957
Stop-Loss: 1.3460
Take-Profit Targets: 1.3588 → 1.3628
Enter only on bullish price action confirmation around the support zone.
✅ Conclusion
GBPUSD is trading under geopolitical stress, but the technical setup around 1.3495 – 1.3535 offers a potential bounce zone. A short-term recovery could unfold if sentiment stabilizes and central banks maintain the expected policy stance.

Oil Price Rally Stalls at $77.72, Just Below 2025 HighFenzoFx—Oil prices resumed their bullish trend, accelerating after geopolitical tensions in the Middle East. The rally paused at $77.72, just below the 2025 high.
RSI 14 indicates an overbought market, while volume accumulation at $73.7 suggests possible sell orders. A consolidation phase is likely before further gains.
If oil pulls back, key demand zones at $64.00 and $66.00 offer bullish opportunities, with a potential move toward the 2025 high at $80.59.

Rate Cut Bets Keep Silver in FocusSilver slipped toward $36 per ounce as investors locked in gains after hitting a 13-year high. The metal remains supported by strong industrial demand, supply deficits, and safe-haven interest during global uncertainty. Industrial uses, especially in solar and electronics, account for over half of the demand. A fifth consecutive annual supply deficit is expected, though the Silver Institute sees the gap narrowing by 21% in 2025. Softer U.S. inflation data for May also increased expectations of Fed rate cuts beginning in September, helping sustain interest in precious metals.
Resistance is set at 36.90, while support stands at 35.40.

PVR INOX LTD at Support Zone.This is the 4 hours Chart of PVRINOX.
PVRINOX having good law of Polarity at 930 range.
If this level is sustain , then we may see higher prices in PVRINOX.
Thank You !!

Gold Surges Amid Middle East TensionsGold surged more than 1% to exceed $3,440, approaching record levels amid a sharp rise in safe-haven demand. The gains came after Israel's strike on Iran’s nuclear facilities, fueling concerns over a wider regional conflict. Uncertainty surrounding potential US tariffs added to market jitters. Additionally, softer US inflation data increased expectations for Federal Reserve rate cuts, enhancing gold's appeal as a non-yielding asset.
Resistance is seen at $3,430, while support holds at $3,350.
Weaker PPI Caps Dollar Strength in GBP/USDGBP/USD fell to around 1.3530 early Friday as escalating tensions in the Middle East supported demand for the US Dollar. Israel’s preemptive strike on Iran raised fears of retaliation, with Iranian officials warning of severe consequences for both the US and Israel, pressuring risk-linked currencies like the Pound. However, weaker US PPI data limited further USD strength. May’s PPI increased just 0.1%, below the 0.2% forecast, while the core PPI also came in softer. Attention now turns to the upcoming Michigan consumer sentiment report.
Resistance is at 1.3600, with support around 1.3425.

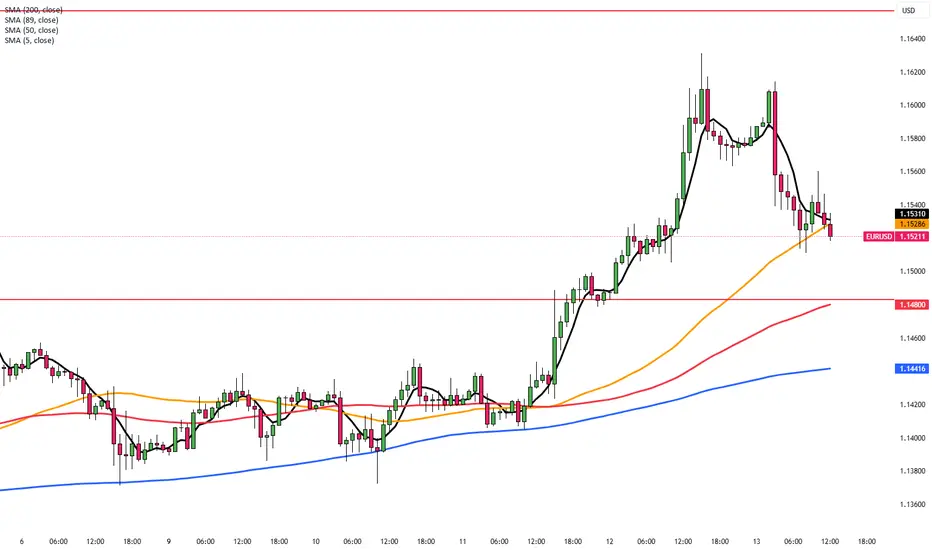
EUR/USD Slips on Geopolitical TensionsEUR/USD dropped to around 1.1530 on Friday, ending a four-day rally, as safe-haven demand lifted the US Dollar amid rising Middle East tensions.
Israel struck Iranian targets to weaken its nuclear program, prompting emergency measures. The US denied involvement but warned Iran not to target its assets.
Trump’s plan to expand steel tariffs from June 23 added trade uncertainty, while soft US inflation data kept Fed rate cut hopes alive.
Markets now await the US Michigan Sentiment report for further signals.
Resistance is located at 1.1580, while support is seen at 1.1460.
California Resources Corporation (CRC) – Stock Analysis and ForeCalifornia Resources Corporation, a key player in crude oil production and carbon management, has recently experienced a notable uptick in investor interest.
This momentum appears to be supported by macroeconomic tailwinds, including renewed trade tensions between the United States and other major economies.
Historically, geopolitical uncertainty often leads to increased energy demand and price volatility, both of which tend to benefit domestic oil producers like CRC.
From a fundamental standpoint, investor sentiment toward CRC has grown increasingly positive. The company’s strategic positioning in California's energy transition—particularly its focus on carbon capture and storage (CCS)—is beginning to resonate more with institutional investors looking to align portfolios with sustainable yet profitable energy operations.
If these supportive fundamentals continue, there is potential for the stock to reach $56 in the coming months, assuming no major changes to current market dynamics or geopolitical influences.
Technical Outlook:
Entry Point: $44.68
Stop Loss: $42.73
Take Profit 1: $50.84
Take Profit 2: $55.88
As always, trade with care, apply proper risk management, and ensure your positions align with your overall investment strategy.
If you find this helpful, kindly follow me, subscribe, like, comment and share.

Safe-Haven Demand Boosts Gold as Middle East Tensions EscalateHey Traders,
In today’s trading session, we are monitoring XAUUSD for a buying opportunity around the 3,380 zone. Gold is currently trading in an uptrend and is experiencing a correction phase as it pulls back toward this key support and resistance area.
On the fundamental side, reports indicate that Israel struck Iran overnight — fueling a classic geopolitical risk-off sentiment. This escalation is driving strength in safe-haven assets while putting pressure on riskier markets. Gold typically benefits from this kind of uncertainty, adding further weight to the technical setup we’re seeing today.
Trade safe,
Joe

Gold Surges on Middle East Conflict: What's the Next Move?XAUUSD – Gold Surges on Middle East Conflict: What's the Next Move?
🌍 Geopolitical Shock Fuels Market Volatility
The gold market responded sharply after Israel launched a series of targeted airstrikes on Iran’s nuclear facilities, including the Natanz uranium site. These actions triggered global concern:
Gold jumped to $3,430/oz, hitting a new weekly high
WTI crude surged by over 8%
US equity indices dipped significantly
The US remains officially neutral but confirmed it will defend its troops if provoked
Investors are now moving rapidly into safe-haven assets, especially gold.
📊 Technical Breakdown (H1/M30)
Trend Structure: Bullish momentum continues following the breakout above $3,392
Key Support Zone: $3,412–$3,426, with price holding above this region
Fair Value Gap (FVG): Identified between $3,405–$3,412, could act as re-entry zone
EMA Alignment: Price is above the 13, 34, 89, and 200 EMAs — signalling strength across short and long-term moving averages
Psychological Resistance: Eyes now on the $3,454–$3,456 zone for potential selling pressure
🧠 Market Sentiment & Risk Behaviour
Risk-off mood dominates: Capital is rotating into gold, CHF, and JPY
Traders are reacting to news headlines over economic data
Institutional flows are entering strongly on dips, building positions in defensive assets
🎯 Trade Setup for 13th June
✅ Buy Zone: 3384 – 3382
Stop-Loss: 3378
Targets: 3388 – 3392 – 3396 – 3400 – 3405 – 3410
❌ Sell Zone: 3454 – 3456
Stop-Loss: 3460
Targets: 3450 – 3446 – 3442 – 3438 – 3434 – 3430
📌 Tactical Summary
Gold remains a go-to asset amid geopolitical uncertainty. While the technicals support further upside, caution is warranted near resistance. Any easing in military headlines could trigger a fast retracement.
🔍 Pro tip: Avoid chasing. Let price confirm near key levels before entering. Manage risk diligently in high-volatility environments.

DOW JONES INDEX (US30): Pullback From Support
US30 shows some strength after a test of a key intraday support.
A cup and handle pattern on that and a violation of its neckline
indicate a local strength of the buyers.
I expect a pullback to 42550
❤️Please, support my work with like, thank you!❤️
I am part of Trade Nation's Influencer program and receive a monthly fee for using their TradingView charts in my analysis.

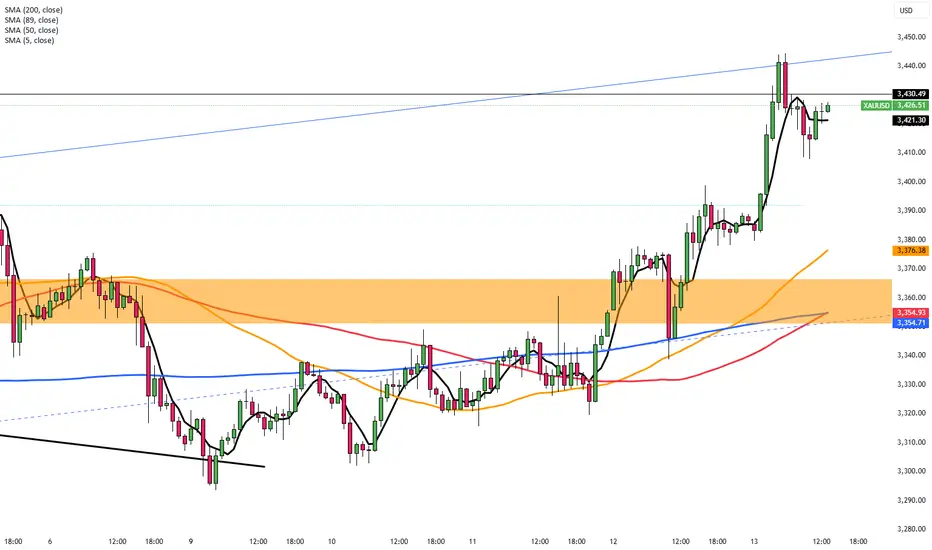
Gold (XAUUSD) Technical Breakdown : Structure Shifting + Target📍 Overview:
Gold (XAUUSD) has been displaying a classic technical development that traders need to pay close attention to. What initially looked like a smooth parabolic rally has now transitioned into a clear structure shift, as evidenced by the breakdown of a rounded support curve and rejection from a major resistance zone. The market is signaling a bearish retracement or even a deeper correction, and this setup offers potential trading opportunities both for short-term scalpers and swing traders.
📊 Chart Breakdown:
🔸 1. The Rounded Support Curve (Black Mind Curve):
The curve outlines a strong upward acceleration phase starting from the June 9 low.
This curve often acts like a dynamic support — similar to a parabolic trendline.
As long as price stays above it, the momentum remains intact.
In this case, Gold broke below the curve, which is a sign of exhaustion and potential bearish control.
🔸 2. Major Resistance Zone (~$3,417 – $3,427):
This level has acted as a ceiling multiple times in the past, visible in earlier highs from June 5 and 6.
Upon re-approaching this zone, price showed aggressive wicks to the upside followed by strong bearish candles — signaling institutional selling and profit-taking.
This triple rejection reinforced the resistance’s significance.
🔸 3. Structure Mapping and Transition:
After the breakdown, we observed a clean market structure shift: the formation of lower highs and lower lows, a key sign of bearish trend development.
The current price action is flowing downward in an organized pattern, suggesting further downside unless a strong reversal or bullish engulfing setup occurs.
🔸 4. Next Reversal Zone (~$3,360):
This area is identified as a high-probability support zone based on:
Past price reaction.
Previous accumulation zone from June 10–11.
Psychological round number proximity (e.g., $3,350 – $3,360).
Traders should monitor this level for potential reversal setups such as bullish engulfing candles, pin bars, or RSI divergence.
🧠 Market Psychology:
This pattern reflects a classic distribution phase at resistance after an emotionally driven uptrend:
Retail traders jump in late as the price approaches highs.
Institutions begin distributing (selling into strength).
Support breaks down as retail stops get triggered.
Price drops into a demand zone where accumulation may begin again.
Understanding this psychological cycle helps traders align with the smart money rather than chasing price action blindly.
🛠️ Potential Trading Plans:
✅ Scenario 1: Bearish Continuation
Wait for a retest of the broken structure (~$3,390 – $3,400).
Look for rejection patterns (e.g., bearish engulfing, shooting star).
Entry: ~$3,395–$3,400 | Target: ~$3,360 | SL: Above $3,420.
✅ Scenario 2: Bullish Reversal from Support
Monitor price action around $3,360 zone.
Look for bullish structure forming: higher lows, reversal candles, divergence.
Entry: On confirmation (e.g., bullish pin bar on 1H or 4H).
Target: Back to structure at ~$3,400–$3,410.
⚠️ Risk Considerations:
Avoid entering in the middle of the range.
Use proper stop-loss positioning to manage volatility.
Keep an eye on macro catalysts like:
US inflation reports
Fed commentary or interest rate decisions
Geopolitical tensions that can spike gold
🧭 Summary:
The market is unfolding a textbook technical setup:
Resistance rejection
Rounded support breakdown
Bearish structure
Approaching a high-probability support zone
Patience is key — let price come to your level. Watch the $3,360 zone for potential reversal, and use structure to guide entries and exits.
📌 Final Note:
This analysis is part of the MMC Methodology (Market Mapping Cycle), which focuses on identifying macro structure, confirming micro structure, and mapping turning points with precision.
Let the market reveal itself. Don't chase — plan and execute with clarity.

[INTRADAY] #BANKNIFTY PE & CE Levels(13/06/2025)Today, a gap-down opening is expected in Bank Nifty near the 55500 level. If Bank Nifty started trading below the 55450 mark after opening, we may witness further downside movement with targets around 55250, 55150, and possibly 55050 during the session.
On the upside, if Bank Nifty manages to bounce and sustain above the 56050–56100 zone, it could signal a potential recovery. In such a case, we may see a rally toward 56250, 56350, and 56450+ levels.
Traders should remain cautious as the broader structure suggests continued weakness unless Bank Nifty reclaims and holds above the 56050 level. Strict stop-loss and profit trailing are advised, as sharp intraday volatility is expected around support zones.

Nightly $SPY / $SPX Scenarios for June 13, 2025 🔮 Nightly AMEX:SPY / SP:SPX Scenarios for June 13, 2025 🔮
🌍 Market-Moving News 🌍
🚨 Israel Strikes Iran — U.S. Markets Sell Off
Israel launched airstrikes on Iran’s nuclear and military facilities, triggering a sharp risk-off move in global markets. U.S. stock futures slid over 1%, driven by a drop in equities and a surge in safe-haven assets
🛢️ Oil Prices Surge 7–8% on Supply Fears
Brent crude jumped over 7%, reaching ~$74.65/barrel, while WTI rose nearly 8%—the strongest move since early May. The sudden energy-price spike reflects heightened fears of supply disruptions in the Middle East
💱 Dollar & Safe Havens Climb
True to form, the U.S. dollar, Japanese yen, Swiss franc, gold, and Treasuries rallied as investors moved to the safety of low-risk assets amid escalating geopolitical uncertainty
📊 Key Data Releases 📊
📅 Friday, June 13
(No scheduled U.S. economic data)
Data flow will take a backseat as markets digest geopolitical developments and await the weekend.
⚠️ Disclaimer:
This information is for educational and informational purposes only and should not be construed as financial advice. Always consult a licensed financial advisor before making investment decisions.
📌 #trading #stockmarket #geopolitics #oil #safety #charting #technicalanalysis

Strongest stock of the day with 3 Buy $CGTL1st and 3rd alert paid for the whole day, including 2nd which was cut quick at $1.70

Teva: The flag’s ready — someone just needs to hit “launch”Teva Pharmaceutical (TEVA) is setting up for a potential continuation move after a clean impulse. On the daily chart, we have a textbook bull pennant — and not just any sloppy one. Price has broken above the 200-day moving average, and all key EMAs (50/100/200) now sit below price, confirming a solid bullish structure.
Volume behavior fits the script: declining inside the pennant, signaling pressure is building. More importantly, the Volume Profile reveals a low-volume void above current levels — meaning there’s little resistance until we hit the $22+ zone. In other words, once this breaks, it could run fast.
RSI is comfortably in bullish territory without being overheated, and the flagpole projection gives us clean upside targets:
– Entry: breakout above pennant resistance
– Target: $22.80 — full flagpole height
– Support: $17.60 — confluence of 0.5 Fib + volume base
TEVA isn’t asking for confirmation anymore — it’s showing it. All systems are technically armed. Now we just wait for the market to press the button.

EURGBP: Overbought Market & Pullback🇪🇺🇬🇧
EURGBP nicely respected a key daily horizontal resistance.
After a liquidity grab above that, the price formed
a strong bearish imbalance candle on an hourly time frame.
I think that the pair will retrace to 0.85
❤️Please, support my work with like, thank you!❤️
I am part of Trade Nation's Influencer program and receive a monthly fee for using their TradingView charts in my analysis.

Crude Oil Eyes 65.40 Support Amid Middle East Uncertainty!!Hey Traders,
In today’s trading session, we’re closely monitoring USOIL for a potential buying opportunity around the 65.40 zone. The commodity remains in an overall uptrend, and is currently undergoing a corrective phase, approaching a key support/resistance area near 65.40. This level aligns well with the broader trend structure and may offer a favorable risk-to-reward setup.
On the fundamental side, geopolitical tensions are on the rise. Reports indicate that U.S. embassy personnel are being evacuated from parts of the Middle East amid growing regional instability. Allegedly, Israel is preparing for potential military action against Iran should nuclear deal talks collapse.
If these tensions escalate further into military conflict, oil prices could spike in response to the heightened risk to regional supply chains.
Trade safe,
Joe

DXY H4 – Dollar Weakens Ahead of PPI Release DXY H4 – Dollar Weakens Ahead of PPI Release | Is the Market Pricing in a Fed Pivot?
🌐 Macro & Fundamental Context
As we head into the New York session on June 12, the market’s attention shifts to one critical data point: the US PPI (Producer Price Index). Following the softer-than-expected CPI reading of 2.4% YoY (vs. 2.5% forecast), the Dollar Index (DXY) dropped sharply—signaling fading inflation pressure and reigniting rate cut expectations.
✅ Bearish Fundamentals Building for the USD:
CPI miss fuels Fed rate cut bets (currently ~65% chance for September per FedWatch Tool).
US Treasury yields are easing, reflecting the market’s pricing of a less aggressive Fed.
Risk assets rallying as capital flows rotate away from USD into gold, equities, and long-duration bonds.
If today’s PPI also comes in below forecast, it could confirm a deeper correction in DXY. Conversely, a surprise PPI upside might trigger a short-term pullback.
📉 Technical Analysis – H4 Timeframe
🔹 Overall Trend:
DXY is locked within a clearly defined descending channel, with a consistent Lower High – Lower Low structure holding since late May.
🔹 Key Technical Zones:
Short-term resistance: 98.548 – likely to act as a ceiling unless PPI surprises to the upside.
Immediate support: 97.966 – a break below opens the door toward the key support zone at 97.191, which aligns with previous FVG imbalance and multi-timeframe demand.
🔹 EMA Structure:
Price remains below all major EMAs (13 – 34 – 89 – 200), confirming persistent bearish pressure.
EMA13 is currently acting as dynamic resistance on H4, pressing down on price.
🧠 Market Sentiment & Flow Insight
Investors are rotating out of USD as inflation fears fade and Fed easing expectations increase.
Risk-on sentiment is returning, benefiting gold and stocks while weighing on DXY.
However, a hot PPI print could spook the market briefly, leading to a corrective bounce in the Dollar before the trend resumes.
🔍 Scenarios to Watch:
PPI comes in lower than expected:
DXY may retest 98.548 resistance and reject lower.
Next targets: 97.966 → 97.191
PPI surprises to the upside:
Technical bounce toward 98.5–98.8 possible.
But trend remains bearish unless price reclaims 99.2+ zone.
✅ Conclusion
DXY remains under pressure from both macro and technical angles. The PPI report will be the next catalyst that determines whether this is a short-term dip or the continuation of a broader USD downtrend.
🎯 Tactical view: Favour short positions on DXY if price bounces into resistance and PPI supports the disinflation narrative. Target: 97.1 and below.

GOLD (XAU/USD) Technical Analysis: Bull Trend Pausing or Reverse🧠 GOLD (XAU/USD) Technical Analysis
GOLD has been trading in a broad bullish trend, supported by global uncertainty and consistent interest in safe-haven assets. However, today’s intraday structure shows signs of potential exhaustion after a clean tap of a major resistance/QFL zone.
In this analysis, I break down the key zones, trader psychology, market structure, and potential playbook for upcoming moves.
📊 Technical Structure Breakdown:
🔷 1. SR Interchange Zone – The Flip Level
Marked early in the chart, the SR Interchange area served as a major resistance, which was broken and then retested — confirming a classic S/R flip. This level added confluence to the uptrend that followed.
Trader Insight: This is where buyers got confident after the retest. Smart money often leaves footprints at such interchange zones.
🔷 2. Ascending Channel – The Guiding Rail
GOLD has been respecting an upward channel for several days. Price bounced multiple times off both upper and lower channel boundaries. This gives a clear roadmap for intraday traders to watch for bounces, midline reactions, and possible breakouts.
Channel dynamics: Right now, price has rejected from the top of the channel, suggesting possible movement back toward the midline or bottom rail.
🔷 3. QFL Rejection – Trap Zone Activated
Price recently hit the QFL zone, which aligns closely with previous highs and liquidity pools. This level acted as a liquidity trap where buyers got over-leveraged or late entries piled in — only to see a strong rejection right after.
This sharp drop from the QFL area signals institutional sell pressure or heavy profit-taking. It’s not just a pullback — it’s a signal.
🧱 Key Zones to Watch:
Zone Type Relevance
$3,380 - $3,400 QFL / Resistance Rejection point, likely full of stop-losses and liquidity
$3,340 - $3,320 Reversal Area / Demand Potential buyer re-entry and bounce zone
$3,300 and below Liquidity Pool If demand fails, price could slide into this liquidity zone
📉 Bearish Case: Reversal in Motion?
If the current rejection from QFL continues without any strong bounce at the reversal zone:
Expect price to retest the lower channel and possibly breakdown.
Sell pressure could increase due to trapped long positions trying to exit.
Target: $3,320 → $3,300 → possible $3,280 extension.
✅ Entry: Look for failed retests of the QFL zone or lower highs
📍 SL: Above $3,385
🎯 TP: First target near $3,320, then trail stops.
📈 Bullish Case: Controlled Pullback Before Lift-Off
If price finds strong support in the Reversal Area:
Look for bullish engulfing, hammer, or double bottom patterns in the area.
Could be a healthy pullback before continuation to $3,400+.
Target: $3,380 → $3,420 and even higher if breakout is strong.
✅ Entry: Confirmation after bullish reaction at $3,340 zone
📍 SL: Below $3,315
🎯 TP: $3,380+, trail if breakout holds
🔄 Trader Psychology in Action:
Late buyers entered after the breakout toward $3,380.
Smart money exited near the top or flipped bias near QFL.
Retail panic selling might happen if support fails, offering re-entry for institutions at better prices.
Discipline Tip: Let price confirm your bias. Don’t chase.
📌 Final Thoughts & Trade Plan:
GOLD is at a decision point. Whether you're trading intraday or swing, your focus should be on:
Watching how price reacts to the Reversal Area
Identifying fakeouts vs true breaks at channel boundaries
Staying patient for confirmation (don’t jump in on impulse)
This setup provides an excellent opportunity for both bullish and bearish traders — just stay unbiased and reactive, not predictive.
