Gold (XAUUSD) Technical Analysis : MMC Setup Confirmed + Target📊 1. Market Structure Overview
After a strong rally earlier this month, XAUUSD entered a corrective phase and formed a descending trendline which acted as resistance for multiple days. This trendline has just been tested and broken, suggesting that the correction may be coming to an end.
At the same time, price is showing signs of strength by bouncing off the lower boundary of a long-standing parallel ascending channel—a structure that has acted as dynamic support over the past two weeks.
🧱 2. Key Technical Elements
🟦 Support/Resistance Interchange Zone (S/R Flip)
Price recently interacted with a horizontal S/R interchange zone around the $3,310–$3,330 area.
This zone served as resistance during the earlier part of the trend and is now acting as support after the breakout.
It also overlaps with the mid-section of the ascending channel, adding confluence to this support area.
📐 Descending Trendline Break
The break above the descending trendline signals a potential shift in momentum.
Traders often view this kind of breakout as an early indicator of bullish continuation, especially when combined with volume or retests.
🟩 Next Reversal/Target Zone
A green box is highlighted around the $3,345–$3,355 zone, which could act as the next resistance or reversal level.
This is based on prior market structure and Fibonacci extension zones.
This area may offer a take-profit level for longs or a short-term reversal zone for countertrend traders.
🔍 3. What to Watch
✅ Bullish Scenario
If the price sustains above $3,310 and holds above the broken trendline, we could see a push toward the $3,345–$3,355 area.
Ideal long entries may occur on a retest of the trendline or the S/R flip zone, confirming it as support.
❌ Bearish Scenario
Failure to hold above the $3,300–$3,310 support region would invalidate the breakout.
A clean break below this zone could result in a drop back to the lower parallel channel boundary near $3,270 or even lower.
⚙️ 4. Trading Plan & Bias
Short-term Bias: Bullish (Trendline break + support hold)
Mid-term Bias: Cautiously Bullish (until major resistance is tested)
Risk Management: Stop-loss for long entries should be placed below $3,300 with targets near $3,345 and $3,355.
💬 Conclusion
This setup presents a classic case of trendline breakout + S/R flip confluence, which often leads to favorable risk/reward opportunities. Gold traders should monitor the retest behavior around current levels closely, as it will likely determine the next directional move.
📌 Always wait for confirmation, manage risk, and don’t chase moves—especially near major zones.
Technical Analysis

EURUSD – Still a chance to rebound if support holdsEURUSD has recently pulled back slightly after approaching resistance near the rising trendline. Currently, price is heading back to retest the support zone around 1.13200 – a key confluence area with the EMA89 and previous swing lows. This is a crucial level. If it holds, there’s a strong possibility for a rebound toward the 1.14280 resistance area.
On the H4 timeframe, the price structure remains within an ascending channel with no clear signs of trend reversal. The formation of higher lows suggests that buying pressure is still present. Notably, if this week’s CPI, PPI, and NFP data come in weaker than expected, market sentiment may shift further toward the idea of an early Fed rate cut – potentially providing a lift for EURUSD.
Additionally, rising geopolitical tensions could increase risk aversion, weakening the USD and further supporting the euro.

#NIFTY Intraday Support and Resistance Levels - 10/06/2025Nifty is opening with a gap-up near the 25250 level, approaching a crucial resistance zone. This area has previously acted as a turning point, and today's opening could define whether bulls retain control or face exhaustion.
If Nifty sustains above 25250, we can expect further upside momentum toward 25350, 25400, and 25450+. A clean breakout above this level could open the path to short-term bullish continuation.
However, if the index struggles to hold above 25250 and reverses, profit booking may kick in, pulling the index back toward 25150, 25100, and even 25050.
Holding above 25050–25100 will be key for maintaining a positive structure. A breakdown below this zone may shift sentiment in favor of bears.

[INTRADAY] #BANKNIFTY PE & CE Levels(10/06/2025)Bank Nifty is expected to open with a gap-up around the 57000 level, placing it directly at a critical resistance zone. This area has previously acted as a rejection point, making today's price action especially significant.
If the index sustains above 57050, it may trigger a fresh bullish leg with potential upside targets at 57250, 57350, and 57450+. Strong momentum above this range could lead to continued buying pressure through the session.
However, if Bank Nifty fails to hold above 57000 and starts rejecting the zone, a reversal may play out. In that case, downside movement toward 56750, 56650, and 56550 can be expected.
Holding above 56550–56600 is essential to maintain bullish structure. If the price dips below that, short-term weakness may extend.

Nightly $SPY / $SPX Scenarios for June 10, 2025🔮 Nightly AMEX:SPY / SP:SPX Scenarios for June 10, 2025 🔮
🌍 Market-Moving News 🌍
📱 Apple Disappoints at WWDC Keynote
Apple ( NASDAQ:AAPL ) faced criticism after a lackluster WWDC keynote. Major AI and Siri upgrades were delayed, prompting a 1–1.5% drop in Apple shares—the weakest move during today's presentation
🎮 GameStop to Report Q1, Crypto Pivot in Focus
GameStop ( NYSE:GME ) is scheduled to announce Q1 earnings after market close. Investors will be watching for updates on its $500M Bitcoin allocation and potential crypto-related strategies
📈 Small-Business Optimism Rises
The NFIB Small Business Optimism Index for May came in at 95.9—above the 94.9 consensus—showing modest improvement in sentiment among small firms
📊 Key Data Releases & Events 📊
📅 Tuesday, June 10:
6:00 AM ET – NFIB Small Business Optimism (May):
A reading above expectations could boost risk market sentiment by showing stronger Main Street confidence.
⚠️ Disclaimer:
This is for educational/informational purposes only and does not constitute financial advice. Please consult a licensed professional before making investment decisions.
📌 #trading #stockmarket #economy #news #trendtao #charting #technicalanalysis

BIG 441% Monday from $0.60 to $3.25 $OMH🔥 BIG 441% Monday from $0.60 to $3.25
Easiest money made today was on NASDAQ:OMH buy before halt, then once it came out of halt it was just gapped up into 💸💸💸

EURUSD: Breakout and Potential RetraceHey Traders, in today's trading session we are monitoring EURUSD for a selling opportunity around 1.14200 zone, EURUSD was trading in an uptrend and successfully managed to break it out. Currently is in a correction phase in which it is approaching the retrace area at 1.14200 support and resistance zone.
Trade safe, Joe.

AUDJPY Potential UpsidesHey Traders, in today's trading session we are monitoring AUDJPY for a buying opportunity around 94.000 zone, AUDJPY is trading in an uptrend and currently is in a correction phase in which it is approaching the trend at 94.000 support and resistance area.
Trade safe, Joe.

GBPNZD: Classic Pullback Trade 🇬🇧🇳🇿
GBPNZD may pull back from the underlined horizontal support.
As a confirmation, I see a rejection from that first,
and a formation of a bullish imbalance candle on 1H time frame then.
Goal - 2.244
❤️Please, support my work with like, thank you!❤️

09/06/2025: WILL WE SEE A BREAKOUT ABOVE 1.3550?GBP/USD PLAN – 09/06/2025: WILL WE SEE A BREAKOUT ABOVE 1.3550?
🌍 Macroeconomic & Fundamental Context:
UK Economic Outlook (BoE): The Bank of England (BoE) is under pressure due to inflation and has to make decisions regarding interest rate policy. Diverging opinions on whether to raise or lower rates are creating uncertainty in the market.
US Economic Outlook (Fed): The Federal Reserve's monetary policy continues to be a major influence on the USD, especially as the Fed maintains its rate hikes to control inflation.
US-UK Trade Relations: Trade negotiations between the US and the UK will remain an important factor this week, and any new developments could impact GBP/USD.
📉 Technical Analysis – GBP/USD:
On the H4 and H1 timeframes, GBP/USD is consolidating within a corrective structure, and price has broken several key Fibonacci levels. The EMA indicators (13, 34, 89) are showing strong momentum.
Key Resistance Levels:
1.3550 – This is a major resistance level. If broken, GBP/USD could continue its rally towards 1.3612.
Key Support Levels:
1.3520 – A short-term support level. If this breaks, price may retrace back to 1.3470.
🎯 Trading Scenarios for Today:
🟢 BUY ZONE:
Buy Zone: 1.3520 – 1.3500
SL: 1.3480
TP: 1.3550 → 1.3570 → 1.3600 → 1.3620 → 1.3650
If price retraces to 1.3520 – 1.3500, this would be an ideal buying opportunity with a target at 1.3550. Look for confirmation from technical indicators and the current trend.
🔴 SELL ZONE:
Sell Zone: 1.3550 – 1.3570
SL: 1.3590
TP: 1.3520 → 1.3500 → 1.3470 → 1.3450 → 1.3420
If price reaches the resistance zone of 1.3550 – 1.3570, consider selling with targets at the support levels below.
🟡 Scalping:
Buy Scalping: 1.3520 → 1.3500
Sell Scalping: 1.3570 → 1.3600
Look for short-term opportunities when price moves within the range.
⚠️ Important Notes:
Pay close attention to short-term fluctuations and any major economic data releases from the BoE and Fed.
Risk management is key during volatile periods.
📌 Conclusion:
GBP/USD is in a short-term corrective phase, but a breakout above 1.3550 could trigger a strong rally. Traders should monitor support and resistance levels carefully and ensure risk management is in place.

JPYUSD Smart Money VIP Analysis – Eyeing High-Probability Target📈 Market Context:
The JPYUSD (Japanese Yen vs. US Dollar) is currently navigating through a critical structure phase where price is reacting to previously established institutional zones. Recent price movements reveal a clean and structured setup — one that aligns perfectly with Smart Money Concepts (SMC) and CHoCH (Change of Character) theory.
This 2H chart provides a roadmap for anticipating the next high-probability reversal, giving traders an edge in both short-term scalps and mid-term swing trades.
🔍 In-Depth Chart Analysis:
🧱 Resistance Zone (0.007020–0.007040):
This area has been tested multiple times in the past and acted as a strong supply zone. Institutional orders have previously caused significant bearish pressure from this level. Unless a strong bullish breakout occurs with volume, this zone is likely to hold again.
🔁 Next Reversal Zone (0.006975–0.006985):
Price is currently climbing from the SR Interchange Zone, heading toward this marked reversal area. Here's why this zone matters:
Confluence of past resistance and imbalance
Potential liquidity sweep above minor highs
Perfect setup for a bearish reaction to form a lower high
Traders should watch for signs of weak bullish candles, wicks, or a bearish engulfing here.
🔄 SR Interchange (Support-Resistance Flip):
This level held firm, showing buyer interest after a previous structure break. It signals a healthy correction phase — a typical SMC signature before larger moves occur. The market is offering a retracement opportunity.
🟡 CHoCH Zones:
Minor CHoCH (0.006900): A break and close below this level would invalidate bullish correction and confirm the shift in momentum.
Major CHoCH (0.006840): The final confirmation of bearish dominance. A breach here opens the door for new lows, targeting long-term support areas.
⚔️ Smart Money Playbook:
Current Move: Price is in bullish retracement from previous demand zone
Watch Zone: 0.006975–0.006985 (Potential Smart Money sell zone)
Reaction Setup:
Bearish structure forms (e.g., M pattern, liquidity sweep, bearish engulfing)
Price breaks minor CHoCH
Sell Entry: After confirmation, with stops above reversal zone
TP1: SR Interchange level
TP2: Major CHoCH zone
📅 Fundamental Triggers Ahead:
Watch for upcoming USD economic data (CPI, PPI, interest rate decisions) between June 11–14, which could act as catalysts for volatility and confirm technical setups.
🧠 Educational Note:
This setup is a classic example of market structure shift, liquidity engineering, and order block theory — concepts used by banks and smart money traders. Retail traders often get trapped on the wrong side of these zones. Your edge lies in anticipating the trap, not reacting to it.
🎯 Conclusion:
JPYUSD is offering a textbook Smart Money setup. The current retracement gives an opportunity to position early into a likely bearish continuation, provided structure confirms at the next reversal zone. Patience, discipline, and precise timing will be key to capitalizing on this move.

XRPUSDT Double-Bottom Breakout: $2.50 Target in Sight?The classic double‑bottom breakout appears to be unfolding between ~$2.06–2.10, confirmed when price broke above the neckline at ~$2.28.
Traditional analysis suggests measuring the distance from the bottoms to the neckline, and projecting this upward, setting a breakout target near $2.50
Key Levels to Monitor
Support zone: $2.06–2.10 — must hold above this area to keep the bullish structure intact
Near-term resistance: $2.28 – recent neckline sit here
Next resistance levels: $2.50, $2.65–2.70, and even $3.00 if momentum supports it
Volume & Confirmation
Confirmation of this breakout should come with increased volume. The current volume has been relatively subdued, indicating possible weakening momentum.
A clean breakout above $2.28 accompanied by a volume spike and bullish candlestick (e.g., engulfing pattern) would solidify the breakout.
Invalidation
A drop below $2.06–2.10 would break the double‑bottom structure, opening the door to deeper support tests around $2.00 or even $1.70
Not financial advice.

WILL EUR CONTINUE TO RALLY AHEAD OF THE IMPORTANT NFP DATA?EUR/USD – WILL EUR CONTINUE TO RALLY AHEAD OF THE IMPORTANT NFP DATA?
📈 EUR/USD IS AT A CRITICAL POINT AHEAD OF KEY ECONOMIC DATA
Amid the ongoing pressure on the US Dollar and macroeconomic factors supporting the Euro, EUR/USD might continue its short-term bullish trend. However, key data such as US CPI and central bank meetings could determine the direction for this currency pair moving forward.
🌍 Macroeconomic Overview & Market Sentiment
USD & DXY: The US Dollar continues to weaken due to signals from the Federal Reserve (Fed) that they are not in a hurry to cut interest rates. DXY has fallen below the 99 level, with macroeconomic factors showing a continued bearish trend for the USD.
Eurozone: The ECB (European Central Bank) is maintaining a slightly tight monetary policy. However, the Eurozone economy is showing signs of recovery, with positive data from the region.
US Economy: Forecasts for the US labor market data could impact the USD and lead to volatility in the EUR/USD pair. All attention is on the reports from the US this week.
📊 Technical Analysis (H1 – H4 – D1)
EMA 13/34/89/200: The EMA indicators on the H1 and H4 timeframes support the current bullish trend for EUR/USD in the short term. In particular, the EMA 13 and EMA 34 are crossing above the EMA 200, signaling a strong upward trend.
Wave Structure: EUR/USD is currently in a corrective wave after testing the strong resistance level at 1.1450. A recovery signal is emerging around the support level at 1.1380, which could present a buying opportunity in the short term.
Fibonacci Expansion: The Fibonacci extension levels at 1.1470 and 1.1490 could be the next targets if EUR/USD breaks through the 1.1400 resistance zone.
⚡ Key Levels to Watch
Resistance: 1.1450, 1.1470, 1.1490, 1.1500
Support: 1.1380, 1.1350, 1.1320, 1.1300
🧭 Trading Scenario
🔵 BUY ZONE: 1.1380 – 1.1365
SL: 1.1340
TP: 1.1420 → 1.1450 → 1.1470 → 1.1490
🔻 SELL ZONE: 1.1450 – 1.1460
SL: 1.1475
TP: 1.1420 → 1.1400 → 1.1370 → 1.1350
✅ Summary
EUR/USD is currently in a short-term bullish trend and could continue to rise if the support at 1.1365 holds. However, key economic data from the US, especially CPI and central bank meetings from the Fed and ECB, could impact the next direction for this pair. Traders should keep an eye on important support and resistance levels to identify safe trading opportunities.

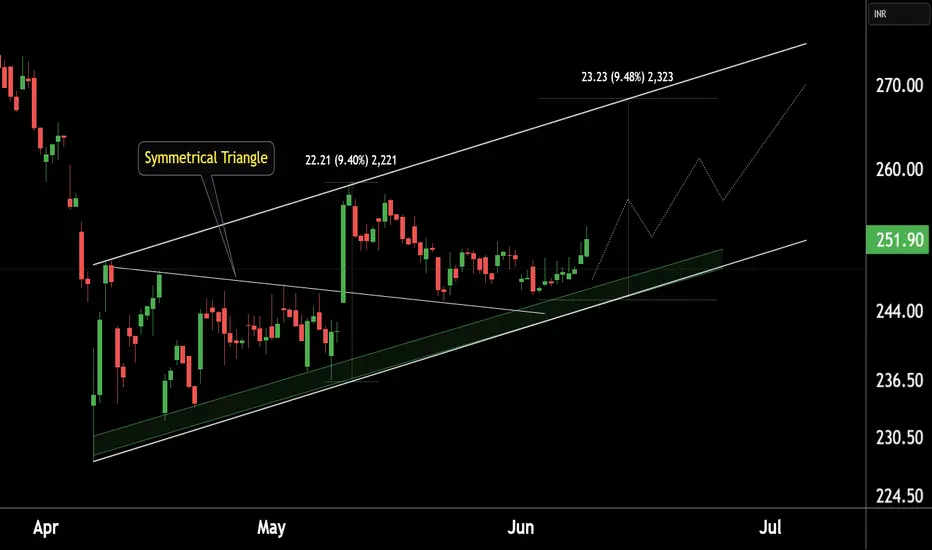
WIPRO at Best Support !!This is the 4 hour chart of Wipro ltd.
WIPRO has a strong support zone in the 245–248 range.
WIPRO is forming a symmetrical triangle pattern, with a potential target of 268, which also aligns with the channel's resistance zone at 268-270."
If this level is sustain , we may see higher prices in Wipro !!
Thank You
BTCUSD VIP Analysis – Clean Breakout Toward 109K + Target🧠 Full Technical Breakdown for TradingView & Minds
🗓 Date: June 9, 2025 | Asset: Bitcoin (BTC/USD) | Chart: 2H Timeframe
Bitcoin is currently staging a strong breakout rally after consolidating within a bullish structure. This move appears to be fueled by smart money accumulation and could lead us directly into a high-probability reversal zone just below 109K.
Let’s dive into the full structure and what traders should look out for next.
🔍 1. Previous Market Behavior (Left Side of Chart):
Before the breakout, BTC had been trading inside a bearish channel, experiencing sharp rejections and forming lower highs. This downtrend climaxed at the Previous Reversal Zone, where strong buyer interest kicked in — this is a textbook example of a liquidity grab followed by buyer absorption.
📈 2. The Reversal & Blue Ray:
From the Previous Reversal Zone, BTC formed a solid impulsive move upward — this is where the Blue Ray trendline was drawn. This level acted as the initial support for the new bullish structure.
The move from this point formed a new trend, indicating that buyers had successfully reclaimed short-term control of the market.
🟩 3. Central Zone – Bullish Reaccumulation Area:
As BTC progressed, it entered a green bullish channel, which we’ve labeled the Central Zone. This zone shows consolidation within a rising wedge, typically a continuation pattern if volume remains steady.
Notice how price respected both boundaries of the channel multiple times before exploding upwards. This is a sign of smart money reaccumulation, where institutions are quietly preparing for the next leg.
🚀 4. Breakout to the Upside:
BTC has now broken out cleanly from the Central Zone with an aggressive bullish candle, pushing price above 106,000. This breakout suggests a mid-move continuation, and current price action is heading straight for the Next Reversal Zone between 108,800–109,200.
Also note the clean cross above the 50% Fibonacci zone, which further supports the bullish thesis.
🔹 5. Next Reversal Zone (Target Area):
This is the most critical zone on the chart. Price may:
Reject sharply from this area (short opportunity),
Consolidate before continuation,
Or sweep liquidity above it and reverse hard.
This zone could act as a smart money sell zone, where large players unload positions, especially if retail traders jump in late.
🧮 6. Possible Scenarios Ahead:
Scenario A – Bullish Continuation:
Price breaks 109K cleanly with volume.
Next target: 111K–112K (extension level).
Scenario B – Rejection from Reversal Zone:
Price stalls near 109K.
Bearish engulfing candle forms.
Short opportunity back toward 106K–104K.
Scenario C – Fakeout Above 109K:
Price sweeps highs (liquidity trap).
Fast reversal back into Central Zone.
🎯 Trade Setups:
🚨 Breakout Buy (Already Triggered):
Entry: 105,500–106,000
Target 1: 107,500
Target 2: 108,800
SL: 104,800
🛑 Reversal Short (Pending):
Entry: 108,900–109,100 (with confirmation)
Target: 106,000
SL: 109,600
⚠️ Fundamental Awareness:
Multiple U.S. economic events this week (see calendar icons below the chart).
Increased volatility expected — use smaller positions or wider stops near data release times.
📌 Final Thoughts:
This is a classic example of smart money behavior — liquidity grab, controlled reaccumulation, then a breakout toward a magnet zone (reversal supply). If you're already in the move, manage your positions. If not, wait for price action confirmation near the key zone.

Will the Trend Explode or Continue to Retrace? XAUUSD Trading Plan - Will the Trend Explode or Continue to Retrace? 🔥
📉 Current Situation:
Gold is currently undergoing a retracement after a strong increase at the beginning of the week. The market is being influenced by macroeconomic factors like the US-China trade negotiations and fluctuations in the US dollar. Gold may either continue its retracement or break out of the current price range.
🔧 Technical Analysis:
🔶 Key Levels:
🔶 Support Zone: 3,276.121 - 3,289.874. These zones are crucial in confirming the strength of the bullish trend.
🔶 Resistance Zone: 3,345.715, 3,363.845. If these levels are broken, gold could continue to rise sharply.
📊 Technical Indicators:
The Exponential Moving Averages (EMA) 13, 34, and 89 support the short-term bullish trend.
The trendline shows that the bullish trend is intact, but a slight correction may happen in the short term.
💼 Fundamental and Macro Analysis:
The US-China trade negotiations are the key drivers of market sentiment. If the negotiations yield positive news, gold could continue to rise. However, if concerns arise about tariffs or failed talks, gold could face pressure.
Key US economic indicators, such as PMI, GDP, and NFP, will play a crucial role in shaping the direction of the US dollar, and thus, the price of gold.
🎯 Trading Plan:
🔶 Buy Zone:
Entry Zone: 3,289.874 - 3,276.121
Stop Loss (SL): 3,269.000
Take Profit (TP):
TP 1: 3,302.000
TP 2: 3,317.000
TP 3: 3,327.000
TP 4: 3,340.000
🔶 Sell Zone:
Entry Zone: 3,345.715 - 3,363.845
Stop Loss (SL): 3,370.000
Take Profit (TP):
TP 1: 3,327.000
TP 2: 3,310.000
TP 3: 3,300.000
TP 4: 3,289.000
⚠️ Key Points to Watch:
🔒 Strong Support Zone: 3,289.874 represents a key support zone. If the price breaks below this level, we could see gold approach 3,276.121.
🔓 Strong Resistance Zone: 3,345.715 - 3,363.845 is the key resistance zone. If broken, gold could continue to rise to 3,380.000 or higher.
📈 Market Psychology:
Gold is in a retracement phase after a significant rise, but both technical and fundamental factors suggest that the bullish trend may continue. It is essential to closely monitor signals from the US-China trade negotiations and economic news affecting the US dollar.
💥 Conclusion:
Gold is in a retracement phase after a strong increase, but technical and fundamental factors indicate that a bullish recovery could be on the horizon. Prepare your trading plans based on key support and resistance levels.
📌 Good luck and happy trading to all!

XAUUSD Analysis – From Bullish Momentum to Target🔍 Overview:
Gold has officially broken its ascending trendline, signaling a shift in market structure from bullish to bearish. This trendline acted as dynamic support for days, but its breakdown has opened the doors to potential downside movement. We're now in a phase where lower highs and lower lows are forming — a classic bearish signal.
📌 Key Levels & Price Zones:
🔻 Trendline Breakdown
A strong upward trendline was broken, confirming that bullish momentum has weakened. The trendline break was followed by aggressive bearish candles, signaling that sellers are gaining strength.
🔄 SR Interchange Zone (~3,322 – 3,330)
This area once acted as strong support and has now flipped to resistance. It’s a key level to watch for rejections or false breakouts. As long as the price stays below it, the bias remains bearish.
🔽 Mini Support Zone (~3,345 – 3,350)
A weak support area that could be retested. If price fails to hold above it, sellers will likely take over again.
⚠️ Minor CHoCH (~3,290)
This level marks the short-term structure shift. A breakdown here will confirm continuation to the downside. A short opportunity might present itself below this zone.
🌀 Next Reversal Zone (~3,275 – 3,280)
A potential demand area. Watch how the price reacts — this is where bulls might step in temporarily for a bounce or consolidation.
🚨 Major CHoCH (~3,265)
This is a critical support level. If it breaks, the entire bullish structure from early June is invalidated, opening the door to deeper retracement.
📈 Forecast Path:
Based on the price projection:
Expect lower highs to form.
If bearish momentum continues, we could see a breakdown below Minor CHoCH, targeting the Next Reversal Zone.
A clean break below 3,265 would signal a major trend change, confirming bearish control.
📊 Trade Ideas:
🔻 Short-Term Bearish Scenario:
Look for price to reject the SR Interchange or Mini Support zones.
Entry: After confirmation below 3,330
Targets: 3,290 → 3,275 → 3,265
SL: Above 3,350
🔼 Bullish Bounce Scenario:
If price reaches 3,275 and forms bullish confirmation (engulfing candle, divergence), we might see a short-term reversal.
Entry: On bullish candle close from support zone
Target: Back to 3,322 or higher
📅 Upcoming Events to Watch:
There are several U.S. economic data releases coming this week (marked on the chart). These can create sharp moves in XAUUSD, so manage your risk wisely.
✅ Final Thoughts:
Gold is at a key turning point. The breakdown from the trendline is significant, and structure now favors sellers — unless bulls reclaim critical levels. Wait for confirmation before entering, and always trade with proper risk management.
📌 Follow for more clean chart breakdowns, updates, and trade setups!

AUDUSD BULLISH OR BEARISH DETAILED ANALYSISAUDUSD is currently forming a strong ascending triangle on the 8H chart, with a series of higher lows pressuring a key horizontal resistance zone around 0.65250–0.65300. This is a classic bullish continuation pattern, indicating buyer strength and a potential breakout toward 0.67000 if the structure confirms. The current price action at 0.65285 shows that bulls are testing the upper boundary again, signaling possible breakout acceleration as we move into mid-June volatility.
From a macro standpoint, the Australian dollar is supported by rising commodity demand, particularly in iron ore and copper — both of which are showing strength in global markets. At the same time, the Federal Reserve remains cautious with its rate path, with recent U.S. labor data pointing to a cooling job market. Traders are now pricing in possible rate cuts sooner than expected, weakening the dollar’s bullish grip. This divergence in central bank tone and economic performance favors risk-on currencies like the AUD.
Technically, the ascending triangle is providing solid structure and confluence. Breakout traders may look for a clean candle close above 0.65350, which could open the path to the 0.67000 zone with minimal resistance ahead. A well-placed stop below the 0.64500 zone keeps risk controlled, and the favorable risk-to-reward ratio makes this setup ideal for swing continuation strategies in trending environments.
This pattern has been building over several weeks, showing market accumulation and strong bullish compression. With today's fundamentals aligning with the technical structure, AUDUSD looks ready to launch into a higher bullish leg. Keep eyes on the breakout candle and volume confirmation as we may be entering a powerful momentum phase toward the 0.67 handle.

Did Gold Just Sweep the Low for a Reversal?After a clean sweep of the Previous Day’s Low (PDL) on XAUUSD, price reacted sharply, grabbing liquidity and signaling a possible shift in order flow. This forms the first pillar of my CRT model (Candle Range Theory) : Sweep, Break, Retest .
Following the sweep, we observed a strong Break of Structure (BOS) , indicating bullish intent. We will then wait for price to retrace back to a FVG at a discount, and then execute the trade.
The stop loss was logically placed just beneath the PDL sweep and FVG zone, protecting against deeper liquidity hunts. Take profit targets the next high where resting buy-side liquidity is likely to be engineered.
This setup checks all the boxes:
Sweep of PDL ✅
BOS confirming shift ✅
FVG retest for refined entry ✅
Solid RR and clean narrative ✅
This is a great example of how patience and a structured approach can create high-probability setups.

EURUSD – Upper Boundary Holds Firm, Watch for a PullbackEURUSD remains well-contained within its ascending channel, but price has repeatedly been rejected near the upper boundary around the 1.14790 zone. This highlights that profit-taking pressure near the previous high remains significant.
The current bounce from the lower boundary is unconvincing, as the recent highs are not surpassing the previous ones. While EMA34 and EMA89 are still offering support, if price moves toward 1.14790 but fails to break through, a “minor double top” pattern may emerge—raising the risk of a short-term correction.
A notable scenario would be a rejection at 1.14790, followed by a pullback toward the lower channel boundary around 1.13870. A break below this level could temporarily invalidate the short-term uptrend.
At this stage, buyers should remain patient and only look to re-enter near clear support zones. Avoid chasing entries near major resistance areas.

EURCHF: Pullback From Resistance Confirmed 🇪🇺🇨🇭
EURCHF may pull back from the underlined resistance today.
As a confirmation, I spotted a double top pattern after a test
of a key intraday resistance and a violation of its neckline with
a high momentum bearish candle on Friday.
Goal - 0.93585
❤️Please, support my work with like, thank you!❤️
I am part of Trade Nation's Influencer program and receive a monthly fee for using their TradingView charts in my analysis.

#NIFTY Intraday Support and Resistance Levels - 09/06/2025Nifty is opening with a gap-up above the 25050 level, continuing the recent bullish momentum. The index has broken out of its previous range and is now hovering near a key breakout zone.
If Nifty sustains above 25050–25100, we could see further upside toward 25150, 25200, and 25250+. A clean breakout above 25250 may unlock extended targets at 25350, 25400, and 25450+.
However, if the index fails to hold above 25000 and slips back below 24950, it could lead to a short-term pullback. In that case, expect downside toward 24850, 24800, and 24750.

[INTRADAY] #BANKNIFTY PE & CE Levels(09/06/2025)Bank Nifty is opening with a gap-up near the 56900 level, right into a critical resistance zone. While momentum is strong, the index is now approaching a potential reversal area.
If Bank Nifty sustains above 57050, we could see a continuation of the bullish trend with upside targets at 57250, 57350, and 57450+. A strong breakout above this zone could trigger fresh buying.
However, if the index fails to hold above 56900–57000 and starts to reverse, it may signal short-term exhaustion. In that case, a pullback toward 56750, 56650, and 56550 is possible.
A breakdown below 56450 would suggest weakness, exposing downside targets at 56250, 56150, and 56050.
