XRP/USD – Bearish Shift After Momentum Exhaustion🧠 Summary:
XRP/USD has shown clear signs of exhaustion after sweeping the previous high. Following a breakout from a daily bull flag, price struggled to hold momentum near the key level of 3.4194, forming an ascending channel that eventually broke down. Liquidity zones below current price are now in focus.
🔍 Technical Breakdown:
✅ Daily Bull Flag → Broke out with strength
⚠️ Rejection near Previous High (3.4194) → No follow-through
🔼 Ascending Channel → Formed post-impulse, now broken
📉 Momentum Shift → Structure flipped bearish
💧 Liquidity Zones (LQZ) below price acting as magnets
📌 Key Levels:
🔹 Last High: 3.4194 (Rejection Point)
🔹 Broken LQZ: 3.2868
🔹 Current Support: 3.1689 (LQZ - being tested)
🔹 Target 1: 2.9849 (4HR Liquidity Zone)
🔹 Target 2: 2.7667 (Daily Liquidity Zone)
🧩 Confluences:
Liquidity sweep of prior high
Momentum loss near key resistance
Break of ascending structure
Retesting broken zones with room below
⚠️ Final Thoughts:
This trade is playing out just as we described in the post before this on XRP. We discussed watching how price would react to this area before making any type of "Late Entries". XRP is still a huge and vital part of the Crypto Eco System so long term i am holding my Long position. The areas on the chart are still great areas to buy in at "Dollar Cost Average". This will be one of those positions that though it may be bearish on the lower time frame you need to zoom out and always keep an eye on the weekly and daily chart before making any drastic moves.
Technical Analysis

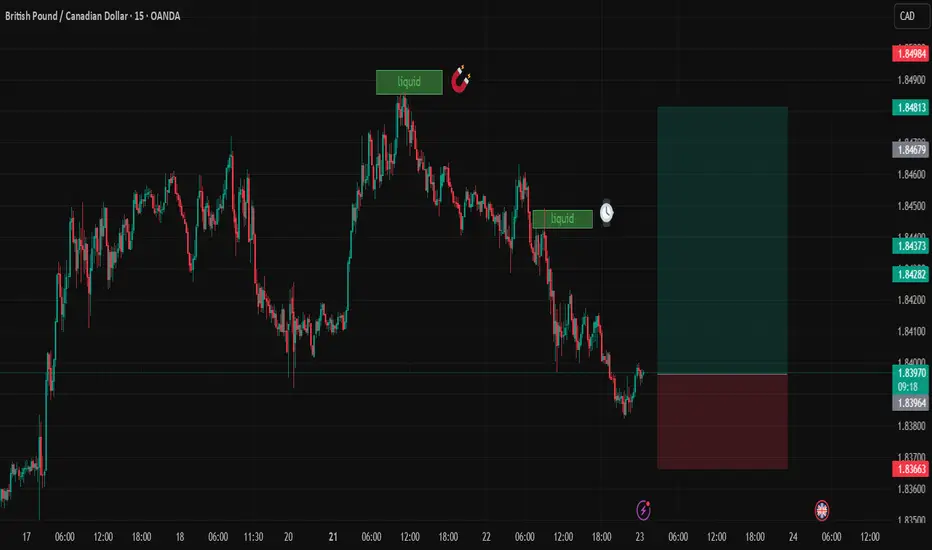
GBPCADDate:
July 23,2025
Session:
Tokyo and London session
Pair:
GBPCAD
Bias:
Long
2 liquidity pools that are waiting to be swept this week. Looks like price is gonna be magnetized towards these levels during London and Tokyo. The trade may even stretch into NYC.
Entry: 1.83970
Stop Loss: 1.83674
Target: 1.84811
RR: 2.82
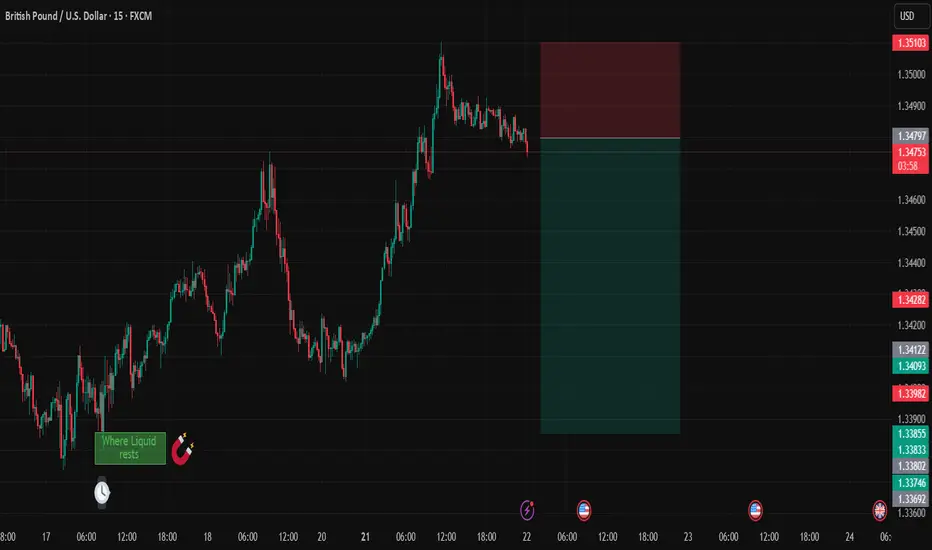
GBPUSDDate:
July 22,2025
Session:
Tokyo and London session
Pair:
GBPUSD
Bias:
Short
Price is setting up to target where liquid rests from last weeks London open on Thursday. Price action shows exhaustion after NYC and London liquidity grab.
Entry:1.34795
Stop Loss:1.35103
Target:1.33853
RR:3.08
Dollar Index (DXY): Strong Bearish Price Action
Dollar Index broke and closed below a support line
of a bullish flag pattern on a daily.
Because the market is trading in a bearish trend,
this violation provides a strong bearish signal.
I expect a bearish movement to 96.75
❤️Please, support my work with like, thank you!❤️

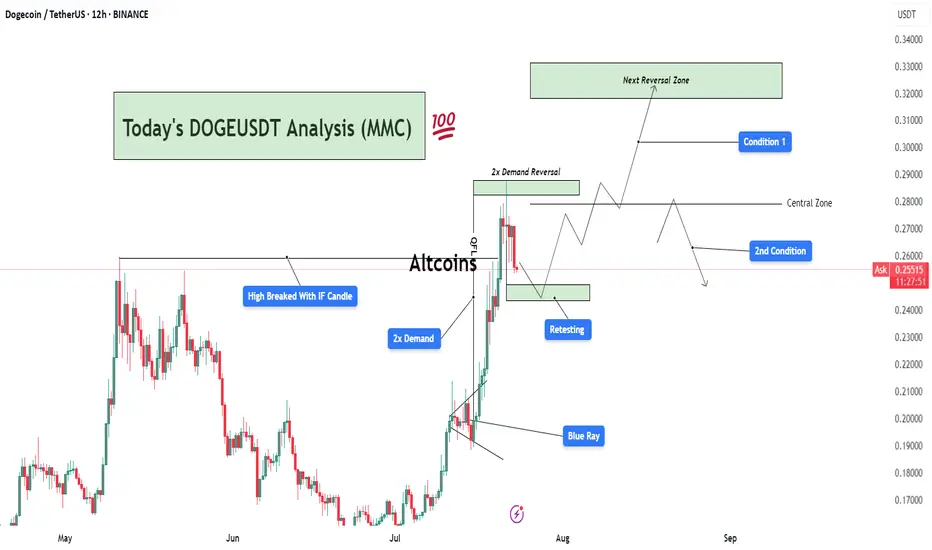
DOGEUSDT Analysis : Demand Zone Retest Before New Highs Target📊 Overview:
Today's DOGEUSDT analysis (12H chart) under the Mirror Market Concept (MMC) framework reveals a potential bullish continuation or corrective phase based on two major conditions. The market structure is transitioning after a strong impulsive move, triggered by a 2x Demand Zone breakout, and is now in the retesting phase.
🔍 Key Technical Breakdown:
High Broken with IF Candle:
A significant previous swing high was broken decisively by an Initiation Flow (IF) candle, indicating institutional activity or aggressive buying pressure.
This confirms a shift in market structure toward a bullish trend.
2x Demand Zone:
This zone has served as a strong base for price accumulation and an impulsive breakout.
The market responded well with a sharp rally post this demand, validating it as a critical support.
Blue Ray Zone (Support Zone):
The bullish breakout was partially driven by this inner trendline zone (referred to as Blue Ray), where price respected the rising support channel before breakout.
This shows smart money liquidity engineering prior to the breakout.
Retesting Zone:
Currently, the price is retracing toward a previously broken demand zone.
If this zone holds, it could provide an optimal entry for continuation.
📈 Two Scenarios (Conditions):
✅ Condition 1: Bullish Breakout to Next Reversal Zone
If the retest holds and price prints bullish confirmation (e.g., engulfing or pin bar), we can expect price to move up toward the next key reversal zone between $0.3100–$0.3300.
This zone is marked as a potential supply/reversal zone, where large sell-offs may occur.
This path follows the continuation structure under MMC, aligning with trend-following buyers.
⚠️ Condition 2: Failure to Hold Demand → Deeper Pullback
If the current demand zone fails to hold and price re-enters below the central zone (~$0.2700), we could expect a deeper correction.
Price may then revisit lower demand regions, potentially toward $0.2200 or lower, depending on rejection strength.
📌 Important Notes:
The central zone acts as a pivot level, defining whether bulls or bears gain short-term control.
Monitor the reaction from retesting area closely — candle confirmation is key before any trade execution.
This chart follows Mirror Market Concepts (MMC), combining smart money behavior, demand/supply reversal logic, and psychological market zones.
💬 Final Thoughts:
DOGEUSDT is currently in a critical phase. The market has shown strength, but now it's about confirmation. Patience is key — wait for a clean break or rejection around the retesting zone to determine the next direction. The analysis favors bullish continuation, but being flexible with both scenarios gives traders an edge.
Gold is Targeting Fresh HighsHey Traders, in today's trading session we are monitoring Gold for a buying opportunity around 3,410 zone, Gold is trading in an uptrend and currently is in a correction phase in which it is approaching the trend at 3,410 support and resistance area.
Trade safe, Joe.

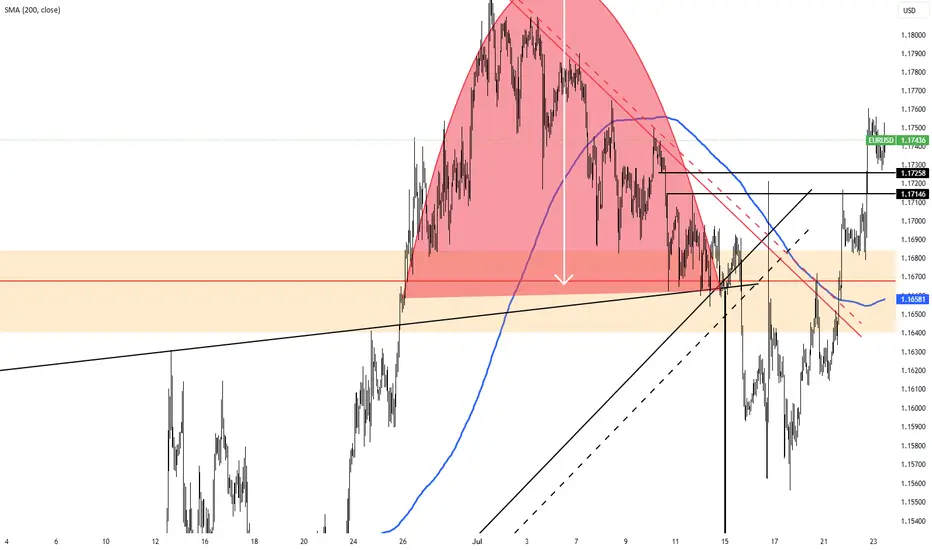
EURGBP Analysis : Curve Breakdown + Directional Setup + Target🧠 Institutional Context & Smart Money Bias
This EURGBP chart offers a masterclass in engineered liquidity and market traps. Institutions have created an illusion of bullish strength through:
A manipulated rounded accumulation curve
A controlled channel phase
A false breakout above the reversal zone
These are textbook signals that the retail crowd is being misled, while smart money is preparing for a deeper move. Let’s dissect it step by step.
📊 Phase-by-Phase Technical Breakdown
🔻 1. Bearish Channel – Sentiment Shaping Phase
From July 11 to July 21, the pair traded within a descending parallel channel, forming a bearish market structure.
This phase was not a genuine trend, but a sentiment builder—to:
Create a belief in continued bearishness
Gather liquidity around the channel boundaries
The upper and lower bounds of the channel were respected precisely, revealing market maker intent.
📈 2. Parabolic Curve Support – Trap Engineered
Price transitioned out of the channel into a rounded bullish curve—a visual cue suggesting accumulation and strength.
This curved trendline often misleads retail traders into thinking a breakout rally is coming.
Price surged aggressively toward the Previous Reversal Zone, further fueling FOMO buys.
But this move was not sustainable. Why?
➡️ Because it lacked a clean base and was built off a manipulated liquidity sweep. The curve was a setup.
🟥 3. Previous Reversal Zone & Major BOS – Institutional Exit Point
Price entered the Previous Reversal Zone, a marked area of prior supply.
This is where institutional orders were likely resting.
After briefly exceeding the previous high, the market instantly reversed with force—evidence of:
Stop hunts
Distribution
Smart money selling into retail breakout buyers
The Major BOS (Break of Structure) confirms the shift: The trend is no longer bullish.
⚠️ 4. Curve Support Breakdown – Structure Shift Triggered
After peaking, the price violated the curve support, confirming the bullish trap.
This breakdown signals a phase transition:
From accumulation illusion → distribution reality
From retail optimism → smart money unloading
🟨 5. Central Zone – Decision Point
Price is now hovering at the Central Zone, a region of equilibrium between buyers and sellers.
This is where market makers may:
Redistribute for another leg down
Fake a pullback before continuing lower
Temporarily rally to trap more longs
This area will determine short-term directional bias. That’s why your setup smartly outlines two conditions from this point.
🔀 Trade Scenarios – MMC Conditions
🔻 Condition 1: Bearish Continuation Toward Next Reversal Zone
If the price rejects the Central Zone and begins forming lower highs and bearish structures:
Expect further downside
This confirms the market is in redistribution mode
Target: Next Reversal Zone at 0.8630–0.8640
💡 Rationale: Institutions are driving price back into demand zones to grab new liquidity or fill leftover buy orders.
🔁 Condition 2: Temporary Recovery & Trap Continuation
If price holds above the Central Zone and breaks short-term highs:
A short-term bullish rally may occur
Likely targets: 0.8675–0.8685
This may act as a fake-out rally, creating more buying interest before a deeper dump
💡 Rationale: Smart money may induce more buyers to create fresh liquidity pockets before dropping toward the next reversal zone.
🔐 Key MMC Zones & Structure Levels
Zone/Level Purpose
0.8695–0.8700 Previous Reversal Zone / Major BOS – Institutional distribution area
0.8660–0.8665 Central Zone – Mid-point equilibrium & battle zone
0.8630–0.8640 Next Reversal Zone – Potential bullish interest area for demand
🧠 Smart Money Summary
This chart showcases a multi-stage smart money plan:
Create channel to shape bias
Form curve to generate false hope
Push into supply and trap late buyers
Break curve support to shift structure
Retest Central Zone to decide next manipulation leg
Deliver price toward true unfilled demand zones
This is how institutions engineer movement while retail gets trapped chasing direction.

GBPUSD Potential UpsidesHey traders, in today's trading session we are monitoring GBPUSD for a buying opportunity around 1.35100 zone, GBPUSD is trading in an uptrend and currently is in a correction phase in which it is approaching the trend at 1.35100 support and resistance area.
Trade safe, Joe.

SILVER (XAGUSD): Confirmed Break of Structure
Silver updated a year's high yesterday, breaking a strong daily resistance.
With a confirmed Break of Structure BoS, we can expect that
the market will rise even more.
The next strong resistance is 40.
It is a round number based psychological level.
It can be the next goal for the buyers.
❤️Please, support my work with like, thank you!❤️
I am part of Trade Nation's Influencer program and receive a monthly fee for using their TradingView charts in my analysis

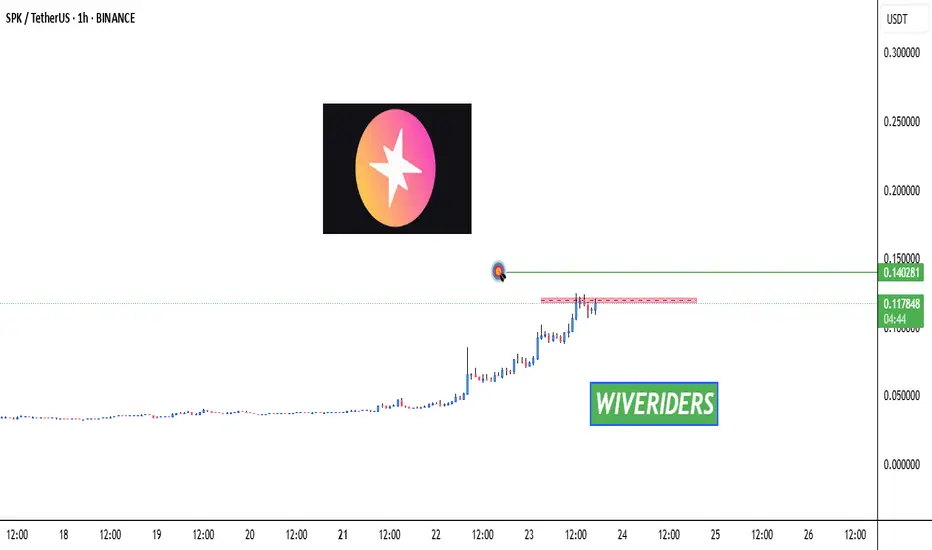
SPK Testing Red Resistance Zone 🚨 INDEX:SPK Testing Red Resistance Zone 🔴📈
INDEX:SPK is now testing the red resistance zone.
📊 Watch for breakout confirmation — if successful:
🎯 First Target → Green line level
This could signal the beginning of a new move up if buyers push through the resistance.
Let’s track it closely for a potential entry! 💼📈
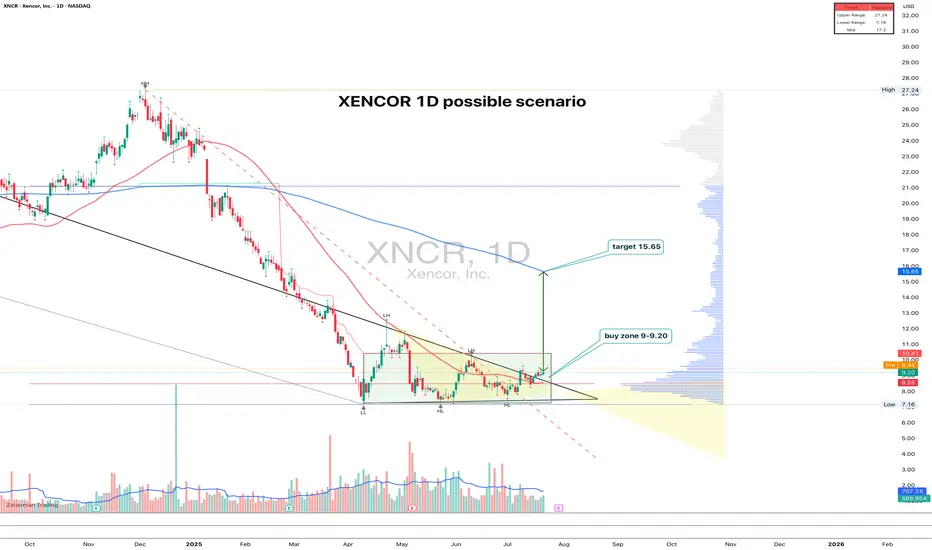
XNCR 1D time to growth?XNCR: the uptrend hasn't started yet - but someone's quietly accumulating
XNCR spent nearly 4 months building a base and finally broke out of consolidation with a clear upward move. The pattern looks like a range with a narrowing triangle at the bottom — the breakout came with rising volume. Entry makes sense in the 9.00–9.20 zone on a retest. Volume profile and Fib levels confirm the importance of this area, plus there’s a clean support shelf at 9.00. The target is 15.65, which aligns with the height of the structure. The 200-day MA is still above price, but a push beyond 11.00 could open the door to acceleration.
Fundamentally, Xencor is a biotech company focused on monoclonal antibodies. After a tough 2023–2024 and cost reductions, the market is beginning to price in signs of recovery. Key partnerships remain intact, the pipeline is alive, and recent data for XmAb7195 was well received at industry events. Valuation remains low, and biotech ETF flows are slowly picking up.
Still a relatively low-volume name, but the structure is clean, the setup is readable, and fundamentals are turning. With a tight stop below 8.50, the risk-reward looks solid.
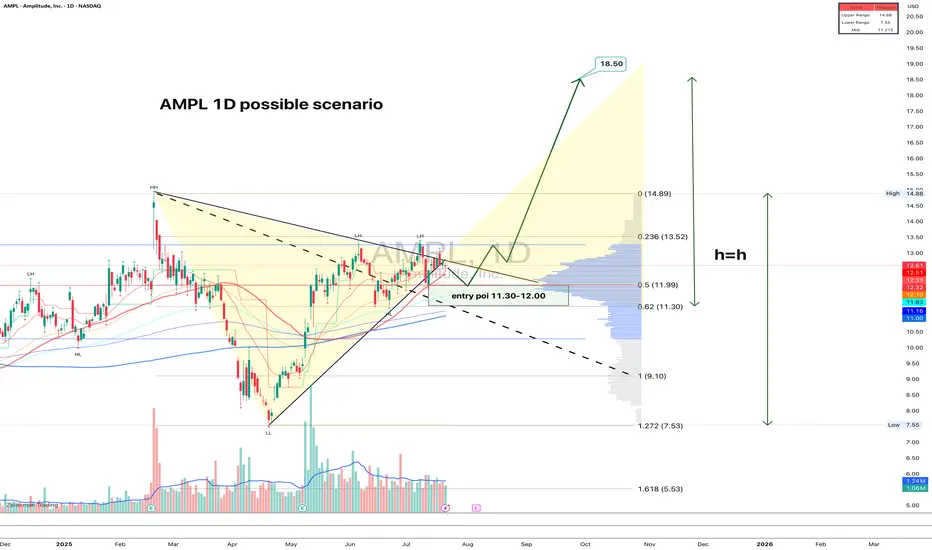
AMPL: structure clean, volume right, fundamentals warming upAMPL just broke out of a symmetrical triangle on the daily chart. The breakout was confirmed with decent volume, and now price is calmly pulling back into the 11.30–12.00 zone — exactly the kind of textbook retest that gets serious traders interested. The 0.618 Fib level sits at 11.30, and 0.5 at 11.99, strengthening this entry area. Volume has tapered off post-breakout, which is typical before a continuation. Moving averages are stacked bullish, confirming the trend shift. First upside target is 13.52, followed by 14.89, and if the full h = h move plays out, price could reach 18.50. A natural stop sits just below 11.00. Clear structure, solid risk control — this is one of those setups that checks all the boxes.
On the fundamental side, Amplitude remains a key player in product analytics and digital optimization. After a slow 2024 marked by cost-cutting and stagnating revenue, the company is showing early signs of recovery this year. The broader SaaS market has stabilized, and AMPL is benefiting from renewed enterprise demand, especially for AI-driven user behavior analytics. Recent earnings came in better than expected, and institutional interest has quietly returned. Valuation is still moderate at these levels, giving it room to re-rate if momentum builds.
A clean breakout with technical alignment and an improving macro picture - when both sides of the story match, it's worth paying attention.
Gold Ends Rally, Focus Shifts to Fed MeetingGold slipped, snapping a three-day rally. The retreat came after the U.S. struck trade agreements with Japan, the Philippines, and Indonesia, easing safe-haven demand. The latest deal with Japan includes 15% tariffs and expanded U.S. access. Still, unresolved tensions with the EU and anticipation ahead of next week’s Fed meeting are keeping investors on edge.
Resistance is at $3,400, while support holds at $3,375.

Pound Hits $1.35 on Weaker DollarThe pound climbed to $1.35, supported by a weaker dollar and cautious positioning ahead of the August 1 U.S. tariff deadline. Investors expect UK economic data to show improving momentum, while the Bank of England may scale back bond sales due to weak demand. Despite the optimism, markets still price in two BoE rate cuts in 2025.
Resistance stands at 1.3550, with support at 1.3380.

Euro Steady at $1.17 as ECB Holds FireThe euro hovered near $1.17 as traders awaited Thursday’s European Central Bank decision. With rates expected to remain steady following eight consecutive cuts, policymakers tread cautiously amid strength in the euro and lingering U.S. tariff uncertainty. Meanwhile, EU officials are preparing contingency plans in case trade negotiations with President Trump collapse before the August 1 deadline.
Resistance for the pair is at 1.1830, while support is at 1.1660.
US-Japan Deal Supports YenThe yen held firm near 146.5 per dollar, its highest level in two weeks, after President Trump announced a trade agreement with Japan featuring 15% tariffs on exports. Japan, in turn, pledged $550 billion in U.S. investments and increased access for American goods. Prime Minister Ishiba’s lack of details and speculation about his possible resignation add further political uncertainty, especially after the coalition’s upper house defeat.
Resistance is at 147.75, with major support at 146.15.
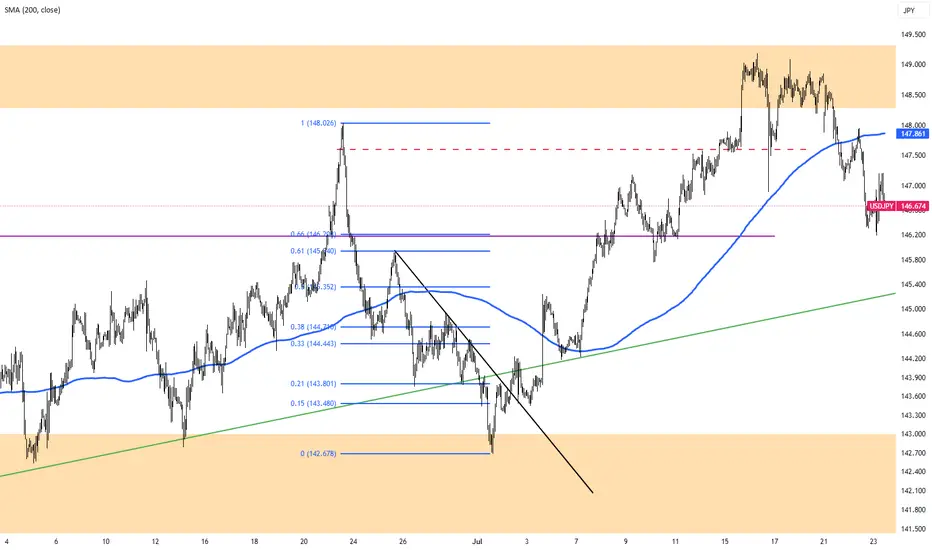
USDJPY 2H Analysis : Trendline Break or Double the Supply?🧠 Market Context:
The market has recently undergone a liquidity grab followed by a temporary bullish reaction, indicating that large players (institutions or market makers) are manipulating price around sensitive zones before committing to a direction.
🧱 Key Technical Zones & Observations:
🟩 1. Liquidity Filled Zone (Smart Money Move)
Location: Around July 17.
Explanation: Price dropped impulsively into a pre-marked liquidity pocket. This filled buy-side liquidity resting below previous lows.
Implication: Smart money has now captured trapped breakout sellers. Expectation of reversal or bullish mitigation.
🟧 2. Central Zone (Supply/Distribution Area)
This zone was tested multiple times, signaling it as a supply-rich region.
Acted as a base for previous strong bearish move.
If the trendline is broken, price may retest this Central Zone, potentially acting as resistance again.
🟩 3. QFL Formation (Quantity Following Line)
Nature: Base breakout with a fast snap-back indicates institutional demand.
The structure signals a failed breakdown or liquidation trap.
Actionable Insight: Strong bounce potential here, ideal for sniper long entries if market structure shifts bullish.
🟦 4. Trendline (Critical Validation Tool)
The descending trendline from July 18 has acted as dynamic resistance.
Multiple rejections validate its significance.
Main Conditional Setup hinges on this trendline:
Break = Bullish structure shift
No break = Trend continuation (retest of demand or breakdown)
🔁 5. Previous Reversal Completed
Price action has printed a reversal model (possibly Wyckoff-style accumulation or spring).
Completion of the pattern aligns with upcoming directional decision.
✅ Conditional Trade Scenarios:
🔺 Condition 1: Bullish Breakout Above Trendline
Setup: Price breaks and closes above the trendline with volume and momentum.
Action: Buy on retest of broken trendline or confirmation candle.
Targets:
Short-term: 147.50
Major: 148.00 – strong resistance/supply zone
Validation: Structure shift + momentum + rejection of prior supply.
🔻 Condition 2: Rejection from Trendline (Trendline Holds)
Setup: Price respects the trendline and fails to break.
Action: Short on bearish engulfing/rejection.
Plan: "Double the supply zone" as per your label.
Targets: 146.20 → 146.00 zone
This respects the previous price memory and liquidity void.
🧠 Deeper MMC Insight:
The market is in indecision phase, balancing between continuation and reversal.
Institutional footprints (QFL + liquidity fills + trendline rejections) suggest preparation for a trap-spring-accumulate or distribution-breakdown move.
Watch for fakeouts around the trendline – MMC logic says market makers often induce both directions before committing.
🧭 Trade Management Tips:
If long: Protect below the QFL base.
If short: Watch for manipulation around the Central Zone.
Wait for confirmation: Don’t pre-enter before structure validates direction.

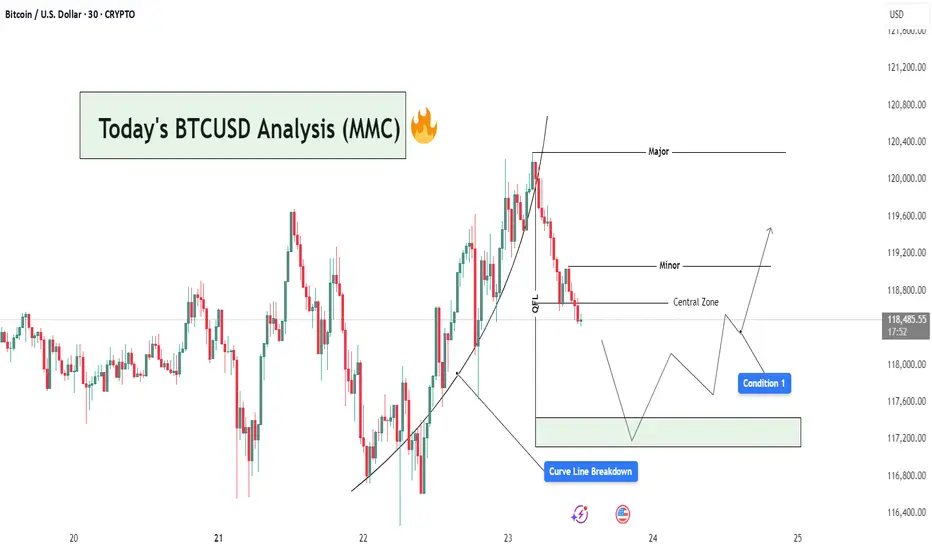
BTCUSD Analysis : Curve Line Breaked and Move Towards Target📊 Market Overview:
BTCUSD has recently completed a strong bullish leg, following a parabolic curve formation that led price into a Major Resistance Zone near the $120,400 level. This rally aligns with MMC principles where price forms momentum-driven structures before reaching high-liquidity zones (often ending in exhaustion).
📍 1. Curve Line Support & Breakdown – A Shift in Sentiment
Your chart shows a clear Curve Line that supported the bullish impulse. Price respected this dynamic support throughout the uptrend until a Curve Line Breakdown occurred—marking the first sign of bullish weakness.
In MMC strategy, this curve structure breakdown is critical:
It tells us the accumulation → expansion → exhaustion cycle is ending.
The market is likely entering retracement or distribution phase.
Price often seeks lower equilibrium, typically around the Central Zone.
🧠 2. QFL Zone (Quick Flip Level) – The Hidden Base
Immediately after the curve broke, price moved toward the QFL level, which represents a demand base from earlier structure. This zone acts as a short-term support and often produces a reactive bounce (but not always a reversal).
Watch closely:
If price respects this zone → temporary relief bounce
If it fails → we’ll likely see full test of Central Zone or lower demand levels
🟩 3. Central Zone – The MMC Decision Area
The Central Zone is a key horizontal level on your chart, defined between ~$117,300 and ~$118,200. This zone is marked based on:
Previous structure
Volume clusters
Demand imbalance
Why is this zone important?
It serves as the balance point between buyers and sellers.
A bullish reaction here could re-initiate a move toward Minor Resistance (~$119,200).
A failure to hold could open the door for deeper retracement toward the green demand box (~$117,200 or below).
🔄 4. Two Primary MMC-Based Conditions to Watch:
✅ Condition 1: Bounce from Central Zone
Price reacts from within the Central Zone
Forms bullish structure (double bottom, bullish engulfing, or reversal wick)
Short-term target becomes Minor Resistance (~$119,200)
If volume increases and price breaks above Minor, continuation toward Major is possible
❌ Condition 2: Breakdown & Bearish Continuation
Price fails to hold within Central Zone
Bearish structure forms (e.g. lower highs, breakdown candles)
Clean move expected toward next liquidity pocket at $117,200–$116,800
This would confirm market shifting into bearish control
📌 5. Minor vs Major Levels – Key Zones
Minor Resistance (~$119,200): Short-term target if bounce occurs
Major Resistance (~$120,400): Liquidity sweep zone, strong supply
Green Demand Box (~$117,200): If Central Zone fails, this becomes next bounce zone
📘 Final Thoughts:
This is a classic MMC setup in real-time:
Curve Formed → Broke
OFL + Central Zone → Now being tested
Next move depends on confirmation from buyers or sellers at Central Zone
Don’t trade emotionally — let price action give you confirmation before taking any positions. Watch the Central Zone behavior closely and manage risk based on scenario outcomes.
GOLD Rejected from Reversal Zone – Retest + Bounced & Major High📌 1. Major High & Liquidity Grab
The chart starts by showing a strong impulsive move toward the upside that taps into a Major High zone (highlighted at the top). This is a classic MMC "liquidity grab" where price sweeps the previous high to trigger stop losses and collect orders before reversing. This is a common trap zone where retail traders get caught in FOMO buys.
📌 2. Reversal Area Identified
The price entered a clearly marked Reversal Area between $3,430 – $3,445. This zone acted as:
Historical supply area
Psychological resistance
Liquidity hunt zone
Upon entry, strong rejection candles formed, signaling institutional sell pressure. This reaction aligns with MMC principles where reversal is expected post-liquidity collection from major highs.
📌 3. Parabolic Curve Formation – Bullish Impulse
A beautifully formed parabolic curve (Black Mind Curve) supported the bullish rally from around $3,310 up toward the high. This shows accumulation → breakout → expansion. However, the curve has now been broken, suggesting that bullish momentum is weakening.
⚠️ This break of curve support is critical — it often leads to a corrective phase or a deeper retracement.
📌 4. Mini Reversal Zone + SR Interchange Zone
Price has now pulled back to a very important area: the Mini Reversal Zone + SR Flip Zone around $3,400. This zone previously acted as resistance and now has the potential to act as support (classic SR interchange).
According to MMC concepts:
If this zone holds → we may see a bullish bounce and potential re-test of the upper reversal area.
If this zone breaks → bears will likely push price toward the next demand level around $3,350 – $3,340.
This is the decision point — a “battlefield” zone where market direction can be decided.
📌 5. Potential Scenarios Ahead:
✅ Bullish Scenario:
Price respects the SR zone ($3,400)
Forms bullish engulfing / continuation pattern
Likely target: re-test of reversal zone ($3,430–$3,445)
Beyond that: breakout possible if volume supports it
❌ Bearish Scenario:
Price breaks below $3,395 with strong bearish candles
Could confirm the rejection from the major high and trigger a full retracement
Downside targets: $3,360 → $3,340 range
🔑 Final Thoughts:
This GOLD setup is a perfect case of MMC theory in action — liquidity grab at the top, rejection at reversal zone, curve break, and now testing critical SR flip area.
Keep an eye on:
Candlestick behavior at the SR zone
Volume confirmation
Momentum indicators (if using)
Wait for confirmation before jumping in — let the market reveal its hand at the decision zone.

RF 1D: Breakout or Just a Bullish Pause?Regions Financial (ticker: RF) finally escaped the descending channel it had been stuck in for nearly 8 months — like someone who missed their stop and woke up in a different state. The breakout came with volume and a hold above the 50-day MA, which technically gives the bulls a reason to stretch their legs — cautiously.
The price has already cleared the 0.618 Fibonacci level (~21.66), and is now pushing toward the 0.5 zone (~22.87). If momentum holds, the next key area is target 1 around 24.00–24.50. Beyond that — and this is where things get ambitious — we have target 2 in the 27.50–28.50 range, which aligns with pre-breakdown resistance from late 2024.
RSI is climbing into overbought territory but still confirms the breakout rather than warning of a top — at least for now.
On the macro side: U.S. regional banks have had a rough ride in early 2025, but RF has held up better than many peers. The recent earnings beat and visible uptick in volume suggest growing institutional interest. If bond yields keep cooling and risk appetite returns to the value sector, RF could remain in favor.
That said, bulls need to see a confirmed hold above 22.80. Otherwise, this could end up as another failed retest — and bears are always lurking just outside the channel.

GRAB 1W: Two Years of Silence — One Loud BreakoutGRAB 1W: When stocks go quiet for two years just to slap bears across both cheeks
The weekly chart of GRAB shows a textbook long-term accumulation. After spending nearly two years in a range between $2.88 and $4.64, the price is finally compressing into a symmetrical triangle. We’ve already seen a breakout of the descending trendline, a bullish retest, and the golden cross between MA50 and MA200. Volume is rising, and the visible profile shows clear demand with little resistance overhead.
The $4.31–$4.64 zone is key. Holding this level opens the path to $5.73 (1.0 Fibo), $6.51 (1.272), and $7.50 (1.618). The structure is clean, momentum is building, and this accumulation doesn’t smell like retail — it smells institutional.
Fundamentally, GRAB is a leading Southeast Asian tech platform combining ride-hailing, delivery, fintech, and financial services. Yes, it’s still unprofitable (–$485M net loss in 2024), but revenue is growing fast, recently crossing $2.3B. Adjusted EBITDA has been improving steadily, and the company holds $5.5B in cash equivalents with minimal debt — giving it excellent liquidity and expansion flexibility.
Valued at ~$18B, GRAB operates in the world’s fastest-growing digital market, with increasing institutional exposure from players like SoftBank and BlackRock. The 2-year base hints at smart money preparing for the next big move.
Tactical plan:
— Entry: by market
— Targets: $5.73 → $6.51 → $7.50
— Stop: below $4.00 or trendline
If a stock sleeps for 2 years and forms a golden cross — it’s not snoring, it’s preparing for liftoff. The only thing left? Don’t blink when it moves.

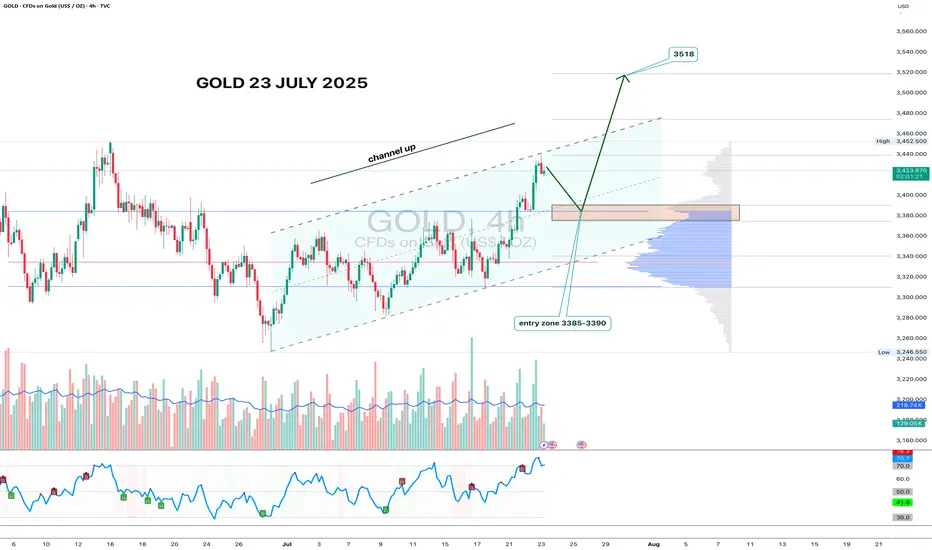
Gold 4H - channel breakout, looking for 3518 nextGold has formed a clean ascending channel on the 4H chart, broke out above resistance, and is now pulling back into the 3385–3390 zone. This area aligns with volume clusters - a perfect entry zone for bulls waiting on the sidelines.
If price holds this zone and prints a reversal candle with volume, the upside target remains at 3518 - the 1.618 Fibonacci extension and historical resistance. Volume increased during the breakout move, confirming interest. RSI still has room to go higher, supporting the bullish continuation.
Fundamentally, gold remains a safe-haven asset amid geopolitical tension, USD weakness, and potential Fed easing. Central bank accumulation further supports the bullish case.
Tactical setup:
— Entry zone: 3385–3390
— Trigger: candle confirmation + volume
— Target: 3518
— Invalidation: break below 3360 without buyer volume
If the plan plays out — gold might shine bright while bears squint in disbelief.
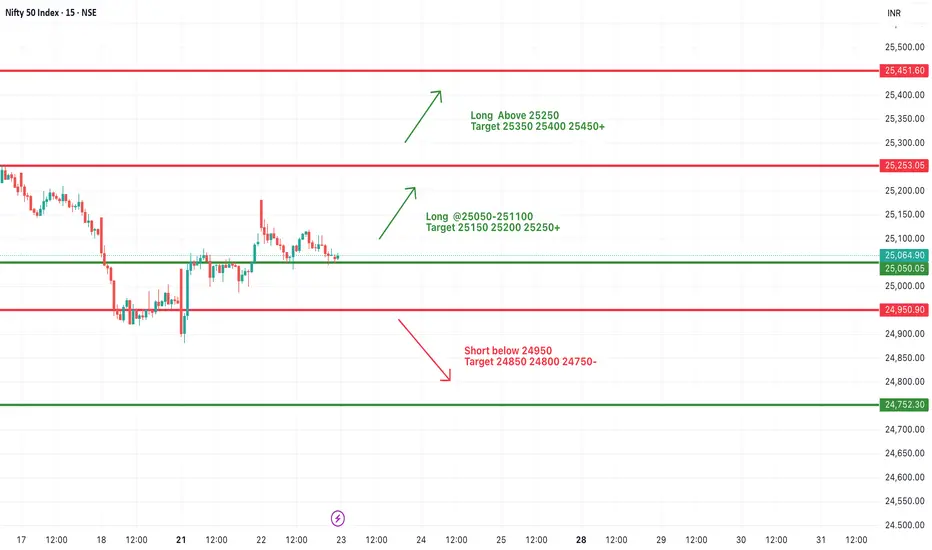
#NIFTY Intraday Support and Resistance Levels - 23/07/2025Nifty is expected to open with a gap-up today, continuing its sideways movement within a tight range. There are no significant changes in key levels from the previous session, indicating a consolidative phase in the market. Price action near these levels will be crucial for intraday direction.
On the upside, a bullish continuation can be expected if Nifty sustains above 25,050–25,100. This zone has been acting as a breakout point, and a sustained move above can lead to an intraday rally toward 25,150, 25,200, and 25,250+. Further strength will be confirmed if Nifty crosses 25,250, opening the possibility to test 25,350, 25,400, and even 25,450+ levels.
On the downside, if Nifty breaks below 24,950, it may trigger a short setup with potential downside targets of 24,850, 24,800, and 24,750-. This breakdown would indicate weakness, especially if it comes with volume.