Cardano dominance it's bullish for this key altseason!!!Ok guys, I jus want to share you this short analysis for you. I see the Cardano Dominance that it's extremely bullish by long term. If you want to accumulate Cardano, the time it's now to continue accumulating Cardano in the best price. For that, this it's an opporutnity for us. Why I explain that? Becuase or the fundamental keys that it's envolving in this cryptocurrency. Remember, if you don't know Cardano, you can to get it to link to related idea to read about Cardano, many cryptocurrencies and others special analysis.
*** In this point, it's very important, I'm extremely bullish more in Cardano than others crytpocurrency, for that, Cardano have all fundamentalks to be distinguided in this bull rally & altseason on 2021. For that, this it's my cryptocurrency that I'd reccomend a lot to invest, and remember, I'm deciding to sell all my cryptocurrency for Cardano. Cardano it's my best cryptocurrecy that I like it. Once of my goal it's to reach the 20,000 Cardano coins as I have in hold 11,234 Cardano. Just selling Ethereum, XRP, Chainlink, Litecoin, Bitcoin, EOS and Tezos for Cardano. And then, make trading to earn profit and use it to invest in Cardano little to little until reach my 30,000 Cardano coins. And one of the stragety that I use as I sell part of my Etheruem to buy 10,000 Dogecoins coins, becuase in Simple FX broker, they offer to deposit Dogecoin to accumulate in this cryptocurrency making trading. And then, I know that Dogecoin it's growing up fast than others cryptocurrency, so accumulating DOGE at least like 40,000 Dogecoin and depending the convertion between Cardano & Dogecoin ratio, I can to sell my Dogecoin for Cardano to get more Cardano. But if you want, we can to talk about this strategy to accumulate Cardano making trading in Simple FX with Dogecoin or any crypto.
But guys, that it's all, just I want to share you my perspective how I see the Cardano dominance in the future. And I believe that Cardano it's going to growing up throughout of the time until take a good percentage in the altcoins dominance concentrated by Cardano. For that, investing in Cardano. this cryptoucrrency could to change the world and I interesting to work with Cardano team to develop more research in Cardano and discover this cryptocurrency deeply and the team as my experience. I believe that If I d, I can to becoming part of Cardano team to develop more technology and support Cardano for the future.
Technicalanalysisexplained

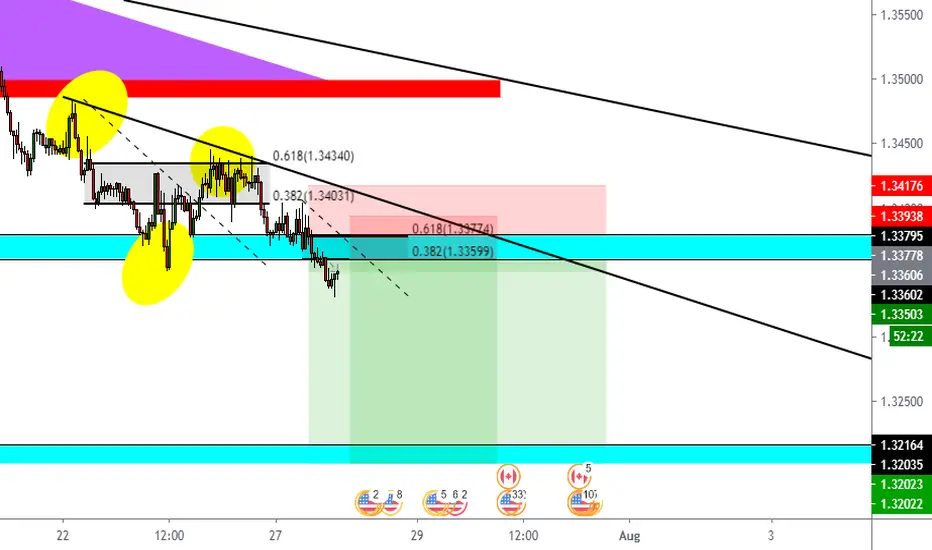
USD/JPY - TRADE IDEA - Bullish Probability by PEDRO FXWaiting for price to pull back to 0.5 / 0.618. Wait for support to form/rejections. Then enter on bullish candle pattern. Wait for bullish candle close to enter.

Bitcoin it's leading to my target $19,500 USD!!!In this update, I see that Bitcoin starting growing up in the past hours. So, first I reccomend to protect your long position putting a break even at $18,170 USD. Guys, in this posiiton we can to get earning if BItocin make a reversal, but I see that we can't to loss because the price entry was $18,050 USD. And I'm in profit.
Now, the part that I intersting it's to talk about the Daily chart, becuase we are into this ascendent triangle, but we see this purple zone that could be a manipulations zones arounf of $19,700 USD and $19,900 USD. So, we would need to stil alert in this zone that I draw in the wick and I show you in this red arrow.
So, I believe that the Daily chart it's so important to know the trend, also the 3 Daily chart it's more important to understand the market if you are like me that you like to trade intraday trader to still the position for days and earn in medium term.
So guys, protect your position in Bitcoin, we're in profit and congraluations for you if you take this analysis!!!
Now, very important it's my perspective in the $19,000 USD all zones above of it and below of $19,900 USD. That all zones of $19k levels it's psycological point.

My prediction for Bitcoin in 2021!!! The unique chart keyIn this tutorial, just I draw this chart for long term and I want to share you and review:
1. Bitcoin it's still into this re-accumulation zone, that it's very important to know~!!!
2. Bitcoin still bullish and right now, we are in the highly maximum price and then, we would need to check out this chart
3. And remember, I use this model for you to understand what cycle we are!!!
All information it's here writing in this chart to identify each cycle meanwhile colors, arrow, and more.

XRP it's bullish toward the $0.67 cents!!!; bullish break up!!!In this technical analysis, XRP it's bullish toward the $0.67 cents as my next target to reach up.
t.co
Now, looking in H4 the trend it's become more bullish and we was into this correction of ABCD armonic pattern!!! And also, we see a bullish butterfly in H1 timeframe. It's so interesting to look it.
Now, I'm still bullish in XRP from $0.59 cents toward the $0.67 cents. The SL it's around of $0.56 cents!!!
Good luck in this long position!!!


XRP show a shoulder head shoulder!!! Short Position!!!In this technical analysis, XRP show a bearish movement toward the $0.48 cents again. So, that it's so interesting to trade XRP.
Now, I believe that XRP it's forming a possible re-accumulation to then make a parabolic bullish!!! So, that it's so interesting to study XRP as one of my cryptocurrency into my radar to invest in 2021.
So guys, this is it. So, I put a sell order limit at $0.6130 cents with a SL at $0.6598 cents and my target will be $0.5050 cents.
Now in the next days, I will going to update this par in the next days to week to study the elliot wave analysis and add more data content!!!
Happy days!!!

For that Reason I want to accumulate Ethereum assets!!!In weekly, I see that Ethereum it's prepared for the next massive bull run movement agains to Bitcoin. This is the par Ethereum/Bitcoin or ETH/BTC. So, for that reason I want to change my mindset to accumulate Ethereum.
This is a good reason why accumulate 10 ETH to get 1 BTC in the next bull run when ETH goes to up a cost of 0.1 BTC. And not it's all, maybe accumulating over 10 ETH I thinking that Ethereum could be a queen of the cryptocurrency after of Bitcoin.
So, imagine it to accumulate 10 ETH to hold and then, you can to sell Ethereum when Ethereum achived the value of 0.1 BTC.
So, and exquisite strategy it's okay to accumulate a lot Ethereum. I use the reference on what Carl, The Moon You Tube Channel it's accumulate a lot Ethereum to sell for BTC value when Ethereum starting up!!!
So, I want to enfocous more to trade cryptocurrency and find up 30% each weekly, just to accumulate Ethereum assets making trading in cryptocurrency. I'm staring buying 1 ETH to accumulate it in my Quantfury App
My Own Strategy:
First Month: Starting with 1 ETH and find up 30% weekly
1. Weekly #1: 1 ETH = 30% = 1.30 ETH
2. Weekly #2: 1.30 ETH = 30% = 1.69 ETH
3. Weekly #3: 1.69 ETH = 30% = 2.19 ETH
4. Weekly #4: 2.19 ETH = 30% = 2.85 ETH
You get 2.85 ETH in your first month!!!
Second Month: Starting with 2.85 ETH and find up 30% weekly
1. Weekly #1: 2.85 ETH = 30% = 3.71 ETH
2. Weekly #2: 3.71 ETH = 30% = 4.82 ETH
3. Weekly #3: 4.82 ETH = 30% = 6.27 ETH
4. Weekly #4: 6.27 ETH = 30% = 8.15 ETH
You get 8.15 ETH in your second month!!!
Third Month: Starting with 8.15 ETH and find up 30% weekly
1. Weekly #1: 8.15 ETH = 30% = 10.60 ETH
***And then, it's all you get 10 ETH as minimum using this strategy. But as surprise, if you want to accumulate over 10 ETH you can make it without any problem in your trading app using Ethereum as deposit method. An example of trading app it's Quantfury that you can to fund Bitcoin, Ethereum, Dash, Litecoin as deposit method.
I will continue update this par later if you want to accumulate over 10 ETH, imagine accumulate 20, 30, 50 or 100 ETH using a strategy to find up 30% weekly. But, a minimum it's have 10 ETH if you want to get 1 BTC when ETH have a cost of 0.1 BTC for each ETH that you hold and this it's a excellent bussiness. And then, with your own 1 BTC you can to accumulate more satothis later. That strategy it's a form that I learn throughout of my experience.

Ethereum is into this bullish flag!!!In this analysis, Ethereum is weakness and the trend is leading ot the bearish towards the $354 USD.
Ethereum has the same situation of what Bitcoinn do!!!
But here is more interesting in H4 or you can see in H1 timerame. But, H4 is my key to keep my trades in long. So, Ethereum is forming this bullish flag ABCDE that the bear are take the control o the trend to be the price it's going down. So, I put my sell order limit at $412 USD with a SL at $422 USD and my target profit will be $394 USD. Also, as reference the RSI show a weakness and I mark that in this yellow circle that I show it.
Guys, i you like my technical analysis, please comment, give a like and I hope that this idea it's support for you!!!

Gold continue toward the $1952 USD; Break Even!!!Looking the Gold trend, we see that this par is up a lot, so in H4 I secure 82 pips from my price entry that was around of $1,900 USD. The break even is $1,908.15 USD, that is my protection of my all earns. Also, as Gold continue in H4 into this bullish channel, also I draw this purple line becuase Gold form it, and then, a blue line that indicate a resistance and now, is support. So, Gold was broke up the blue line and purple line recently, now we hope a little pull back so nearly of this purple line to then, continue toward the $1,952 USD.
The most curious in in Daily, we see that Gold is trying to broke up this bearish channel, and then, it's into this bullish channel, that is a good indication that Gold is bullish as bulls still bought more!!!
Congraluations guys if you follow this analysis on Gold, now you can to use a break even, also, if you see my recently publication of the Forex par: Euro/Canadian Dollar, there's another good posiiton for long if you want to look!!!

Long Position: Euro/Canadian Dollar is leading by demand!!!In this technical analysis. I want to make a explain why Euro/Canadian Dollar is goes to up!!!
So guys, as today we see a good short positon in EUR/AUD, so I ignore my short positon for believe more in H1, so as learningedge, I learn that the H4 timeframe, each group candlestick is a key to look what the trend make, specially in Daily when is talking o pull back or reverse of the trend. That is my habilities that I have, but working little more for me.
Now, lookin in H1 we see that Euro/Canadian Dollar is leading by demand or bulls. There's not any short positon signal for this par, just that Euro/Canadian Dollar is into this supply and demand strategy.
We see in H4 timeframe that the trend is beocme bullish, and RSI is above of 50, that turn what EUR/CAD is strenghten and the trend is a key to follow bought.
Now, in Daily the trend is the most important, becuase we see that EUR/CAD can to continue up more toward this yellos supply zone. And maybe in the red zone, that is weekly zone, but also if you notice that EUR/CAD could formed a possible armonic pattern bearish, but in each case, is the trend change, we could see it.
Good luck of this long position.

Long Position: Tripple bottom on Euro/Sterling PoundEuro/Sterling Pound is be prepared for the next movement toward the 0.92 Pound. That is great opportunity to put in long position in Euro to find up 220 pips. Also, looking in H4 timeframe, the we formed a tripple bottom and that suggested a possible massive movement bullish in this par.
And finally, Euro.Sterling Pound in Daily timeframe it's bullish, but formed a bullis hrising wedge as we see in H4t timeframe a formation of tripple bottom. And remember, the trend is the direction in what the assets it's leading it.
Fundamental Keys:
1.Pound to Euro Exchange Rate edges higher on hopes of last-minutes Brexit deal.
2. Sterling edge higher today despite it or leave it appproach to a post Brexit UK-European Union trade deal.
3. Michael Gove, U.K. Senior Cabinet Minister, commented today the following
IN fact, we hope that Eurozon will change their problem and position.
4. Sterling investor remain confident that the UK and European Union could strike a deal last minute
5. Angela Merkel, German Chancellor saw that all agree that Europe needed to show a degree of compromise in order to secure a Brexit deal.
6. Mr. Sin Jon Cunlife, the Deputy Governor for Financial Stability at the Bank of England commented the following:
Any dovishness about the British economy in the months ahead would prove a Sterling-negative.
7. The Euro sinks as safe-haven demand slides an improving Chinese Economy.
8. The Euro suffered today following news that China has been the first big economy to rebound from the covid-19
9. In Eurozone economic data, today will see the bloc's latest construction output the pandemic. But, if the Eurozone economic data, today willl see the bloc's latest construction output data for August. So, any improvement in Europe/s nation construction sector would prove an Euro-positive
So, the fact that we see a higher on what UK government make, that not a good position that Sterling Pound goes to up, but we would needto take in noticed in the Brexit could be a limited capacity, that mean that Euro could to prove more positive than Pound.
I put my buy order limit at 0.9043 with 54 of SL and my own target will be 220 pips.

Bitcoin into the accumulation zone for boughts!!! Hello everyone, in this updated analysis, Bitcoin formed a simetric triangle in H4 timeframe. So, I hope a buy at $11,300 USD approximately when Bitcoin going to make a little drop, becuase we're in the accumulation phase and that show that Bitcoin is prepare for the next massive bullish movement.
So, that is in H4 timeframe that we see an accumulation phase. And that is a good opportunity
And now, lookin in Daily timeframe, we see that the price suggested that bulls are take the control and in short-term we should need to see the $12,300 USD in the next days. And also the only learining is to hope when Bitcoin it's have a signal of make a consolidation, because when that pass that, we will need to keep out or closed up our position in each assets don't matter wheter it's BTC, ETH, EUR, USD or other assets as commodities, Forex or cryptocurrency. For that, we would need to hope that this consolidation formed any chartist pattern signal!!!
In the case of bears scenario, I don't believe in it to put any short!!! Because we're in the accumulation phase
Guys, if you like this idea as another cryptocurrency ideas as Litecoin or Ethereum, please give me a like, your like it's support me to be in the top cryptocurrency trader and to become one of the distinguished traders on this revolutionary technology!!!

Overview: Bitcoin formed a simetric triangle!!!In Daily timerame. we believe that Bitcoin is into the phase of-re-accumulation. That is a good singal that bullish is prepare for the massive bought of Bitcoin between the November and December we could to reach the $14,000 USD
Also, I want to share the weekly timeframe to look out. We are in the clearly re-accumulation zone!!!
What is mean that?
1. That mean that Bitcoin doesn't going to down below of $10,000 USD.
2. That re-accumulation zone it's another good opportunity to buy more Bitcoin!!!
3. It's the latest once that Bitcoin is doesn't going to the below of $10,000 USD. The most opportunity is to make trading or accumulate Bitcoin!!! So, that is the ultimate opportunity because the bulls are option to buy Bitcoin for medium and long term
But, waoh, we see that in weekly timefrmae Bitcoin is into this re-accumulation zone and then, we see that Bitcoin could to have an objective to reach up the $16,000 USD in medium term.

Euro/ Canadian Dollar is turn in bear singal!!!In H4 timeframe, we see a lot chartist in formation, but the most chartist in the bearish rising wedge. Also, we have formed a bullish channel or simetric triangle too both, Now, in Daily is the key:
3 days ago, EUR/CAD show a bearish, and yesterday the green candlestick grew by 50% of the big red candlestick, and then, we could see another short opportunity to find down 247 pips. Because we see a Shoulder Head Shoulder bearish pattern and we could see for the eyes this opportunity to take in notice it.
Now, in H4 timeframe we see a nice shoulde head shoulder. Also as theory, let's me explain these 6 blue arrow. These blue arrow are forming a strog resistance and we could see in H4 timeframe a drop!!!
So, I'm still alert on this par because for the next week, we see a possible nice opportunity in Forex!!!
If you like this, give me a like and share it with your friends or traders.
Not put any short or long position in this par until this par leave in this strong resistance at $1.5656 CAD, it's my psycological point to take my decision, my own decision is short becuase we see a strong resistance, I reccomend for you to put an alart approximately at $1.5638 CAD, and then, when the price leave at this price, I am still pending of possible short position at $1.5656, this is an alert to know it!!!.

Weekly's Overview: Do Bitcoin could make a sell off to the 9K?In this special analsyis, we see in weekly that Bitcoin could make that bears take the control of the trend to leave down the price until the $9,000 USD making this part a retest of this grant accumulation of simetric triangle showing in weekly.
So, in Daily we see that Bitcoin is bearish, now, as yet we're not broke down the key support line, is important that Bitcoin is sitll above of $10,000 USD, but in cases that Bitcoin make a broke up, we could see a drop until the $9,000 USD and bears take the control, and now, if in case that bears make a sell-off exagerated below of $9,000 USD and make a chances of the bear trend, we may need a new technical analsyis.
But, my important point that Bitcoin stil the bull trend is the $9,000 USD, that key is the psycology point and we cannot to loss this level.
Well, if you like this idea, please share this special analysis with your friends and traders, I will go back to make a technical analsyis in short term.

US dollar continue with their dropHello guys, in this technical analysis we see a several correction of this par.
In Daily we are in this situation of the market and the possible continue of this drop
In the past, we found out a shoulder head shoulder, that signal is so bearish!!!
The objective is to find down 175 pips. Also, following the trend in H1 you have a opportunity to entry in short in the 0.382% of Fibonacci, now I change my strategy because using trend-lines is more effective that using indicator to make a technical analysis so simple. If you're a beginner in that, know that we are in bearish trend, so, that case, we continue sell off. Also, if you noticed it, this yellow circle show the lower lower and higher lower that in that case the trend is so bearish, until we know that the bearish trend is stopped making a lower equal the previously lower, that is a possible change of the trend!!!
Also guys, in the other pars taht I follow, I will going for tomorrow to make a clear updated as you see in this.
As I have activated my sell, I am in profit near of 30 pips, I do not reccomend to closed up, because if you closed up, the price it's going to back to drop more, that my friend is just that the price need to make a pull back in the 0.382% of Fibonacci to later drop, there are a possible opportunity to entry in short in the 0.382% of Fibonacci.
EURUSD WEEKLY ANALYSIS! (POTENTIAL SHORT SETUP)Good day traders, welcome to another weekly analysis by ChinSengFx and I hope you all are having a great week ahead.
Let's talk about EURUSD, as you all know, European Union efforts to agree on stimulus package has been a challenging effort for all EU leaders. Therefore, the strength of EUR will be directly impacted.
Based on technical perspective, EURUSD has reached the previous high on March 2020. A push to the downside (favorable to 1.13353) is most likely. We will be looking at bearish reversal candlestick to form before going into the trade.
Entry Price: 1.14481
SL: 1.1503
TP: 1.13353
Risk:Reward Ratio: 1:2.11
Always enter a trade with clear direction and manage your risk per trade well. It's always you versus yourself in the market.
Happy trading!

GBP/USD: Fundamental and Analysis: More bullish yet!!!Hello, in this technical analysis the conduct of Sterling is so bullish for mid-term as short-term.
Studying the fundamentals, there are a nice favorable of this currency while the bad fundamentals for US Dollar. So, in Daily we are into the making a pull back and then I proyect that easily Sterling it''s can to reach at the mark of $1.28 USD, and why not to above of $1.30 USD. So, guys in mid-term we see a Sterling so bullish about the speculation of Brexit and UK is prepare about this speculation.
Now, in H4 timeframe we continue up and this morning I entry in the $1.2538 for long position until the $1.28 USD to find up 264 pips in some days.
So, Sterling Pound is so bullish so so but so bullish for mid-term about and based in my fundamentals that I write on my notebook.
So, the fundamentals to take in noticed is down here:
1. Fortnight lows for EUR to Pound Exhange Rate ahead of UK summer statement
2. EUR to Pound exchange rate steadies lower ahead of UK Chancellor's Statements
3. There are a fears of a second round of coronavirus infections continue to rise, and this is weighing on the EUR to Pound Sterling exchange rate.
4. But still, EUR outlook remains stronger than the pound outlook so these losses may prove temporary
5. Otherpoint is that EUR exchange ate steadying lower as market await European Union fund developments
6. Concerns that the coronavirus recovery won't be as much of a rebound as previously hoped have been withing on the EUR over the past week.
7. As signs of a secound wave amid surges of infections in the US and some parts of Australia, investors have been less optimistic about a global recovery.
8. Pound exchange rates edging higher on Brexit Speculation
9. Since last week, fresh speculation that UK-EU relationship about the brexit negotiations is could see productive developments this month have been supporting sterling
10. Pound to US Dollar exchange rate dips as risk sentiment of drops on rising US covid 19 cases more yet.
So, in my conclusion, that fundamentals make a Pound so bullish then another pars:
1. EUR/GBP: Bearish sentiment
2: GBP/USD: Bullish sentiment
3: GBP/JPY: Bullish sentiment
4: GBP/AUD: Bullish sentiment
5: GBP/CAD: Bullish sentiment
So, technically are bullish the GBP all pars, but some important that maybe of these list there are not bullish, but some important is always to make a technical analysis. But in based on fundamentals, GBP is so bullish for mid-term about the bad news that leave of US covid 19, speculation of brexit is prepared to trade the UK and European Union relationship, and othepoint to take in noticed!!!

Confirmation of EUR/GBP: We go to long together!!!Hello guys, in this updated I want to make a following of this par, because I see that this par is was a little consolidate, but the expectative is so bullish for now, because we have other confirmation aditional that MACD and RSI it's form a bullish divergence too as price action in the same time. Also, you can get it this screenshoot
We are now entry in buy at this down side of this bullish channel, and the expectative is so bullish to find up a lot pips and the price it's can be to reach 0.9214, that is my target profit to find up 180 pips for the next week, this is a huge earns.

Special Analysis for Bitcoin: Is Bitcoin prepare for bull run?Hello guys, in this technical analysis I want to talk you about why Bitcoin is so prepare for bull run soon? Now, I selected the Weekly and Daily timeframe.
Now, in weekly we see a Bitcoin bearish for MACD and price action, but there are a lot doubts that respald that a drop what a much traders hope, it's can be fake drop and the price is can to prepare to go to break up the simetric triangle from 2017.
But for this information we need to see in Daily timeframe, that is the key what Bitcoin do.
But in Daily timeframe, we see a reality so different than Weekly, because Bitcoin is now into this bullish rising wedge in formation and find up the Elliot Wave D, to later go to drop for the E to find down, and later we proyect for Bitcoin so bullish scenario reaching at $11,500 USD. That is a possible target to see in few weeks. Also the MACD is show us a possible buy!!! Now, if I asking you about if this scenario it's could be to pass. Are you prepare for there? Now, in that case that this rising wedge fail and broke down, we can see a Bitcoin so bearish until the $7,000 USD again. But, the key is in Daily timeframe how we see the trend key, structure and condition for midterm.

We continue in sellAt the moment, we continue in short and there are not updated. so we continue and we have near of 100 pips in profit. Also, lets me see a any little that we have a possible formation of double bottom, if in the case of the price reach at this green zone, and there show us a bullish candlestick pattern, when the price it's leave at this zone, I believe that it's reccomend to closed there. And also, there are a possibility to produce a big sell off to continue to dinf down the blue zone of monthly zonel
Look:

BUYING SOME CRIPPLE! HERE IS WHY...✅In this video, we talked about the buy location for Ripple.
If you enjoy this kind of content, feel free to show some love.
We will continue our education videos. You will get notified once we do publish the next educational video, if you already follow us on TradingView.
Take it easy.
~Bo Bugra Sukas
