Expect breakout soonSleepy alligator on M chart. I expect upside breakout soon. Should happen this summer.
Technicalindicators

$GME 🚀 It's Moon Time! PT:$11.56 & $14.37Hello everyone,
I know you all have been waiting for a big update. Here is the tea:
First PT coming in at the daily at $11.56. Break above the daily and the next PT is at the weekly $14.37. These two will act as very hard resistance and if both are to break then we will head to the monthly at $21.10, but we will analyze that part when we cross that bridge.
RSI indicates that GME is in the bull zone right now. The MACD is slowly curling up and if the lines cross above the 0 line, then that would indicate a very very bullish signal.
If GME rejects the daily, then price will trend lower and will test the hourly at around $10.62ish.
Anyways, there is room to run here folks! Strap in because this is just the beginning. $9.94 was the low and it won't be returning there anytime soon.
Not financial or sexual advice.

SWING IDEA - TATA COMMThis stock looks good for a swing trade.
Reasons are stated below :
1566 levels acted as a resistance but the price broke that level and now its retesting the same.
Formed a morning star pattern on daily time frame.
0.5 level Fibonacci support.
50EMA support on daily time frame.
target - 1950
stoploss - 1508

Best SUPPORT and RESISTANCE Indicator to Identify Key Levels
In this article, I will show you a simple technical indicator that will help you to identify support and resistance levels easily trading any financial market.
And what I like about this indicator is that it is absolutely free and it is available on all popular trading platforms: tradingview, meta trader 4, meta trader 5, etc.
This indicator is called Zig Zag.
After adding the indicator, the price chart will look like that.
First, I recommend changing its settings.
Price deviation - 1.5
Pivot legs - 5
Here are the inputs that I recommend for structure analysis on a daily time frame.
And in style remove labels because they really distract.
What this technical indicator does, it underlines the significant impulse legs. The completion and initial points of the impulses will be the important structures.
Your key structures will be the areas based on the initial/completion points of impulses based on wicks and candle closes.
A key horizontal support will be based on the initial point of the impulse and the lowest candle close.
Key supports will be all the structures that are below current price levels.
A key horizontal resistance will be based on the initial point of the impulse and the highest candle close.
Key resistances will be all the structures that are above current price levels.
Also, the completion/initial points of the impulses will occasionally compose the vertical structures - the trend lines.
Underline all the supports/resistances based on Zig Zag indicator.
All these structures are significant and can be applied for pullback/breakout trading.
Also, remember that you can modify the inputs of the indicator.
Increase Price deviation and Pivot legs number will show the stronger structures, while decreasing these numbers more structures will appear on the chart.
On the left chart:
Price deviation - 1.5
Pivot legs - 5
On the right chart:
Price deviation - 5
Pivot legs - 10
The right chart shows just 2 structures, but very important ones.
This indicator is very powerful and it can help you a lot in learning structure analysis.
❤️Please, support my work with like, thank you!❤️

🧑🎓 XAU/USD ANALYSE 📈 I UPDATED MORE READ THE CAPTION?By world 🌍 Forex’ Traders Hello 👋 traders
"Gold Market Analysis 💡
4H Time Frame Chart 📊
_Bearish Signal 🚨_
We're seeing a potential short opportunity in the gold market, with a current price of $2378. Our target is $2287, which is a key support level. A breakdown below this level could lead to a significant price drop 💸.
_Analysis 🤔_
The 4H time frame chart shows a bearish trend, with a series of lower highs and lower lows. The Relative Strength Index (RSI) is also indicating a bearish signal, with a reading of . The Moving Averages are aligned, providing additional confirmation for a short position 📈.
_Trade Strategy 💰_
Sell: $2378 (short)
Target: $2287 (next support level)
Stop Loss: $2420 (bearish warning) ⚠️
Note: This analysis is based on a 4H time frame chart and is subject to market changes and fluctuations. Always use proper risk management techniques and consult with a financial advisor if necessary.
Follow me for more market insights and analysis! #goldmarket #forex #tradingview 💼"

🐂 XAU/USD : LONG SIGNAL BULL 🐂 CHANNEL ⤵ more updates (READ THHere's a sample text you can use for your gold analysis update:
_Title:_ Gold Analysis Update: Bullish Target in Sight!
_Summary:_
"Gold is looking bullish! My analysis indicates a target of $2339, with a potential upside to $2379. The recent price action has formed a bullish channel, and the RSI indicator is showing a positive divergence. If the metal can break through the $2339 level, we could see a swift move to $2379. Keep a close eye on this key level for further direction. Let's see if gold can reach for the highs!"
_Additional points to consider:_
- You can mention any relevant news or events that may be impacting gold prices (e.g. interest rate decisions, geopolitical tensions)
- You can highlight any key technical indicators or chart patterns that support your analysis (e.g. moving averages, Bollinger Bands)
- You can provide a brief outlook for the short-term and long-term prospects for gold
Here's an example of how you can present your analysis in a more visually appealing way:
"Gold Analysis Update
- Target: $2339
- Bullish Target: $2379
- Key Level: $2339
- RSI Indicator: Positive Divergence
- Chart Pattern: Bullish Channelb]Let's see if gold ca
[/n reach for the highs! #GoldAnalysis #BullishTarget #TradingView #wolrdforexttaders
Remember to keep your text concise and focused on the key points of your analysis. Good luck with your trading!

🚨$DJT: It's Not Over Yet! 🚀🚀🚀Hi everyone,
Despite a significant drop of 21% today, our indicators suggest the downtrend might not persist. A rebound above the daily level could signal a bullish trend, potentially leading to a weekly cross above the monthly. This could aim the price towards the $63 mark, aligning with the 0.618 Fibonacci resistance level. Conversely, if the price dips below the daily level, the monthly level could offer support. Let's see where this goes in the next few weeks.
Good luck!

GOLD 3 H TIME FRAM Full ? UPDATE READ THE CAPTION)⤵⤵🙏Hy traders Gold pair price All time high Bullish I want to agent Gold Bull 🐂 Gold pair price test New Ath 2340 NFP Gold pair price test 2280 agent Gold pullback bullish patterns testing 2329.
T echnical analysis update 3H time frame.
Analysis update 3H time frame update above avrege levels all target done ✅💯
2174 Berak above average 2188 + 2208 DONE ✅
2204 Break above avrege 2230+2250 DONE ✅
2250 Break above avrege 2263 +2290 DONE ✅
2290 Break above avrege 2300
+ 2324 DONE ✅
All above avrege levels successful 😄 closing trade have you good weekend 🎉

$GME: 🚨Most Important TA Ever Part 2 Heading Back to $14🚀🚀🚀Hi everyone,
Financials
GameStop is in an exciting phase of transformation and financial stabilization, as shown by its latest financial report. The company has successfully turned a significant loss into a net income, indicating not just resilience but strategic navigation through market challenges. A standout is the positive shift in EBITDA to $64.7 million, signifying GameStop's improved operational efficiency and ability to generate profit from its core activities. Despite a dip in net sales, GameStop has showcased excellent cost management and maintained strong liquidity. This, combined with strategic leadership enhancements, positions GameStop well for tapping into the evolving gaming and retail sectors. For investors, the improvement in EBITDA is a positive sign of GameStop's growing ability to fund operations, invest in growth, and potentially offer shareholder value from its main business operations, rather than relying on financial maneuvers or asset sales. This makes GameStop a compelling investment choice for those interested in a turnaround story within the dynamic retail and gaming markets.
Technical Analysis
Every time GameStop has made a double bottom, there has been a significant rebound to the upside.
May '21 + Aug '21 (+80%)
Mar '22 + May '22 (+149%)
Jan '23 + Mar '23 (+79%)
Nov '23 + Apr '24? (+?%)
The indicators continue to show a bearish trend, suggesting a potential further decrease in price. NYSE:GME recently touched the 0.786 Fibonacci retracement level. If positive news or market actions occur, there's a chance for a rebound up to the daily resistance.
Downside PT: $10.68
Upside PT: $14 and $15. (Price needs to stay above $12.78 for this to potentially play out).
Will be updating this as it plays out.
All the best!
Good luck and not financial or sexual advice. :)

$MARA: Ready to Launch! PT: $26Hello everyone,
NASDAQ:MARA price was able to get above the daily and weekly, suggesting a bullish orientation. Price will accelerate to $26. Looking at the daily and weekly as support.
Looking great for crypto miners so far.
NFA!

$SHIB: About to Rocket All the Way to the Moon 🚀Hi everyone,
Hope you all had a great weekend. After SHIB broke above the monthly indicator, price skyrocketed to 0.00004575. Now, we're seeing a weekly crossing the monthly which indicates a strong acceleration in price to the upside. Current price target is $0.00003275 and second price target is $0.00004998. The daily is acting as support as this manifests. As always, not financial advice :)
Good luck everyone!

GOLD 3 H TIME FRAM Full ? UPDATE READ THE CAPTION)Hello traders what do you think about Gold)
Gold pair price All time high Bullish Gold pair price 3H time frame break level of 2270 test 2280+ I think 💭 Gold pair price 2280+ 2290 of break out Next Movie possible 2300+ 2324 Gold pair price technical analysis update 3H Chart
Technical analysis update berak above avrege levels📉📈📊👍
✅ 2124 berak above avrege 2188+ 2208 Done ✅
2208 berak above avrege 2230+ 2250 Done ✅
2250 berak above avrege 2263+2280 Done
2290 break above avrege 2300+
2324 / looking a new Ath
^
Gold Buy. 2270
TP 2280
TP ^. 2290
SL @ 2265
G old sell 2300
TP ^ 2290
TP ^ 2280
SL @ 2305
Follow risk management
Don't forget like this analysis

EUR USD 3 H TIME FRAM Full ? UPDATE READ THE CAPTION)Hello traders what do you think about EUR USD)
EUR USD Technical Analysis 3H time frame update
Eurusd break level of big support levels 1.07237 pullback bullish patterns updates 3H time frame break level more above avrege levels
Technical analysis update 3H time frame update above avrege levels 📉📈📊
1.7699 Break above avrege 1.08097 Done ✅
1.08111 Berak above avrege 1.08559 looking now
1.08567 Berak above avrege 1.9330 looking now
EUR USD Buy 1.7667
TP ^ 1.08056
TP ^. 1.08567
SL @. 1.07237
Follow risk management
Don't forget like this analysis

what is the next move ? 🐺🤔Hello my friend .
I hope you fine ; if you readed my previous idea about BTC and also BTC.D probably you are one the people who actually survived form previous dump and now enjoy the profits ; if you missed them you can check them below :
BTC.D :
BTC :
So let's talk about the current BTC situation ; if you look at the daily chart you could defiantly see an obvious support level around the 60500$ area which is very important for BTC , if we lose this support the next support level is around the 50400$ and the ultimate support is somewhere around the 46000$ .
but for the bullish scenario we have to wait for the breakout from the downward slopping trend line which represents by the blue line , and in my opinion if BTC break above it we will see a massive run up to the 100K and even more so make sure to prepare your self for the both scenarios .
Have nice trades... 🐺

MCT/USDT Update Pump & Dump 10-04-2024MCT/USDT G-Money's short version analysis based purely on technical analysis only, no nonsense or "BS":
MCT/USDT still on watchlist waiting for a signal to enter trade. I do hope that nobody got tempted too much to enter pump & dump! It is a fastest way to loose hard earned money...
;)
Trade safe & don't do "gambling". In the end it never pays, not worth it to risk loose all your $...

GOLD 3 H TIME FRAM Full ? UPDATE READ THE CAPTION)Hello traders what do you think about Gold pair
Gold pair technical analysis
Gold pair price all time high 2267 resetting low support levels 2228) buyers reject level 2227) Gold pair price pullback bullish RSL 2267) now market breakdown of resistance levels 2267) I think 💬 Gold pair price if the 2270 possible for confirm Next Movie 2300)
Berish diamond levels buyer's
don't reject this resistance 2267 I think Gold pullback Berish fall same big support levels of 2228 breakout Next support 2205
2183 _ 2123
Gold sell 2300
TP ^ 2280
TP ^ 2270
SL. 2306
Gold sell. 2261
TP ^ 2250
TP ^ 2240
TP 2230
SL. 2267 .
Follow Must risk management
Safe trade don't forget like this analysis.

$DOGE: 🚨 Bull Run Imminent, Up Up and Away! Hi everyone,
Hope your weekend was awesome! DOGE just took off after surpassing the monthly indicator, hitting $0.22. Now, it's all eyes on the weekly, which is about to cross the monthly. We're eyeing a climb to $0.29 first. The daily is acting as support and solidifying the trend. As always, NFA!
Wishing you all the best!

( Gold pair price test diamond zone 2148) more Read caption 📌Hello traders what do you think Gold pair) OANDA:XAUUSD
Gold pair technical and fundamental analysis 📊📉📈
Gold pair price list week well bullish 2195 breakdown pullback Berish diamond zone2168) pullback bullish patterns closing 2179 I thank God price test supply zone 2195 pullback Berish testing diamond zone 2148) OANDA:XAUUSD
Safe trade 🙏❤ don't forget like and comments

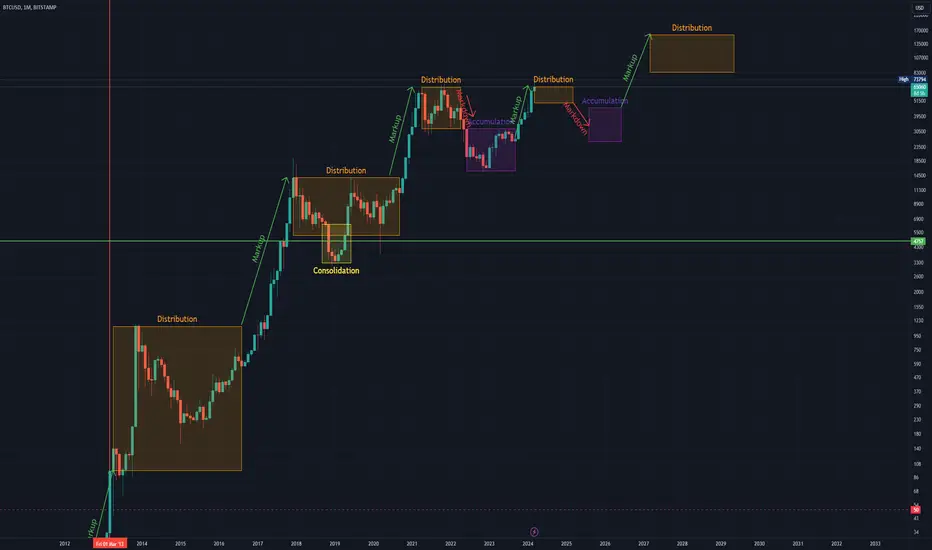
Possible (roughly estimated) Wyckoff cycle on BTCUSDThis is what I think may happen with BTCUSD based on Wyckoff cycles. I haven't checked the fibs or anything, so prices may be a bit inaccurate, but basically it works like this. Note that the prices here haven't been checked at all, and at the end of the day they don't really matter aside from the fact that market-movers know people look at them and use them to try to predict the market, which is nearly impossible unless you have enough money to set the market in your favor.
The people controlling the price (whales, institutions) can set walls wherever they want. They can cause the price to either oscillate within a range, to go up, or to go down. They are counting on human emotion (FOMO/ FUD) to drive the price one way or another.
Note also that, during cycles of Accumulation or Distribution, they are still accumulating during the lows of the Distribution cycles or the highs of the Accumulation cycles. So within these cycles are cycles of a lower magnitude.
The point is, the price is going to keep going up, because the asset has a fixed supply. They can prey on human emotion and lack of market education to predict what "most people" (the fish) will do. At the same time, they hold enough to setup walls and keep the price within certain ranges, allowing them to sell at the highs of that range and buy back in at the lows of the range.
This sounds stupid, because it literally is "sell high / buy low". In this case though, it isn't really all that stupid, because they can set the high and lows by creating buy and sell walls wherever they want to. Only a more powerful whale can really break their ranges, but that's pointless because it is in their best interest to work together and take the money from people trading on the daily, hourly and even sub-hourly oscillations. After all, they aren't counting on something going "to da moon" to pay their bills. They have enough money to survive a crash, or to capitalize on a "breakout" (which is when they stop selling and keeping the price within a range).
Most of these prices will look random, which they kind of are. But it's like putting 5 metronomes on a platform with a couple of cylinders beneath it - eventually the metronomes sync up. So their goal is less to "make money on this next day" than it is to "figure out a range that works in our best interest, and keep it going for as long as the little guys keep playing ball". Once smaller-time investors (people who have to go to work or are counting on good trades to pay their bills) dry up, they simply stop holding the price down and let people continue to buy. These are the people you should be following, because ultimately, they control the price.
That's the beautiful thing about Bitcoin. Its value is not predicated upon who has the most missiles, or who is developing some groundbreaking new technology. It is only predicated upon the assumption that it works, which it does (as a means of transferring value from one individual to another in a secure manner).
Altcoins are typically people trying to "print more bitcoin" by piggybacking off of the crypto movement in general and hoping enough fish bite the hooks. There are very, very few altcoins that have any intrinsic value which Bitcoin doesn't already have. I can't even think of one right now, so if you can please let me know.
Gold price should buy again?Hello, dear freinds
Discover an enticing Buying opportunity in GOLD as it undergoes a critical retest of a key support area. With market analysis, technical indicators, and price action as your allies, evaluate the potential upside move. Stay vigilant and informed to capitalize on this precious metal's market dynamics.

Bitcoin Heading to 64.8kTraders,
Bitcoin is likely to start making daily lower highs this next week. Of course, we have another FOMC meeting coming up which will add a level of uncertainty and possible volatility. I have been hoping for a retrace down to that 64.8k level (ascending multi-year support/resistance) and I think we'll get it.
Above I have the proposed path that price might take. Once we have tagged that 64.8k level the question becomes, "What's next?".
Remember, we have an 80k inverse H&S target which we have NOT hit yet. And as long as we remain above that multi-year support level, my experience tells me that we'll probably bounce there and continue upwards. However, as always, we have to prepare for the other scenario as well, that we continue down.
If we continue down, then likely we'll retest that purple neckline around 48k. And, IMO, that may be one of the last times you'll ever see 48k on BTC again. Even with the looming U.S. recession/depression that should begin sometime this year (and it will be bad), I see Bitcoin holding it's ground and remaining relatively strong overall against other asset classes.
Best in all your trades,
Stewdamus

MINA Analysis: Potential Correction, SELL or BUY Setup?!🍣📈Weekly Channel Breakout and Retest:
MINA previously broke out of its weekly channel and reached its target successfully.
The recent breakdown below the channel indicates a loss of bullish momentum and potential for a retracement.
🔍📉Corrective Phase and Resistance Levels:
If MINA undergoes a correction, it is likely to retrace upwards until reaching its weekly resistance level.
A rejection at this resistance level, coinciding with the RSI reaching the daily blue resistance line, could present a selling opportunity.
🚫Early Sell Setup and Risk Management:
A sell position could be initiated early at the current price level (below the lower channel line) using the red trigger line as confirmation.
Trailing the stop-loss to the lower support zone can help mitigate risk and maximize profit potential.
✅Important Considerations✅
The overall market trend should be taken into account before executing any trades.
Confirming the reversal with additional technical indicators and market sentiment analysis is essential.
🚫This analysis is for educational purposes only and should not be construed as financial advice. Always conduct your own research and employ sound risk management practices before trading.
🚫

SPY to $460Overview
Utilizing trading patterns and consistencies between several technical indicators, I believe the equity market will begin to unload soon as traders collect their profits from the recent rally and prepare for the next FOMC meeting on 19-20 March.
Trading Patterns
SPY is currently undergoing a rising wedge which is a bearish trading pattern. Within the wedge, I outlined an impulse wave pattern which shows SPY at what may be the peak of the third wave. Rising share price on dwindling volume, in addition to divergences spotted on the RSI, MFI, and MACD, lead me to confidently believe a dip to around $460 is approaching.
Price Target
I used the support and resistance lines of the macro rising wedge to determine the paths of the impulse waves, assuming their troughs and crests will reach the respective lines. Presuming the rules of impulse waves hold true then the fourth wave cannot end pass the crest of wave one, which falls in line with the 50% retracement level of the third wave (blue and red Fibonacci tools). This level rests at a share price near $460.
Utilizing a larger Fibonacci tool to encompass the entire rising wedge and a projected fifth wave crest as 100%, the $460 share price is around the 61.8% Fibonacci level (when used in the uptrend).
Supporting Technical Indicators
The MACD shows a divergence as well as an approaching cross over its signal line from above.
While not as prominent as MACD, the RSI also shows a divergence between the share price and peaks within the RSI oscillator. I've highlighted the divergence by placing a horizontal line at the end of the first peak. It is also reflecting overbought signals.
The MFI shows a sharp negative slope but the SPY share price is still rising. This divergence, aligned with the signals of the other two indicators, suggests the share price may be about to drop.
