COACH VS BOSS / RECOGNIZING BOSS FORMATION ON CHART 📊Hello Traders!
I want to show you the importance of Boss formation in trading, and how to recognize this formation on a chart.
Traders, if you liked my idea or if you have a different vision related to this trade, write in the comments. I will be glad to see your perspective.
____________________________________
Follow, like, and comment to see my content:
www.tradingview.com
Technicalindicators

CADJPY SHORTWe are at the technical pullback area on the 4H and the 15m is looking like it is turning bearish at this moment.

Pullback in $NVDA forthcoming.$NVDA:1D
+27% since June 1, 2023 and well positioned for a pull-back down to the 460 price region (yellow horizontal line).
Signal is just coming out of overbought on 1D RSI.
Bear tombstone doji followed by bearish outside bar.
Volume flows (vfi) remain positively constructive which could blunt the extent of downside price action.
Not financial advice.

EURJPY SHORTWe are at a key level on the 4H, with the lower timeframes consolidating and turning bearish.

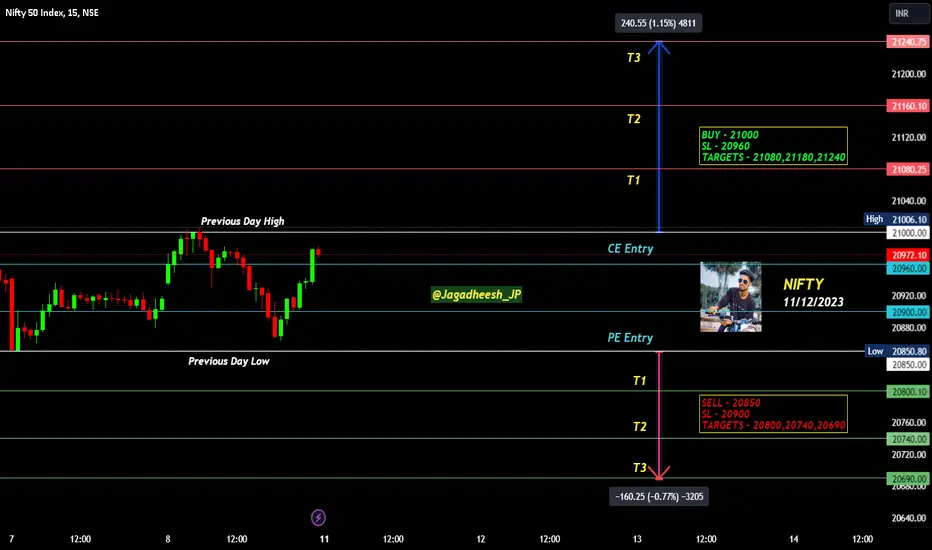
NIFTY INTRADAY LEVELS FOR 11/12/2023BUY ABOVE - 21000
SL - 20960
TARGETS - 21080,21180,21240
SELL BELOW - 20850
SL - 20900
TARGETS - 20800,20740,20690
NO TRADE ZONE - 20850 to 21000
Previous Day High - 21000
Previous Day Low - 20850
I am sharing NIFTY levels this levels acts as important support & resistance for intraday. if you want to trade with this levels wait for 15 min Candle closing above that levels. You can trade with breakout and reversal both.
In this channel, I share my expertise in trading strategies, technical analysis, and market trends to help you make informed decisions in your trading ventures.
Stay tuned for daily updates, in-depth market analyses, and real-time trading scenarios to witness firsthand how we transform from Zero to Hero in the trading world. My Only aim is to empower you with the knowledge and skills necessary to navigate the complexities of the financial markets successfully.
Based on price action major support & resistance's are here, the red lines acts as resistances, the green lines acts as supports. If the price breaks the support/resistance, it will move to the next support/resistance line. White lines indicates previous day high & low, high acts as a resistance & low acts as a support for next day.
Please NOTE: this levels are for intraday trading only.
Disclaimer - All information on this page is for educational purposes only,
we are not SEBI Registered, Please consult a SEBI registered financial advisor for your financial matters before investing And taking any decision. We are not responsible for any profit/loss you made.
Request your support and engagement by liking and commenting & follow to provide encouragement
HAPPY TRADING 👍
$BTCUSD Approaching Monthly Liquidity level - LONGMonthly Liquidity Level (MLL) : BTCUSD is currently approaching a critical Monthly Liquidity level at 39965, historically significant for its role as support or resistance.
Anticipated Increase : An expected 5.6% surge within one candle is predicted. This surge is considered a precursor to the initiation of a long-awaited Bull Cycle.
Long-Term Target: The analysis sets a bullish target at 131k, suggesting a sustained upward trend beyond the immediate surge.
Probability Indicator : Recent market activity indicates a substantial inflow of capital over the past few days. This positive money flow is a bullish signal.
Volatility Assessment : Volatility has remained stable leading up to the critical level. However, anticipation is for a spike in volatility, especially with the liquidation of short positions at 39965.
Risk Factor : Traders should exercise caution as predicting price movements, especially in cryptocurrency markets, involves inherent risks. It's crucial to monitor the situation closely and be prepared for unexpected market reactions.
This analysis combines key technical elements, emphasizing the significance of the Monthly Liquidity level, anticipated price movements, and the interplay of volatility and market sentiment. Always consider risk management strategies when acting on technical analyses.

ALT Season Is Starting - Total Market Cap 2MartyBoots here. I have been trading for 16 years and I am here to share my ideas with you to help the Crypto space.
This video and chart helps show you ALT Season is about to start.
The ALT Market is in its bottoming phase, be prepared. ALT Season is coming. This is the time when its possible to make life changing money .
Do NOT miss out on this coming bull market
CryptoCheck Team

$NVDA downside gap-fill potential!NASDAQ:NVDA ,1D: Price dipped just below the 50% line and popped back up over the line after coming off the local lows at 403. Given the 'uncertainty' around the level and duration of a 'higher for longer' rate environment along with the market's general preference for 'clarity' over 'uncertainty', it would not be unreasonable to expect the 'increased volatility' that comes with 'uncertainty' until some level of 'clarity' can be established around the duration of the current 'higher rate environment'.
Further adding to the potential for 'market uncertainty' and 'lack of clarity' are the tenuous and ongoing negotiations between the U.S. and China around access to semi-conductor IP. NASDAQ:NVDA utilizes the cost benefits provided to its model from the 'cost efficiency' of both Chinese and greater Asia's manufacturing and production capacities. Were trade relations around semi-conductor IP between China and the U.S. to become 'less amenable', the deterioration of that relationship could adversely impact NASDAQ:NVDA 's margins.
If NASDAQ:NVDA had to re-establish production/manufacturing supply chain relationships elsewhere this could inject 'uncertainty' into the price discovery process. These are 'unknown unknowns' at this point and hard to factor into analysis, but at a minimum, they would increase the potential for 'market uncertainty' and the subsequent 'lack of clarity', which often leads to 'price volatility' until some level of 'certainty' could be re-established.
Looking at our 1 day RSI against price I am seeing a 'bearish divergence' whereby price makes 'higher-highs' and 'higher-lows' while the RSI prints 'lower-highs' and 'lower-lows'. This can be taken as a 'leveling off' of momentum that often precedes a change in price direction or, at a minimum, a significant pull back within a constructive trend. (see light violet curves)
I would expect that a downside 'gap fill' could be a 'necessary evil' at some point in time across the next 6 weeks or so, and before further gains to the upside could probabilistically be portended from a structural standpoint. The bottom of the gap fill is roughly in confluence with the YTD VWAP (peach).
NOT FINANCIAL ADVICE. ALL STOCKS CAN GO TO ZERO.

A Novice's Handbook to Trading Triumph
-----
🙏
In an era where financial landscapes evolve rapidly, venturing into the dynamic domain of foreign exchange (Forex) trading need not be an intricate odyssey. This novella of wisdom unveils the rudiments, steering you through the intricate labyrinth of setting up your financial fortress, handpicking the tools of the trade, deciphering the enigmatic timelines, and sculpting entry strategies with the finesse of an artisan.
Navigating the Terrain of Account Setup:
Your journey commences by selecting the sturdy vessels of financial exploration, the likes of Coinbase, revered for transmuting mundane currency into the futuristic realms of cryptocurrency. Navigate the seas of connectivity, tethering your accounts to the steadfast anchors of Visa, Mastercard, or the versatile iDeal. Venture further into the undiscovered territories with a seasoned guide – Tradersway, an oracle in the realm of brokers, beckoning with bespoke options for an authentic trading saga.
Sculpting the Trading Landscape: Platforms and Tools as Your Artistic Palette
Forge your path with MetaTrader 4 (MT4), the canvas for your live trading masterpiece. Unveil the ethereal allure of a Virtual Private Server (VPS), akin to a mythical power-up, enriching your automated trading endeavors. Wander into the meadows of TradingView, where user-friendly charts bloom, and ideas spring forth from a convivial community of traders. Consider wielding the nNouSign indicator, a magical wand for crafting diverse trading strategies.
Chronicles of Time: Timeframes for Poetic Analysis
For decisions swift as the flutter of a butterfly's wing, gaze upon the 5-minute (5M) and 15-minute (15M) charts, where markets pirouette in perpetual rhythm. Should your ambitions soar higher, ascend to the 1-hour (1H) chart, where profit potential unfurls like a tapestry woven with the threads of time.
Crafting Entry Strategies: The Artistry of Navigating Waves
In the realm of 5M and 15M, embrace the mystique of the nNouSign indicator on TradingView, intertwining with the 21 Linear Weighted Moving Averages (MA) on the sacred grounds of MT4. Enlist the Williams Percent Range (WPR) at 40, a beacon illuminating shifts and retests. Draw lines, as an artist sketches contours, on both your chart and the WPR canvas for heightened insights. Decipher the harmonies between MA and WPR, directing the symphony of buying and selling. Set the crescendo with Take Profit (TP) at favored peaks or where echoes of prices linger in the corridors of time.
The sonnet of 1H unfolds with kindred strategies, casting TP anchors where your heart desires or where the echoes of prosperity resonate. Anticipate the ballet of trends, choreographed by the highs/lows of yesteryears or the harmonious convergence of MA and WPR.
Risk Management: Navigating the Seas of Uncertainty
As the helmsman of your financial vessel, chart the waters of risk with sagacity. Know the depths you are willing to plunge for the elusive treasures of profit. Let stop-loss orders be the vigilant guardians against tempests, strategically placed to avert colossal losses. For instance, on a £300 expedition trading XAUUSD with a 1:500 leverage, let the StopLoss, a guardian set at 200 pips, stand steadfast at 1987.00 for a buy trade anchored at 1989.00. As you navigate, survey the constellations of currency pairs—those that pirouette in unison and those that waltz in opposing directions.
Educational Alchemy: The Chronicles of Wisdom
Embark on an odyssey through the scrolls of easily decipherable Forex education platforms. Join the symposiums of Forex communities, where sages share their sagas and novices glean the pearls of insight. Chronicle your journey, the trials, and the triumphs in the scrolls of a journal, an atlas mapping the uncharted territories of your evolving knowledge.
Epilogue: 🌹
In the grand tapestry of Forex trading, the loom is not as daunting as it may seem. Armed with the artisan's tools, weave your narrative, learning with every stroke of the quill. Navigate the seas of risk with the astuteness of a seasoned mariner, adjusting your course with each gust of the trading winds. In the realm of Forex, the adventure unfolds not as a tumultuous tempest but as a voyage guided by the stars of knowledge. Bon voyage, intrepid trader! May your odyssey be as prosperous as the markets are ever-changing.
-----
❣️

Shifting Sentiment in DIS Ahead of Earnings?NYSE:DIS stock has struggled this year. However, Accumulation/Distribution on this daily chart shows accumulation over the past several weeks. This is a "shift of sentiment" pattern indicating a better earnings report is likely this time.
The sideways trend is compressing and has consistent lows and highs, a common pattern for accumulation. When Accumulation appears well ahead of an earnings report, it usually (but not always) indicates improvement in fundamentals and establishes a base price for the improvement.
DIS is a target for HFTs since it's a household name stock that gets a lot of attention in the news.

The Expected Bounce was on Queue. Tomorrow We Drop.Traders,
We have been batting 1000 lately when it comes to the SPY. Might as well make another bold prediction. It would seem that the greatest probability of price action is outlined in the chart. An inverse H&S is forming and the right shoulder has yet to start.
I predicted the target down from the last H&S pattern to be 410. That was hit, almost to the dollar. I then predicted a huge bounce. We have that now. In fact, 7 days of green candles! Amazing. I even predicted the timing of the bounce. The charts gave me all of this data. I just had to read it correctly.
Now, the chart is telling me that it's time for a bit of a pause. If correct, we should see the right shoulder from that inverse H&S drawn now begin to form. If we're lucky we stay in my outlined green channel by using that 200 day ma near the bottom of the channel as support.
Blowoff top underway!
LFG!
Stew

TonCoin is ready for the next climb
When others correct and Toncoin will start to move. Climbing up to the price of 3.9$ ...
Irrespective of the emerging pattern, with this routine and clean chart and high potential, "TON" seems to present another climb to his fans.

AVAX TO 17.43?BINANCE:AVAXUSDT Has been on a tired bullish trend for a long time, acceleration trendlines are broken at this point. So if you´re searching for a long you need to look out for a proximate retreatment

$ON: EV headwinds are priced in.$ON:1D
With the earnings forecast providing downside price pressure on the longterm trend, NASDAQ:ON hits the lowest level on its1D RSI in over two years.
Needless to say, our trend has been weakened from a Pearson’s R^2 of 0.91 down to a Pearson’s R^2 of 0.88 while losing a little more than 3% of the longterm trend strength in the process.
While there are significant headwinds facing the EV market at current, from supply constraint’s on graphite to scaling EV’s across our shaky electrical grid system, it seems as though NASDAQ:ON has those concerns ‘overly priced in’ and could be poised for a rebound along with the broader semi-conductor market.
I would expect NASDAQ:ON to make an attempt at coming ‘back in line’ with its long term trend and to make a move up to the lower 3rd standard deviation line at 76.49 and possibly higher before year’s end.
Not financial advice. All stocks can go to zero.

Conservative bullish USD/JPY setupThe USD/JPY pair is exhibiting a bullish sentiment due to the US's economic resilience and the recent slump of the Yen. The pair is approaching a significant level of 150, which is being closely watched by the market for possible intervention by Japanese monetary authorities. The Federal Reserve and the Bank of Japan's policy decisions, along with upcoming economic events, are expected to significantly influence the pair's movement. Although there's a bullish tendency, caution is advised due to the potential for intervention around the 150 level.
Entry Point: 148.50 (on a retracement).
Stop Loss: 147.50 (100 pips cushion to manage downside risk).
Take Profit 1 (TP1): 150.00 (conservative target considering the potential for intervention around this level).
This setup aims to capture a bullish move while exercising caution around the significant 150 level.

Pro Trader Patterns for Swing TradingThis important exchange has been doing very well with options and futures contract sales.
NASDAQ:CME had a classic pre-earnings run up fueled by professional traders swing trading, out of a platform support level.
The retracement was only a sympathy move with retail knee-jerk reactions due to the fear around the stock market at this time, not an indication of the company's earnings report or growth potential.
The stock is not at its all-time high level yet, so it can run further before slamming into strong resistance.
On the monthly chart, it has a Double Trough on DPO, which is a strong indication for the stock's long-term cycle.

Another Bolish position for Solana ...Another head and shoulders pattern on Solana's chart...and the possibility of another rally for Solana to around $32.20 .
In the previous analysis, Solana reached exactly the predicted growth with a similar pattern...
Everything is ready to increase the price of Solana.

Analyzing GOLD: Market Dynamics and Trading strategyThe XAU/USD currency pair, a dynamic interplay between gold and the US dollar, is currently navigating through pronounced market fluctuations. In this comprehensive analysis, we will delve into the intricate interplay of fundamental factors steering the value of XAU/USD. Our focus extends to the looming potential of The Federal Reserve's interest rate adjustments, the consequential shifts in the 10-year US Treasury Yield, and the intricate repercussions woven into the fabric of the Russia-Ukraine and Israel-Palestine conflicts.
Moreover, we will embark on a journey through the undulating terrain of gold price fluctuations, deciphering their nuanced implications for the volatility inherent in this currency pair. As we scrutinize both the fundamental and technical dimensions, our aim is to provide traders with a nuanced understanding of the multifaceted forces currently at play, guiding them toward informed and strategic trading decisions. Join us as we unravel the layers of complexity inherent in the XAU/USD market, offering insights that transcend the surface, into the heart of this captivating financial landscape.
Fundamental Analysis
Potential Rise in The Fed's Interest Rates
The Federal Reserve, the central bank of the United States, stands at the forefront of XAU/USD trader considerations. Despite maintaining interest rates in the latest meeting, speculation about future rate hikes has introduced uncertainty. A hike in interest rates could diminish gold's allure as a risk-free investment alternative. Gold investors tend to favor assets offering higher yields when interest rates rise.
Increasing 10-Year US Treasury Yield
The recent upswing in the 10-year US Treasury Yield over the past few months has adversely impacted XAU/USD. Gold, often considered a safe-haven asset, typically experiences decreased demand as bond yields rise. Investors seeking protection tend to shift towards bonds offering higher returns than gold, resulting in a decrease in the value of XAU/USD.
Impact of Russia-Ukraine and Israel-Palestine Conflicts
Geopolitical uncertainty stemming from the Russia-Ukraine and Israel-Palestine conflicts plays a pivotal role in the dynamics of XAU/USD. As a traditional safe-haven asset, gold tends to attract attention during periods of uncertainty. Elevated geopolitical tensions increase the demand for gold, contributing to an upsurge in the value of XAU/USD.
Gold Price Fluctuations: Implications for XAU/USD
The notable fluctuation in gold prices, reaching $1,750 per ounce on September 21, 2023, and subsequently declining to approximately $1,700 per ounce on October 20, 2023, reflects significant market volatility. The dip in gold prices could be attributed to a combination of factors, including expectations of interest rate hikes and a shift in investor preferences towards higher-yielding assets.
Technical Analysis
Indicator Analysis
XAU/USD exhibits overbought signals on the STOCHRSI(14) and MACD(12,26) indicators. However, the elevated volatility serves as a warning for potential market direction changes. The 200-day Exponential Moving Average (EMA) confirms a bullish trend, instilling confidence in traders.
Support and Resistance Levels
According to Barchart, current support and resistance levels are as follows: 1st Resistance Point at 1,986.06, Last Price at 1,994.86, 1st Support Level at 1,954.30, 2nd Support Level at 1,934.11, and 3rd Support Level at 1,914.30. These levels serve as crucial guides in planning trading strategies.
Trading Strategy
The employed trading strategy involves entering positions after the price breaks and retests the breached support and resistance (S&R) levels. The target price is set before the next resistance level or prior to the Fed speech on October 25, 2023, considering potential unforeseen events.
Trade Parameters
Based on the above analysis, several trade parameters are identified:
Entry Point: When the gold price rises and re-test the previous resistance level.
Stop Loss: Placed below the nearest support level to safeguard against sharp declines.
Target Profit: Before the next resistance level or prior to the Fed speech on October 25, 2023, considering potential unforeseen events
Conclusion:
This analysis illuminates the intricacies of XAU/USD, emphasizing the intertwined nature of complex fundamental and technical factors. As investors grapple with potential Fed rate hikes, changes in the 10-year US Treasury Yield, and geopolitical conflicts, a comprehensive understanding of risks is essential. The fluctuation in gold prices serves as a vital indicator, highlighting the need for vigilant monitoring of news and Federal Reserve policies. In navigating these volatile market conditions, prudent trading strategies and effective risk management become indispensable for success in trading XAU/USD.

The 150 and 200 EMA Trading Strategy Hi guys kindly watch the video and back test this strategy let me know what you got.
Drop your comments and feedback.

Observing SPX Range-Bound Move: Be Caution and Stay AlertToday, I wanted to draw your attention to the recent performance of the SPX, which has been exhibiting a range-bound behavior over the past year. As we navigate through these uncertain times, it is crucial to stay vigilant and monitor the market closely.
Over the last year, the SPX has shown a tendency to trade within a specific range, with price movements oscillating between key support and resistance levels. This range-bound behavior implies that the market has been lacking a clear direction, making it essential for investors to exercise caution and closely observe the price action.
Currently, the SPX is hovering around the $4569 level, which serves as a significant resistance point. Should the price break through this level decisively, it could potentially signal a bullish trend. In such a scenario, it may be prudent to consider long positions, taking advantage of the potential upside momentum.
On the other hand, it is equally important to be prepared for a potential downside move. If the price falls below the long-term support level of $3800, it could indicate a bearish trend. In this case, it may be wise to consider short-term positions or even adopt a more cautious approach in the long term.
Given the current market dynamics, I encourage you to closely watch the SPX's price movements, paying particular attention to the key support and resistance levels mentioned. By doing so, you will be better equipped to make informed investment decisions and navigate the market with prudence.
As always, it is essential to remember that investing involves inherent risks, and past performance is not indicative of future results. Therefore, I recommend consulting with a financial advisor or conducting thorough research before making any investment decisions.
Should you have any questions or require further assistance, please feel free to comment below.


UNITY : Livetrade using simple TA and Band of Midas1. Clear all drawings and indicators.
2. A horizontal support line consists of 18Aug23 low and previous breakout level, observe if price reversed at here (React Don't Predict).
3. Add BandofMidas from indicators. Use Midas factor of 9.( suitable for this chart)
4. Price fall into Midas zone and reversed. Midas line still in pink. Double confirmed.
5. CONSIDER to go long, nothing 100%
6. Plan your trade, risk reward ratio. GO Long.
In my opinion, this is a news driven panic sell.
im LONG with $1 cut loss risk.

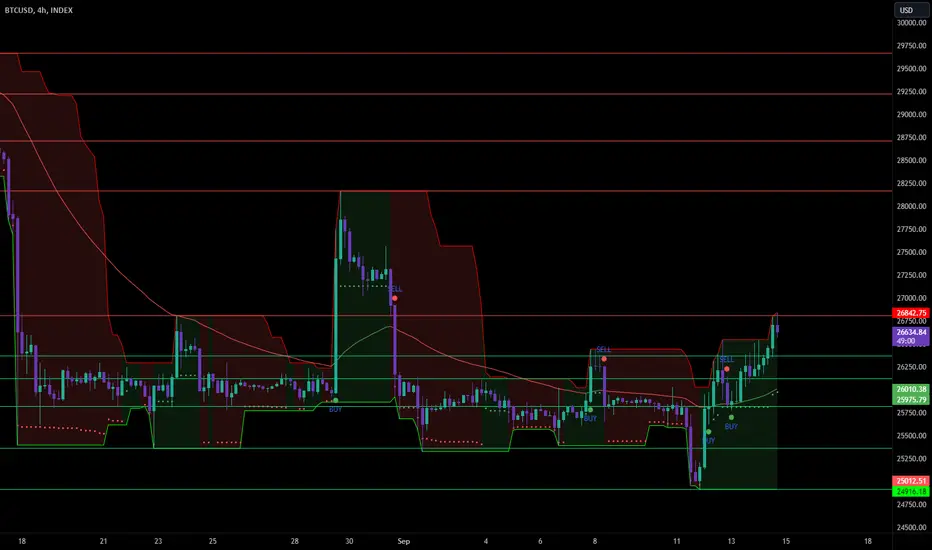
BITCOIN $26850 RESISTANCE: What's the Next Move, Fellow Traders?Hey there, crypto enthusiasts! I've got some exciting updates on Bitcoin's recent price action that I just couldn't wait to share. So, after that bounce from the $24,925 level, things got pretty interesting.
First of all, we witnessed a big spike in the price. You know, one of those moments that really get your heart racing! 💥 And if that wasn't enough to make you smile, there's more good news. We got ourselves a solid buy signal, which is like music to any trader's ears.
But wait, there's more! 🐂 The charts are showing some seriously bullish signals. It's like the crypto stars are aligning. Plus, we had a close above the EMA 50, which is often a sign of strong bullish momentum. 📈
Now, what's on the horizon? Well, it looks like a retest of the EMA 50 might be in the cards. It's a crucial level that often acts as both support and resistance. So, keep a close eye on that!
The big question now is, what's the next move for Bitcoin? Are we going to smash through that $26,850 resistance level and keep soaring to new heights? Or will we encounter some turbulence along the way?
I'd love to hear your thoughts and predictions! Let's have a friendly crypto chat and see where we think Bitcoin is headed next. 🚀💰